

doi: 10.3324/haematol.2021.279296.
Stored blood has compromised oxygen unloading kinetics that can be normalized with rejuvenation and predicted from corpuscular side-scatter
Affiliations
- PMID: 34498445
- PMCID: PMC8719080
- DOI: 10.3324/haematol.2021.279296
Item in Clipboard
Stored blood has compromised oxygen unloading kinetics that can be normalized with rejuvenation and predicted from corpuscular side-scatter
Haematologica.
.
No abstract available
Figures
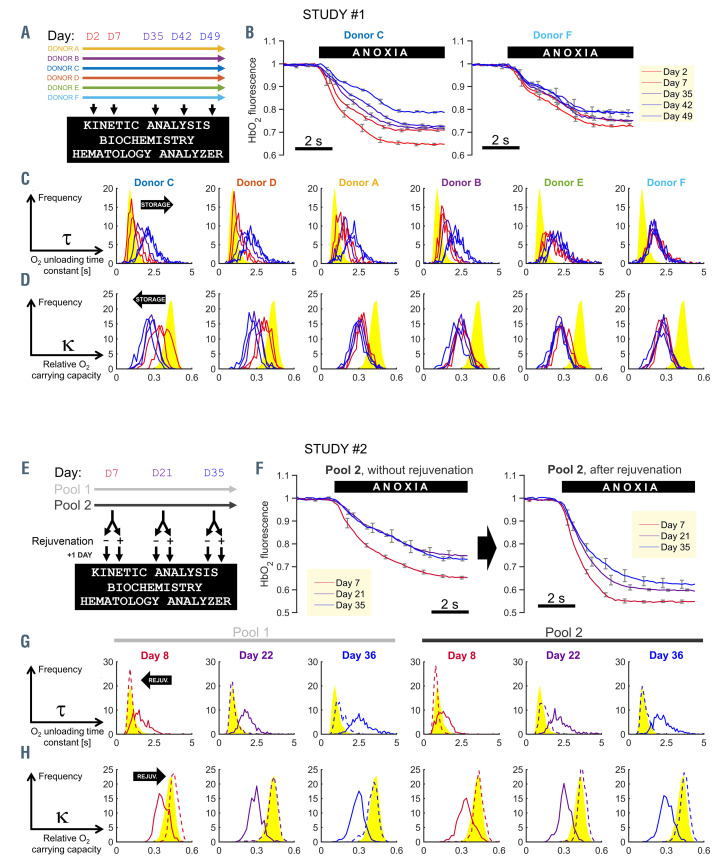
The kinetics of O2 handling in red cell concentrates are dependent on storage duration and donor, and can be normalized with rejuvenation treatment. (A) The protocol of study #1 showing color-coding for donors and indicating the days at which red cell concentrates (RCC) were sampled for analyses. (B) Example time course of HbO2 saturation in response to a rapid solution maneuver that reduces extracellular O2 tension to anoxic levels. Measurements on RCC from donor C (left) or F (right) at days 2, 7, 35, 42 and 49 of storage. Each line represents the mean of ten red blood cells (RBC); error bars are the standard deviation (SD). (C) Histograms of O2-unloading time constant t grouped by donor, and plotted for storage days 2, 7, 35, 42 and 49 (red transitioning to blue as storage duration increases). Each histogram was constructed from at least 300 RBC. Reference data from freshly collected venous blood are shown in yellow. (D) Frequency histograms of O2-carrying capacity k. (E) The protocol of study #2 showing color-coding for RCC pools #1 and #2 and days at which biochemical rejuvenation and analyses were performed. (F) Example time course of HbO2 saturation response to anoxia (mean±SD of ten cells from RCC pool #2). (G) Histograms of t, color-coded by storage duration (red to blue). Dashed lines denote measurements from rejuvenated units. Each histogram was constructed from a total of at least 300 RBC. Reference data from freshly collected venous blood are shown in yellow. (H) Frequency histograms of k.
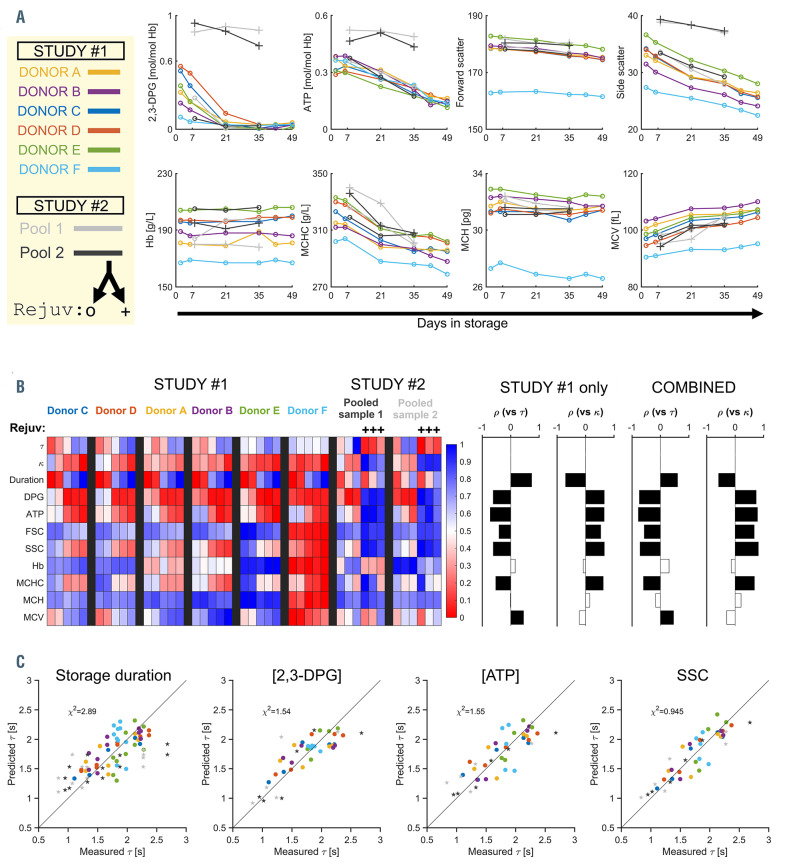
Storage-related dysfunction of O2 handling relates to the level of 2,3- diphosphoglycerate but is best predicted by side-scatter measured on the RETRBC- Z channel of hematology analyzers. (A) Biochemical, blood count, and flow-cytometric parameters measured in red cell concentrates (RCC). Color-coding refers to the donor (study #1) and RCC pool (study #2). Parameters include concentration of diphosphoglycerate ([,3-DPG]), [ATP], blood [Hb], mean corpuscular hemoglobin concentration (MCHC), mean corpuscular hemoglobin (MCH), mean corpuscular volume (MCV), corpuscular forward- and side-scatter (FSC, SSC) after treatment with Cellpack DFL. (B) Summary of parameters (scaled to a range 0-1) determined by single-cell HbO2 saturation imaging (t, k), biochemistry (2,3-DPG, ATP), RET-channel flow cytometry (FSC, SSC), and standard hematologic indices ([Hb], MCHC, MCH, and MCV). Correlations with t or k determined by Spearman test for datasets in study #1 alone, or the combined datasets from both studies. Filled bars indicate significant correlation (P<0.05). (C) Regression analyses determining the ability of storage duration, [,3-DPG] normalized to [Hb], [ATP] normalized to [Hb], or SSC to predict actual t. Sample-level effects were modeled as a random intercept. Circles and stars indicate data from study #1 and #2, respectively. Goodness-of-fit was quantified by the χ2 test.
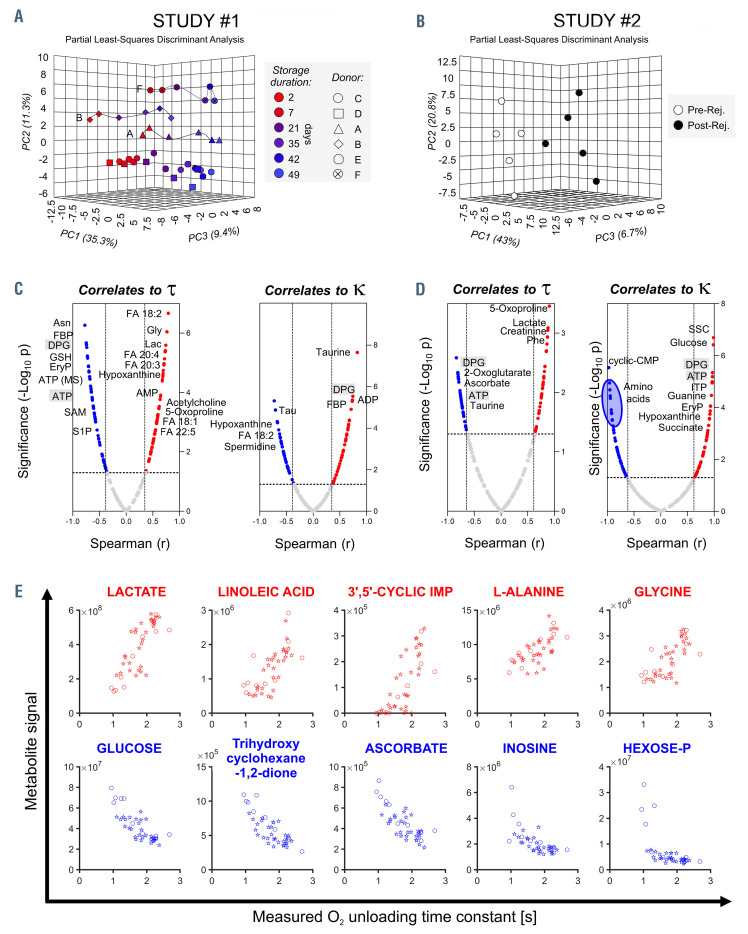
Metabolomic analyses of red cell concentrates under storage and after rejuvenation identify correlates to O2-handling kinetics. (A) Mass spectrometry analyses (MetaboAnalyst) of red cell concentrates (RCC) from study #1. Partial least square-discriminant analysis (PLS-DA) indicates a significant impact of storage duration and inter-donor variability on metabolic phenotypes. Metabolites with the highest loading weights in principal components (PC) 1 and 2 were affected by storage duration across all samples (~35% of the total variance) and biological variability between donors (~11%). (B) Metabolomic analyses of RCC before and after rejuvenation. Rejuvenation had a significant impact on metabolites with the highest loading weights in PC1 (43%). (C,D) Metabolic correlates (Spearman test) to t or k for units under study #1 (C) and study #2 (D). Metabolites-of-interest are highlighted. These include 5-oxoproline and lactate as correlating positively with t; C18/20 free fatty acids (e.g. linoleic) as correlating positively with t and negatively with k; fructose 1,6-bisphosphatase (FBP) and inosine triphosphate (ITP; in rejuvenated pools, possibly a result of the inosine boost), the pentose phosphate metabolite erythrose 4-phosphate (EryP) and sphingosine 1-phosphate (S1P), dicarboxylates (2-oxoglutarate, fumarate, succinate, malate), ascorbate/dehydroascorbate, and the amino acids taurine and phenylalanine (Phe) as correlating negatively with t. DPG: 2,3-diphosphoglycerate; FA: fatty acid; Gly: glycine; Lac: lactate; SAM, S-adenosyl methionine. (E) Top five metabolites correlating positively (top, red) and negatively (bottom, blue) with t, using data from study #1 (circles) and study #2 (stars). These correlations were equal to or better than for [,3-DPG].
References
Publication types
MeSH terms
Substances
Grants and funding
LinkOut - more resources
Full Text Sources
Other Literature Sources
