. 2022 Sep;52(9):3840-3860.
doi: 10.1007/s10803-021-05256-6. Epub 2021 Sep 9.

Exploring Sensory Subgroups in Typical Development and Autism Spectrum Development Using Factor Mixture Modelling

Affiliations

Exploring Sensory Subgroups in Typical Development and Autism Spectrum Development Using Factor Mixture Modelling

Patrick Dwyer et al. J Autism Dev Disord. 2022 Sep.

Abstract

This study uses factor mixture modelling of the Short Sensory Profile (SSP) at two time points to describe subgroups of young autistic and typically-developing children. This approach allows separate SSP subscales to influence overall SSP performance differentially across subgroups. Three subgroups were described, one including almost all typically-developing participants plus many autistic participants. SSP performance of a second, largely-autistic subgroup was predominantly shaped by a subscale indexing behaviours of low energy/weakness. Finally, the third subgroup, again largely autistic, contained participants with low (or more "atypical") SSP scores across most subscales. In this subgroup, autistic participants exhibited large P1 amplitudes to loud sounds. Autistic participants in subgroups with more atypical SSP scores had higher anxiety and more sleep disturbances.

Keywords: Auditory P1; Auditory event-related potentials (ERPs); Autism; Factor mixture modelling; Heterogeneity; Sensory processing.


Conflict of interest statement

The authors have no relevant conflicts of interest to declare.

Figures

Fig. 1
Fig. 1
Fronto-central channels in either hemisphere selected as the measurement region for the P1 component are indicated with a yellow dot. Channel positions may appear slightly irregular; this is because channel positions are based on actual electrode positions obtained from a subset of participants using a Polhemus digitizer
Fig. 2
Fig. 2
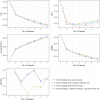
Information criteria (AIC, BIC, SABIC), log-likelihood, and entropy fit indices from the various models. Low values of AIC, BIC, and SABIC should be interpreted as signs of superior model fit, while higher values of entropy and log-likelihood suggest superior fit. Note that a model with only factor loadings varying across classes (1, red line) was selected. Here, entropy appears to favour a two-class solution and BIC a three-class solution, while other fit indices appear to suggest continued improvements through to seven classes
Fig. 3
Fig. 3
Boxplots comparing autistic participants assigned to different classes, overlaid by individual participants’ scores. From left to right and top to bottom: A Chronological age of autistic participants in months at Time 3; B MSEL DQ of autistic participants at Time 1; C CBCL DSM-oriented anxiety T-scores of autistic participants at Time 1; D CSHQ total sleep disturbances scores of autistic participants at Time 1
Fig. 4
Fig. 4
Boxplots comparing P1 ERP latencies across autistic participants assigned to different classes, overlaid by individual participants’ latency values. A significant three-way ANOVA interaction of stimulus intensity (loudness), hemisphere, and mixture model class was observed. Uncorrected tests suggested P1 latencies might be shorter over the right hemisphere in class 1-LEW in the 80 dB condition as well as in class 2-GPL in the 70 dB condition, but these effects were modest and did not survive correction for multiple comparisons
Fig. 5
Fig. 5
Boxplots comparing P1 ERP amplitudes across autistic participants assigned to different classes, overlaid by individual participants’ amplitude values. Note that P1 amplitudes in the 80 dB condition remained significantly larger in 2-GPL than other classes after correction for multiple comparisons and after removal of the outlying participant in class 2-GPL (viz., the participant with amplitude > 6 μV)
Fig. 6
Fig. 6
Scalp plots depicting spherically-splined P1 auditory response voltages of autistic participants in each class during separate 51 ms time windows from the centre of the P1 measurement window in each condition, or 95–145 ms (50 dB), 84–134 ms (60 dB), 69–119 ms (70 dB), and 66–116 ms (80 dB). The conditions are arrayed in columns from left to right (i.e., 50 dB at left; 80 dB at right), while the classes are arrayed in rows: 1-LEW at top, 2-GPL in middle, and 3-NL at bottom. The scale in microvolts (μV) is given at the far right. Note the increased response amplitude at 80 dB for the 2-GPL class

References

    1. Achenbach TM, Rescorla LA. Manual for the ASEBA preschool forms and profiles. University of Vermont; 2000.
    1. Adams D, Clark M, Simpson K. The relationship between child anxiety and the quality of life of children, and parents of children, on the autism spectrum. Journal of Autism and Developmental Disorders. 2019 doi: 10.1007/s10803-019-03932-2. - DOI - PubMed
    1. Agelink van Rentergem JA, Deserno MK, Geurts HM. Validation strategies for subtypes in psychiatry: A systematic review of research on autism spectrum disorder. Clinical Psychology Review. 2021;87:102033. doi: 10.1016/j.cpr.2021.102033. - DOI - PubMed
    1. American Psychiatric Association. (2013). Neurodevelopmental disorders. In Diagnostic and statistical manual of mental disorders (5th ed.). 10.1176/appi.books.9780890425596.dsm01.
    1. Aoki S, Kagitani-Shimono K, Matsuzaki J, Hanaie R, Nakanishi M, Tominaga K, Taniike M, et al. Lesser suppression of response to bright visual stimuli and visual abnormality in children with autism spectrum disorder: A magnetoencephalographic study. Journal of Neurodevelopmental Disorders. 2019;11:9. doi: 10.1186/s11689-019-9266-0. - DOI - PMC - PubMed