

U-Shaped Effect of Blood Pressure on Structural OCT Metrics and Retinal Perfusion in Ophthalmologically Healthy Subjects
- PMID: 34499704
- PMCID: PMC8434757
- DOI: 10.1167/iovs.62.12.5
U-Shaped Effect of Blood Pressure on Structural OCT Metrics and Retinal Perfusion in Ophthalmologically Healthy Subjects
Abstract
Purpose: We wanted to investigate the association of blood pressure (BP) status with the ganglion cell-inner plexiform layer (GCIPL) and retinal nerve fiber layer (RNFL) thickness of nonglaucomatous eyes and to elucidate whether this effect is related to vascular metrics proxying retinal perfusion.
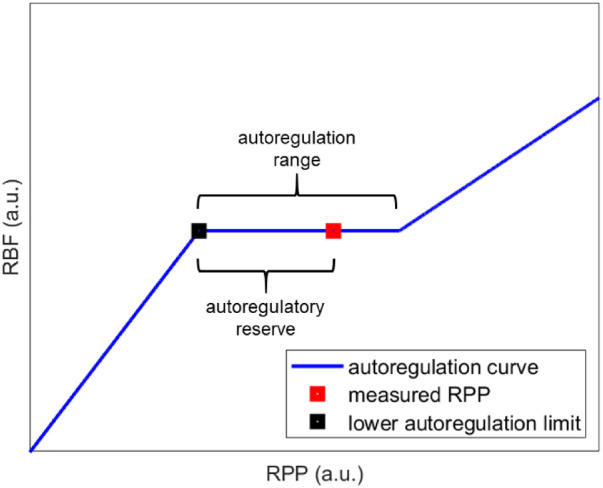
Methods: For this case-control study, we prospectively included 96 eyes of 96 healthy subjects (age 50-65) from a large-scale population-based cohort in the northern Netherlands (n = 167,000) and allocated them to four groups (low BP, normal BP [controls], treated arterial hypertension [AHT], untreated AHT). We measured macular GCIPL and RNFL (mRNFL) and peripapillary RNFL (pRNFL) thicknesses with optical coherence tomography (OCT). We estimated retinal blood flow (RBF), retinal vascular resistance (RVR), and autoregulatory reserve (AR) from quantitative OCT-angiography, fundus imaging, BP, and intraocular pressure. We compared structural and vascular metrics across groups and performed mediation analysis.
Results: Compared to controls, GCIPL was thinner in the low BP group (P = 0.013), treated hypertensives (P = 0.007), and untreated hypertensives (P = 0.007). Treated hypertensives exhibited the thinnest mRNFL (P = 0.001), temporal pRNFL (P = 0.045), and inferior pRNFL (P = 0.034). The association of GCIPL thickness with BP was mediated by RBF within the combined low BP group and controls (P = 0.003), by RVR and AR within the combined treated hypertensives and controls (P = 0.001, P = 0.032), and by RVR within the combined untreated antihypertensives and controls (P = 0.022).
Conclusions: Inner retinal thinning was associated with both tails of the BP distribution and with ineffective autoregulation. Longitudinal studies could clarify whether these defects can explain the reported glaucomatous predisposition of these population groups.
Conflict of interest statement
Disclosure:
Figures


References
-
- Schuman JS, Hee MR, Puliafito CA, et al. .. Quantification of nerve fiber layer thickness in normal and glaucomatous eyes using optical coherence tomography. Arch Ophthalmol. 1995; 113: 586–596. - PubMed
-
- Garway-Heath DF, Crabb DP, Bunce C, et al. .. Latanoprost for open-angle glaucoma (UKGTS): a randomised, multicentre, placebo-controlled trial. Lancet. 2015; 385(9975): 1295–1304. - PubMed
-
- Heijl A, Leske MC, Bengtsson B, et al. .. Reduction of intraocular pressure and glaucoma progression: results from the Early Manifest Glaucoma Trial. Arch Ophthalmol. 2002; 120: 1268–1279. - PubMed
-
- Flammer J, Orgül S, Costa VP, et al. .. The impact of ocular blood flow in glaucoma. Prog Retin Eye Res. 2002; 21: 359–393. - PubMed
Publication types
MeSH terms
LinkOut - more resources
Full Text Sources
Research Materials
