. 2021 Oct;35(10):e21867.
doi: 10.1096/fj.202101104R.

Low lysophosphatidylcholine induces skeletal muscle myopathy that is aggravated by high-fat diet feeding

Affiliations

Low lysophosphatidylcholine induces skeletal muscle myopathy that is aggravated by high-fat diet feeding

Patrick J Ferrara et al. FASEB J. 2021 Oct.

Abstract

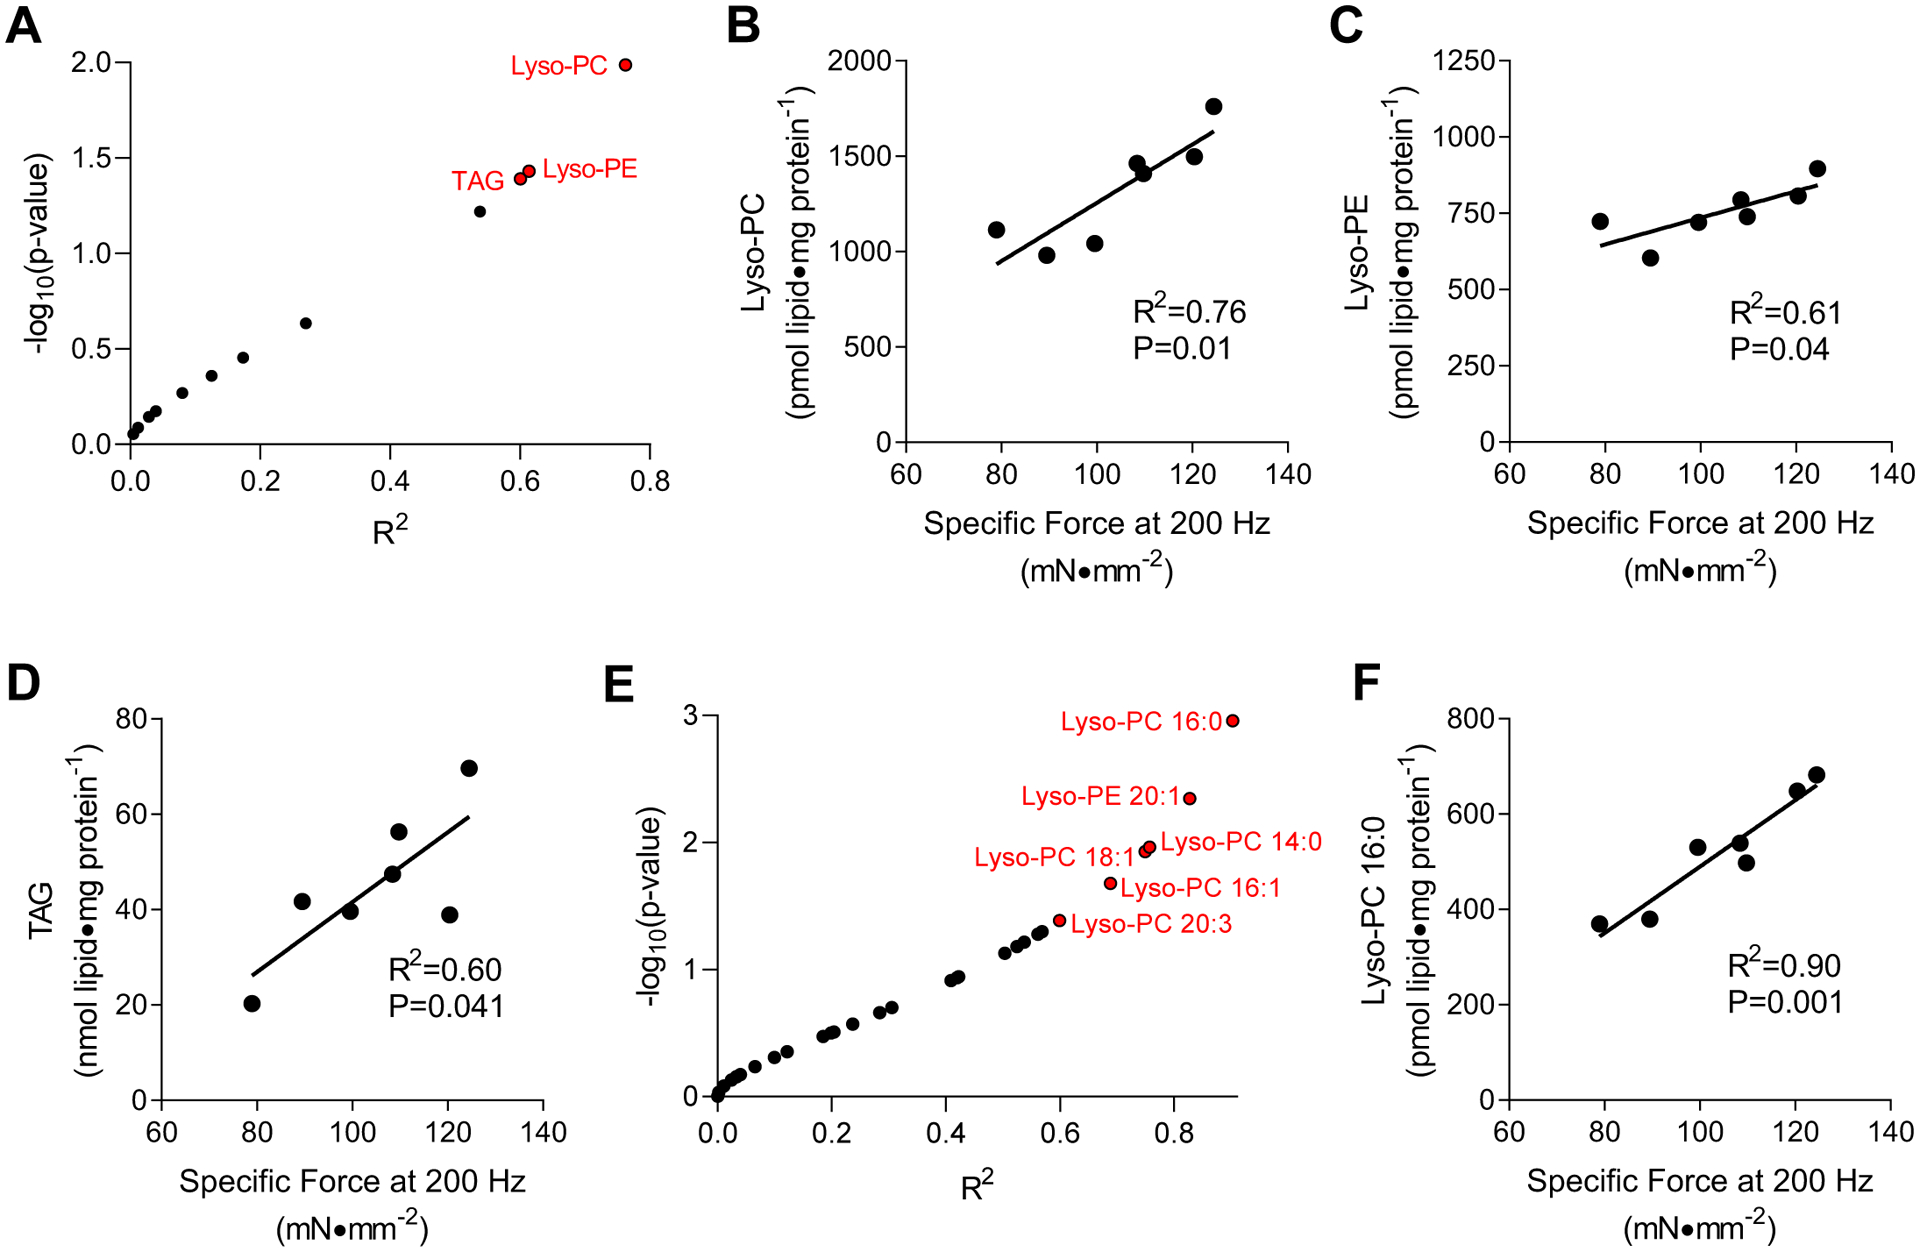
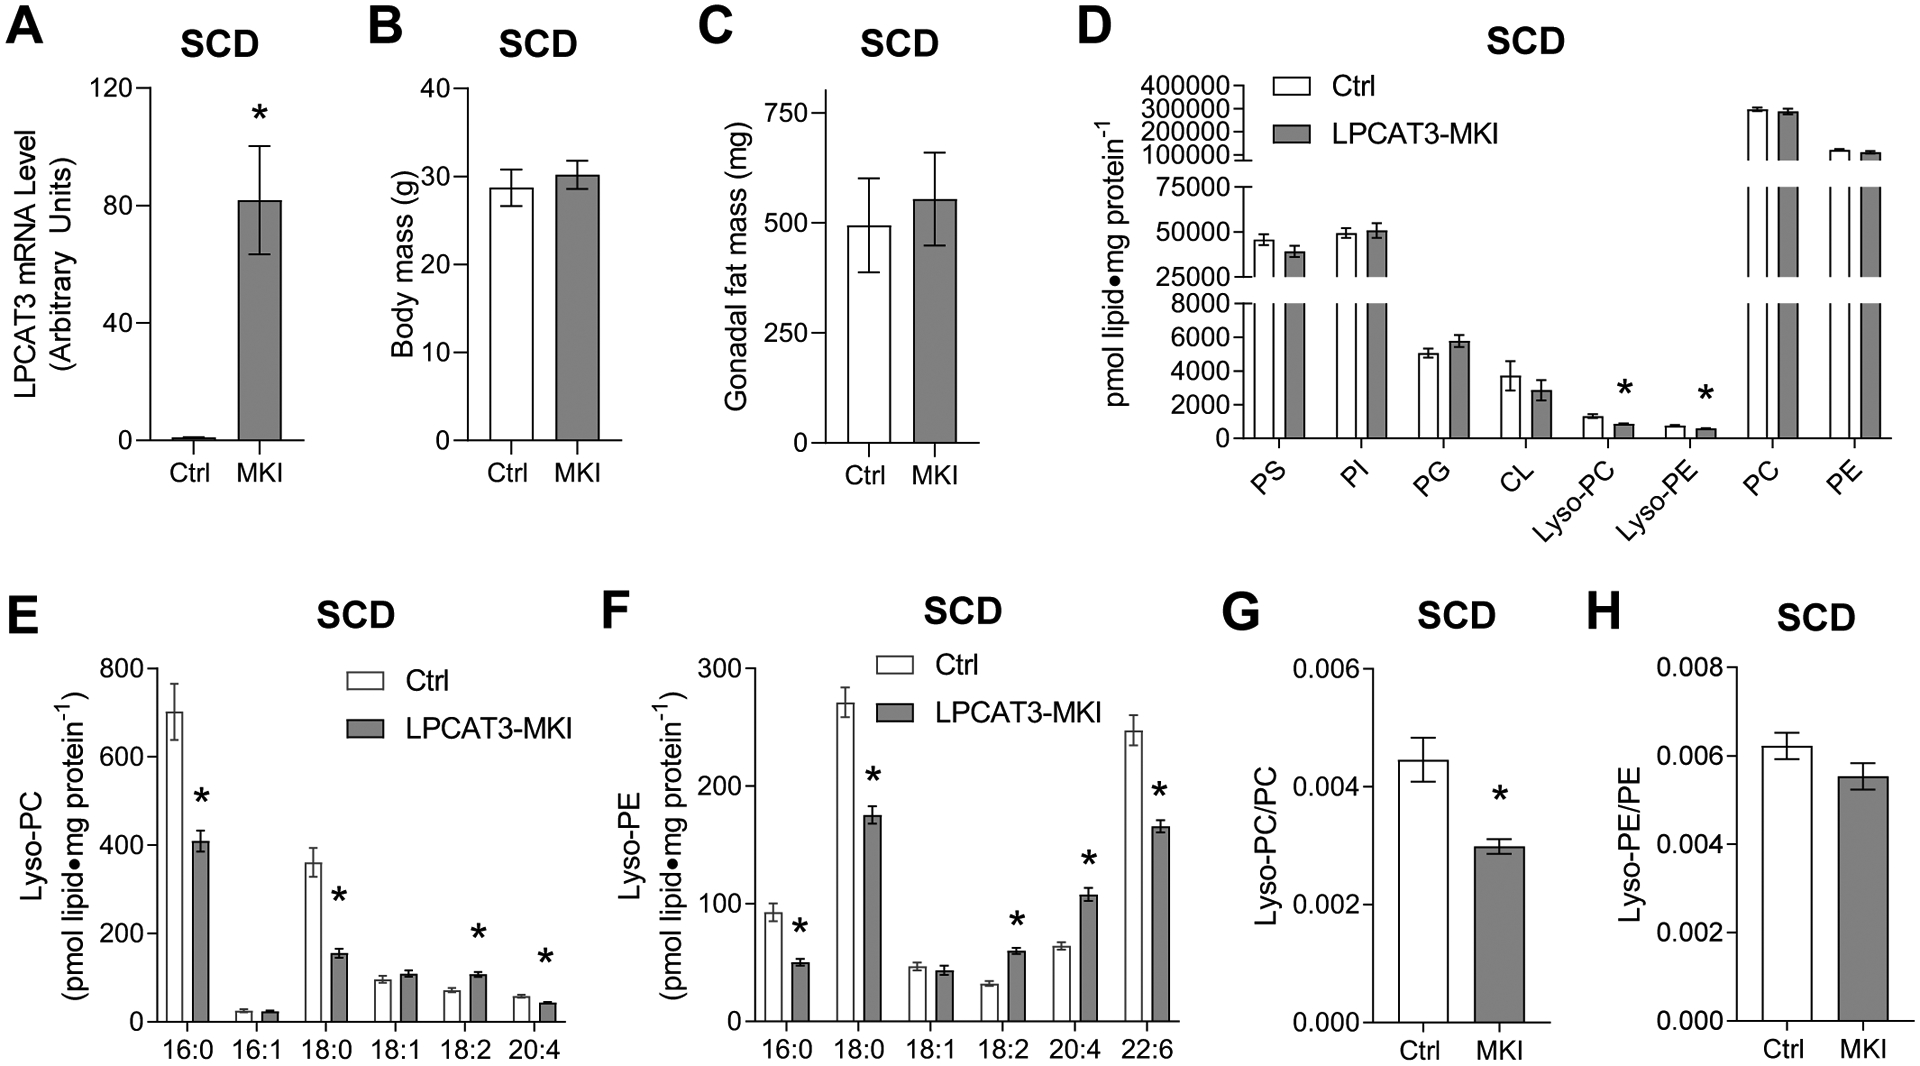
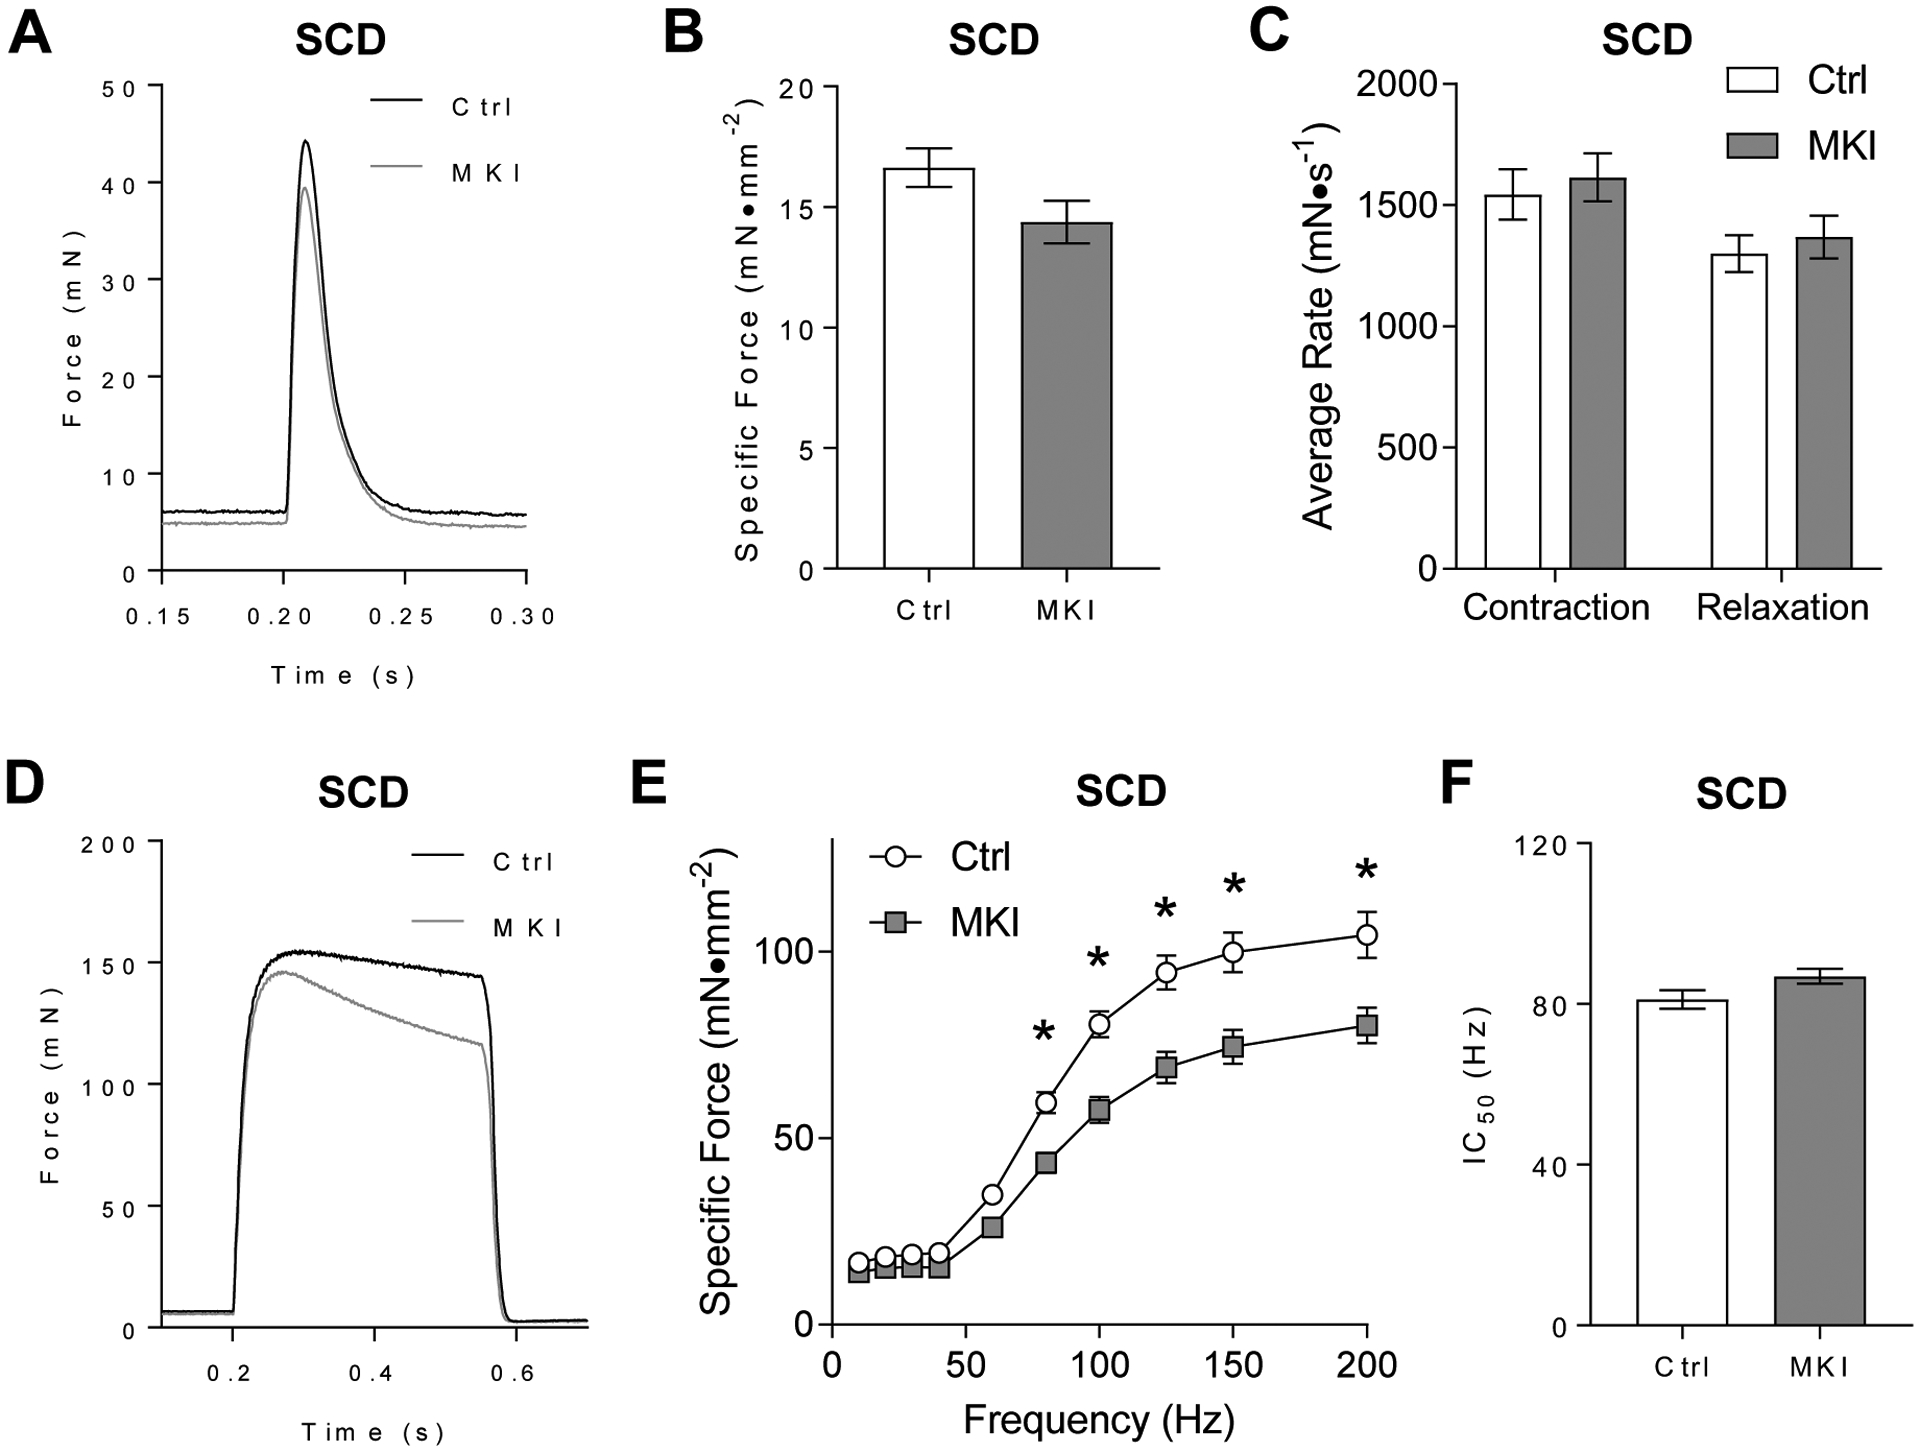
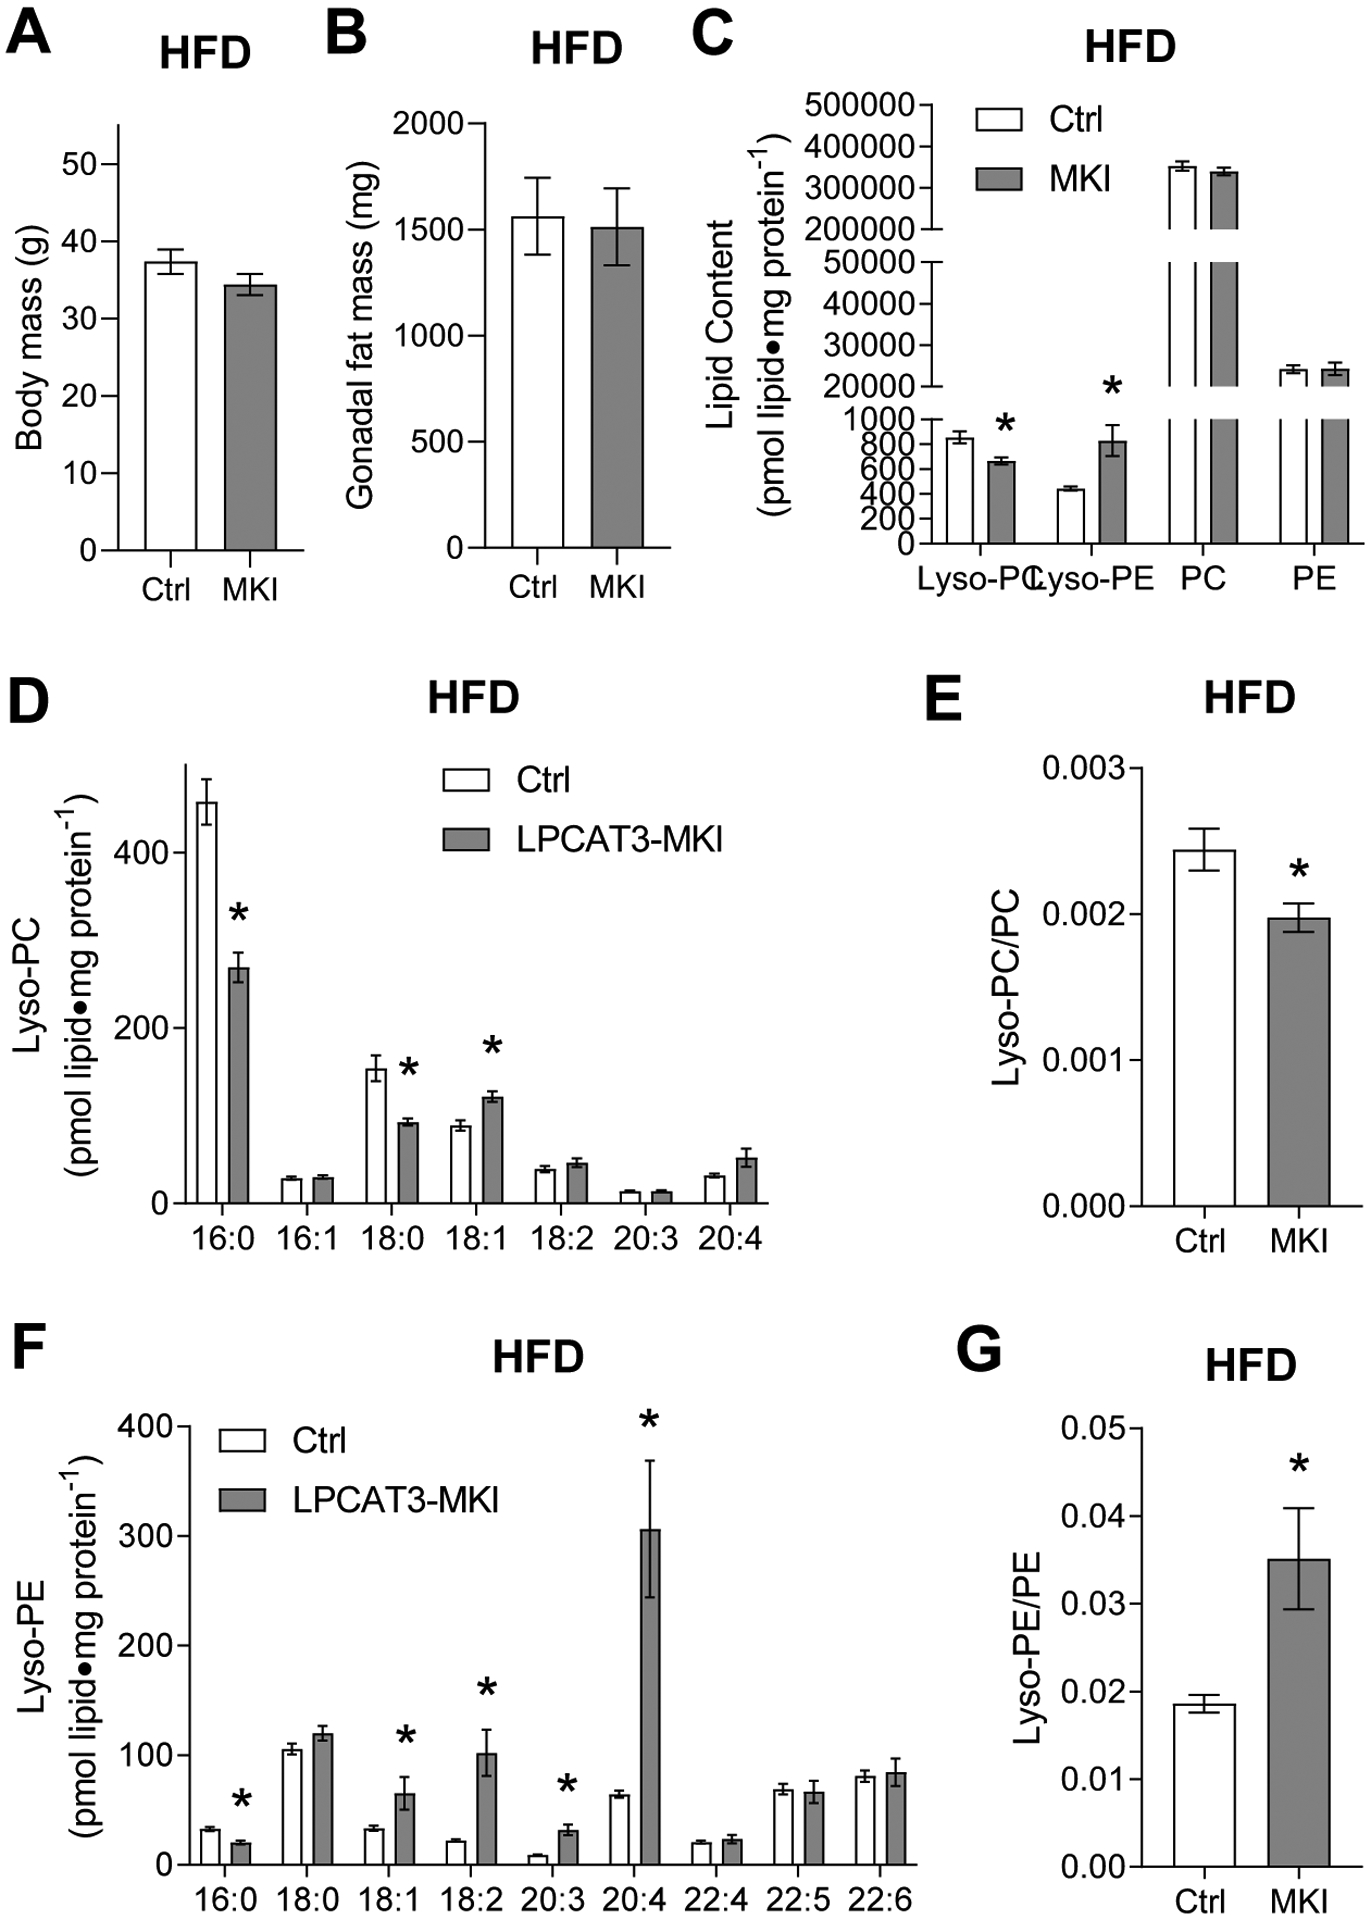
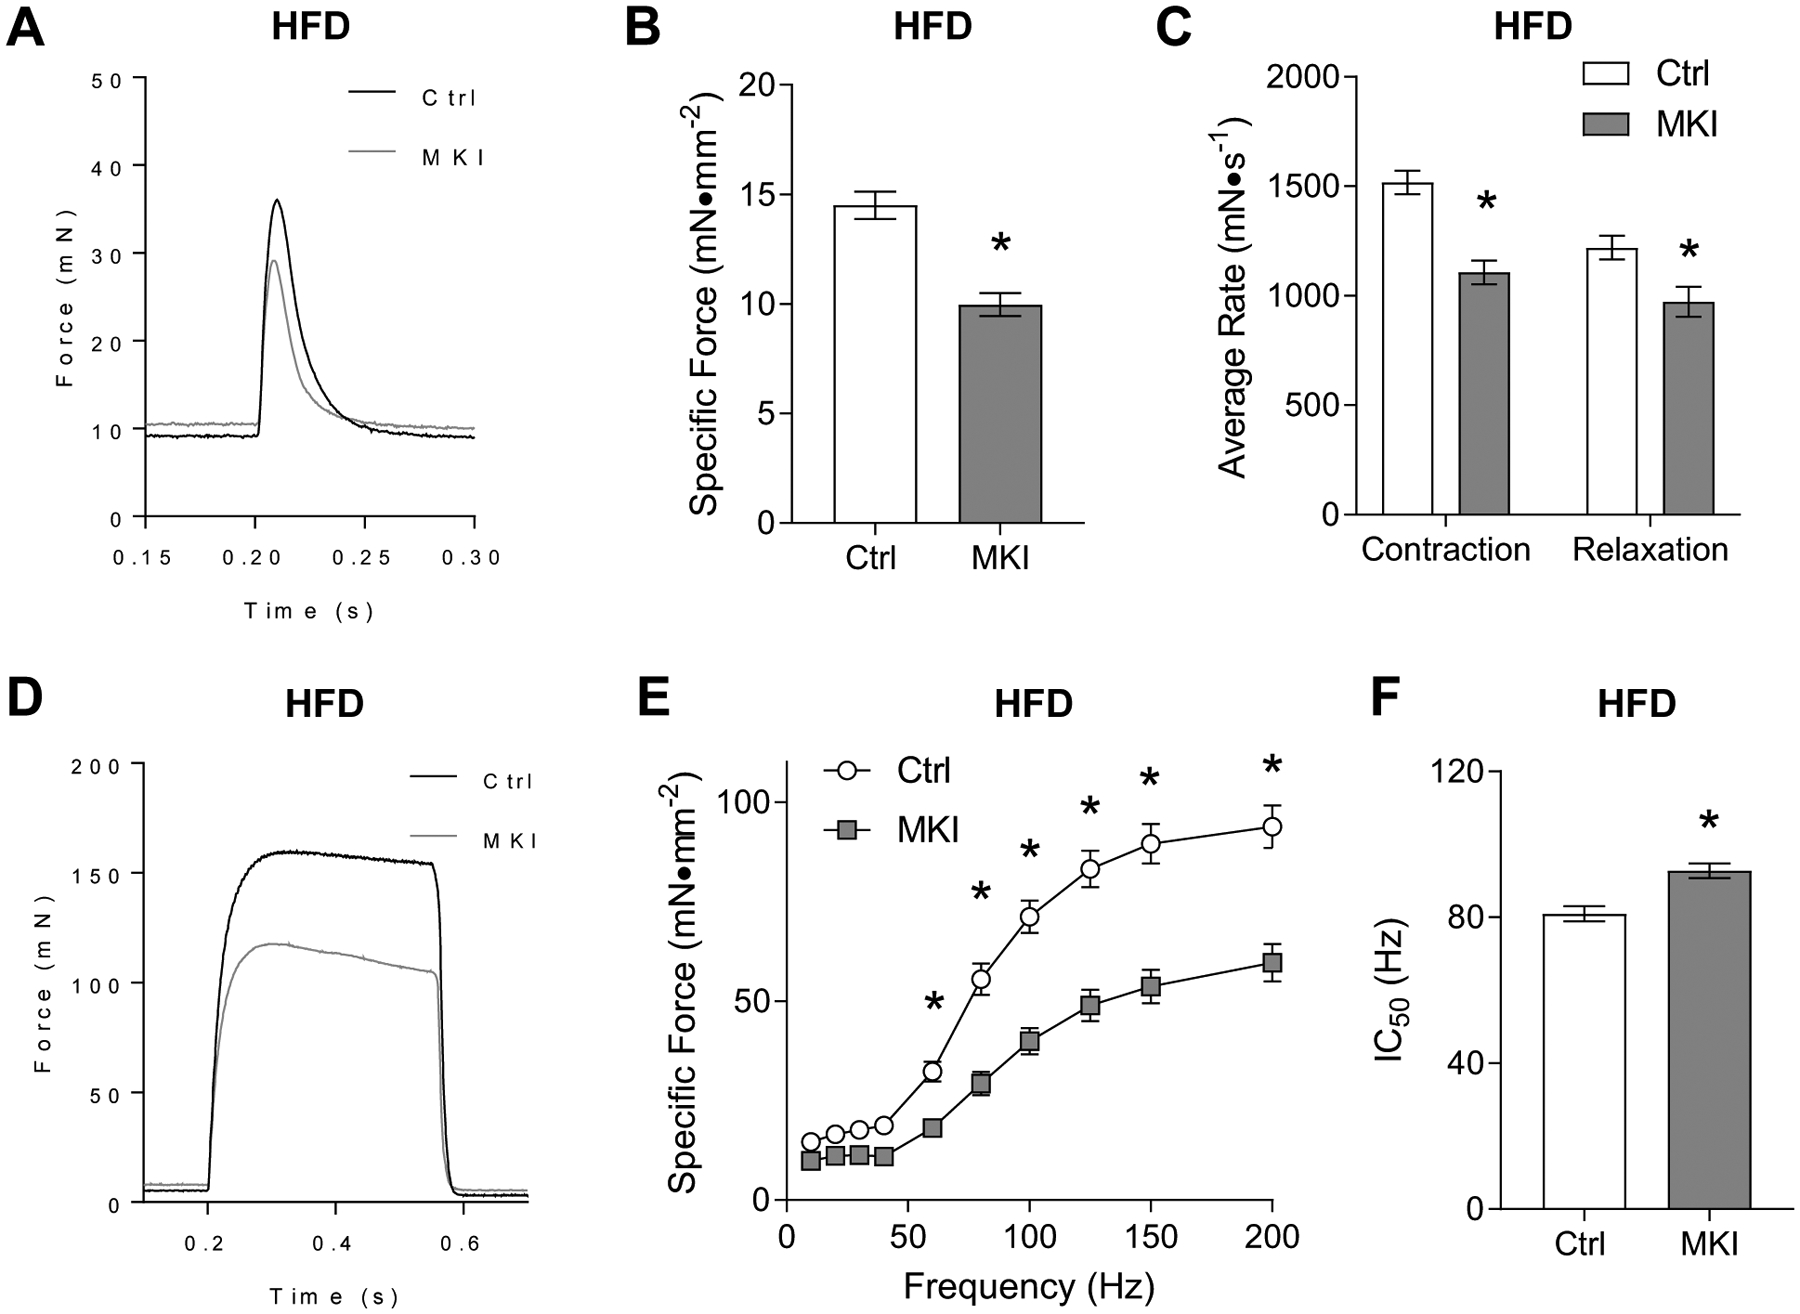
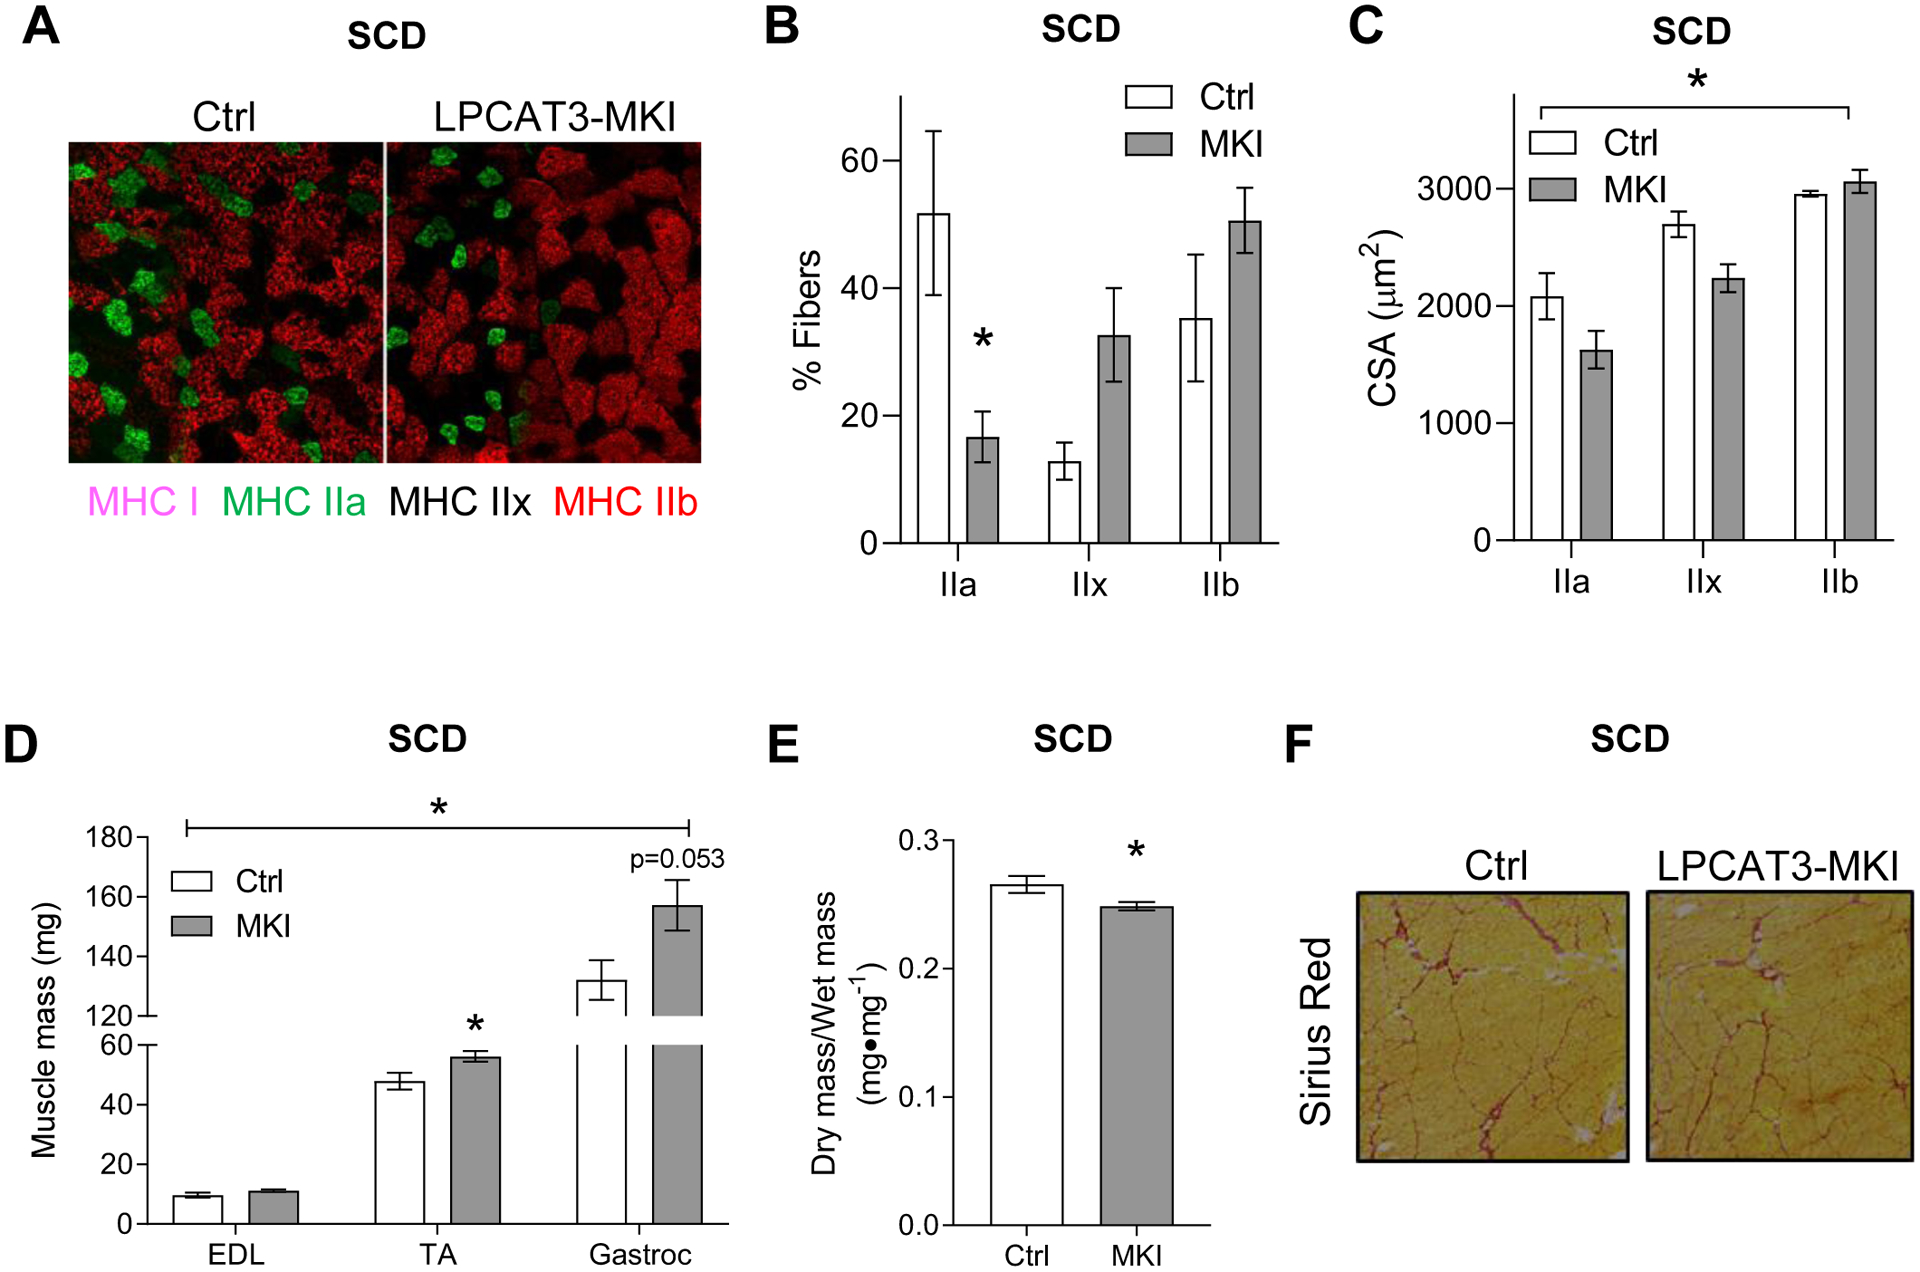
Obesity alters skeletal muscle lipidome and promotes myopathy, but it is unknown whether aberrant muscle lipidome contributes to the reduction in skeletal muscle contractile force-generating capacity. Comprehensive lipidomic analyses of mouse skeletal muscle revealed a very strong positive correlation between the abundance of lysophosphatidylcholine (lyso-PC), a class of lipids that is known to be downregulated with obesity, with maximal tetanic force production. The level of lyso-PC is regulated primarily by lyso-PC acyltransferase 3 (LPCAT3), which acylates lyso-PC to form phosphatidylcholine. Tamoxifen-inducible skeletal muscle-specific overexpression of LPCAT3 (LPCAT3-MKI) was sufficient to reduce muscle lyso-PC content in both standard chow diet- and high-fat diet (HFD)-fed conditions. Strikingly, the assessment of skeletal muscle force-generating capacity ex vivo revealed that muscles from LPCAT3-MKI mice were weaker regardless of diet. Defects in force production were more apparent in HFD-fed condition, where tetanic force production was 40% lower in muscles from LPCAT3-MKI compared to that of control mice. These observations were partly explained by reductions in the cross-sectional area in type IIa and IIx fibers, and signs of muscle edema in the absence of fibrosis. Future studies will pursue the mechanism by which LPCAT3 may alter protein turnover to promote myopathy.

Keywords: diabetes; lysophospholipid; myopathy; skeletal muscle.


Conflict of interest statement

Conflict of Interest: The authors have no conflict of interest to disclose.

Figures

Figure 1:
Figure 1:. Skeletal muscle lyso-PC correlates with force-generating capacity.
(A-D) Untargeted lipidomics correlated to maximal force production ex vivo. (A) A volcano plot of correlation analyses between muscle lipid classes and forces produced during maximal tetanic contraction. R2 is plotted against −log10p-values. Data points indicated in red are P<0.05. (B-D) Linear regressions for (B) lyso-PC, (C) lyso-PE), and (D) TAG with force production. (E&F) Targeted lipidomic analyses for lyso-PC and lyso-PE species. (E) A volcano plot of correlation analyses between muscle lipid species and forces produced during maximal tetanic contraction. R2 is plotted against −log10p-values. Data points indicated in red are P<0.05. (F) Linear regression for 16:0 lyso-PC content with force production. n=7.
Figure 2:
Figure 2:. Skeletal muscle-specific overexpression of LPCAT3 lowers lyso-PC and lyso-PE (standard chow diet).
(A) LPCAT3 mRNA level in muscles from control (Ctrl) and LPCAT3-MKI (MKI) mice (D-H) Skeletal muscle phospholipidome. (B) Body mass. (C) Gonadal fat mass. (D) total lipids by class, (E) lyso-PC species, (F) lyso-PE species, (G) lyso-PC/PC ratio, (H) lyso-PE/PE ratio. All data are from mice that were fed standard chow diet. Ctrl: n=7, LPCAT3-MKI: n=12. Two-tailed t-tests or 2-way ANOVA with Sidak’s multiple comparisons tests were performed. All data are mean ± SEM. *P ≤ 0.05.
Figure 3:
Figure 3:. LPCAT3-MKI mice exhibit mild contractile dysfunction when fed a standard chow diet.
Extensor digitorum longus (EDL) muscles of control (Ctrl) and LPCAT3-MKI (MKI) mice were dissected for the analysis of ex vivo force production after (A-C) a single-pulse stimulation to initiate a twitch contraction or (D-F) across a range of stimulation frequencies (10–200 Hz) to generate a force-frequency curve. (A) Force tracings of EDL muscles after a single pulse stimulation in Ctrl and LPCAT3-MKI mice. (B) Force normalized to muscle cross-sectional area (specific force). (C) The average rate of contraction and average rate of relaxation between Ctrl and LPCAT3-MKI EDL muscles. (D) Force tracings of EDL muscles after a 200 Hz stimulation between Ctrl and LPCAT3-MKI mice. (E) Specific force of EDL muscles across a range of stimulation frequencies in Ctrl and LPCAT3-MKI mice (main effect of genotype, P=0.0014). (F) The frequency needed to illicit 50% maximal contraction of EDL muscles from Ctrl and LPCAT3-MKI mice. All data are from mice that were fed standard chow diet. Ctrl: n=7, LPCAT3-MKI: n=12. Two-tailed t-tests or 2-way ANOVA with Sidak’s multiple comparisons tests were performed. All data are mean ± SEM. *P ≤ 0.05 for specific time-points.
Figure 4:
Figure 4:. Low lyso-PC, but not lyso-PE, in muscles of LPCAT3-MKI compared to control mice (high-fat diet).
(A) Body mass. (B) Gonadal fat mass. (C) Total lipids by class, (D) lyso-PC species, (E) lyso-PC/PC ratio, (F) lyso-PE species, and (G) lyso-PE/PE ratio. All data are from mice that were fed high-fat diet. Ctrl: control, MKI: LPCAT3-MKI. n=11/group. Two-tailed t-tests or 2-way ANOVA with Sidak’s multiple comparisons tests were performed. All data are mean ± SEM. *P ≤ 0.05.
Figure 5:
Figure 5:. LPCAT3-MKI mice exhibit a more dramatic contractile defect after high-fat diet feeding.
EDL muscles of control (Ctrl) and LPCAT3-MKI (MKI) mice were dissected for the analysis of ex vivo force production after (A-C) a single-pulse stimulation to initiate a twitch contraction or (D-F) across a range of stimulation frequencies (10–200 Hz) to generate a force-frequency curve. (A) Force tracings of EDL muscles after a single pulse stimulation in Ctrl and LPCAT3 MKI mice. (B) Force normalized to muscle cross-sectional area (specific force). (C) The average rate of contraction and average rate of relaxation between Ctrl and LPCAT3-MKI EDL muscles. (D) Force tracings of EDL muscles after a 200 Hz stimulation between Ctrl and LPCAT3-MKI mice. (E) Specific force of EDL muscles across a range of stimulation frequencies in Ctrl and LPCAT3-MKI mice (main effect of genotype, P=0.0003). (F) The frequency needed to illicit 50% maximal contraction of EDL muscles from Ctrl and LPCAT3-MKI mice. All data are from mice that were fed high-fat diet. Ctrl: n=5, LPCAT3-MKI: n=9. Two-tailed t-tests or 2-way ANOVA with Sidak’s multiple comparisons tests were performed. All data are mean ± SEM. *P ≤ 0.05.
Figure 6:
Figure 6:. Skeletal muscle fiber-type and cross-sectional area in control and LPCAT3-MKI mice.
(A) Representative images of myosin-heavy chain immunofluorescence of TA muscle (MHC I: pink, MHC IIa: green, MHC IIb: red, and MHC IIx: negative). (B) Relative abundance of fibers expressing MHC IIa, IIx, and IIb. (C) Mean CSA stratified according to their MHC expression. n=3/group. (D) Mass of extensor digitorum longus (EDL), tibialis anterior (TA), and gastrocnemius (Gastroc) muscles (Ctrl n=4, LPCAT3-MKI n=4) (E) The ratio of dry/wet weight in gastrocnemius muscles of Ctrl and LPCAT3-MKI mice (Ctrl n=6, LPCAT3-MKI n=9). (F) Representative images of Picrosirius red staining of TA muscle. All data are from mice that were fed standard chow diet. Two-tailed t-tests or 2-way ANOVA with Sidak’s multiple comparisons tests were performed. All data are mean ± SEM. *P ≤ 0.05.

References

    1. Martignoni ME, Kunze P, and Friess H (2003) Cancer cachexia. Mol Cancer 2, 36. - PMC - PubMed
    1. Aversa Z, Zhang X, Fielding RA, Lanza I, and LeBrasseur NK (2019) The clinical impact and biological mechanisms of skeletal muscle aging. Bone 127, 26–36 - PMC - PubMed
    1. Powers SK, Kavazis AN, and DeRuisseau KC (2005) Mechanisms of disuse muscle atrophy: role of oxidative stress. Am J Physiol Regul Integr Comp Physiol 288, R337–344 - PubMed
    1. Vincent AE, Ng YS, White K, Davey T, Mannella C, Falkous G, Feeney C, Schaefer AM, McFarland R, Gorman GS, Taylor RW, Turnbull DM, and Picard M (2016) The Spectrum of Mitochondrial Ultrastructural Defects in Mitochondrial Myopathy. Sci Rep 6, 30610. - PMC - PubMed
    1. Eshima H, Siripoksup P, Mahmassani ZS, Johnson JM, Ferrara PJ, Verkerke ARP, Salcedo A, Drummond MJ, and Funai K (2020) Neutralizing mitochondrial ROS does not rescue muscle atrophy induced by hindlimb unloading in female mice. J Appl Physiol (1985) 129, 124–132 - PMC - PubMed

Publication types

Substances