. 2021 Oct 25;31(20):4596-4607.e5.
doi: 10.1016/j.cub.2021.08.041. Epub 2021 Sep 8.

Fast tuning of posture control by visual feedback underlies gaze stabilization in walking Drosophila

Affiliations

Fast tuning of posture control by visual feedback underlies gaze stabilization in walking Drosophila

Tomás L Cruz et al. Curr Biol. .

Abstract

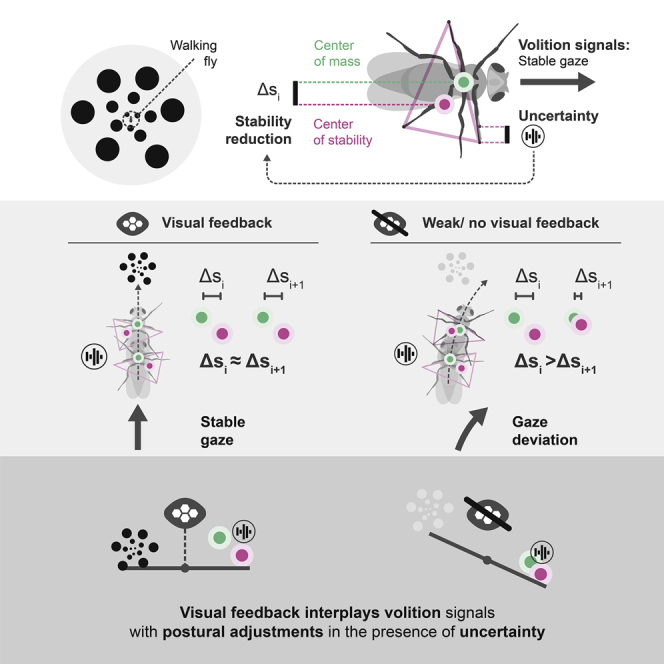
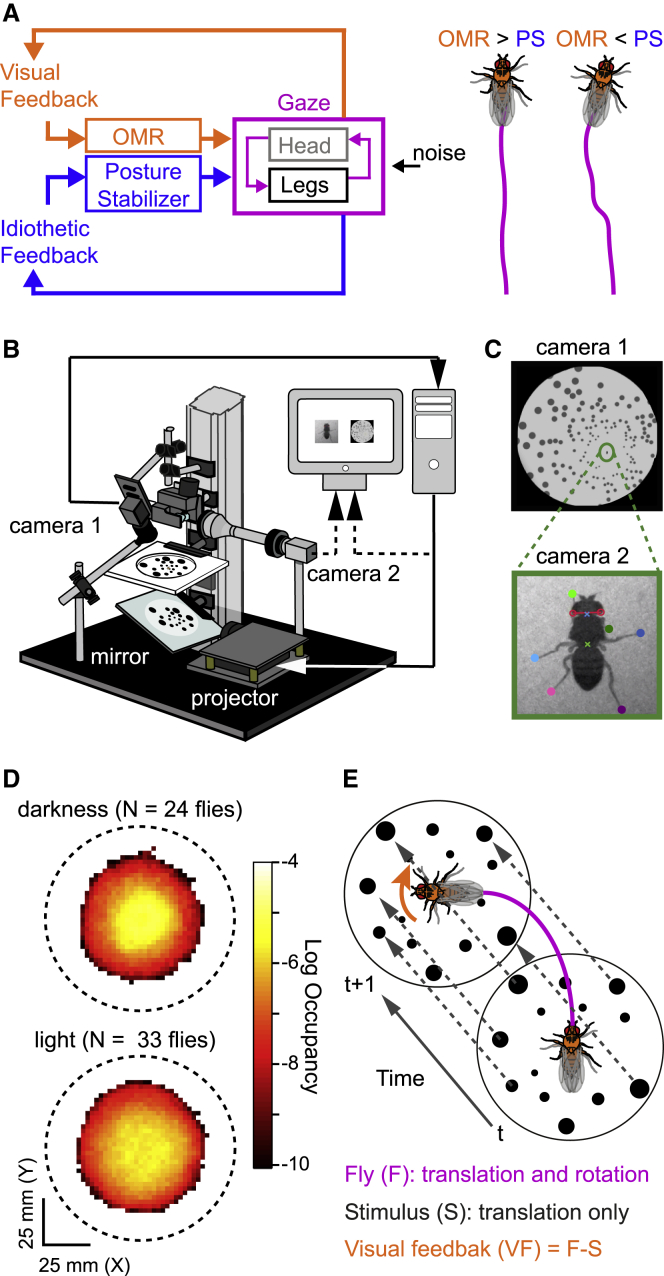
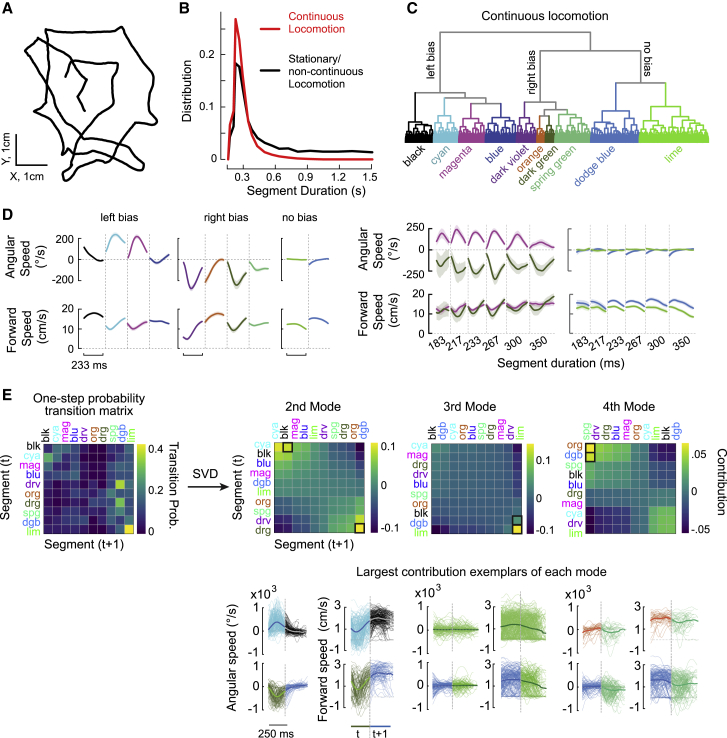
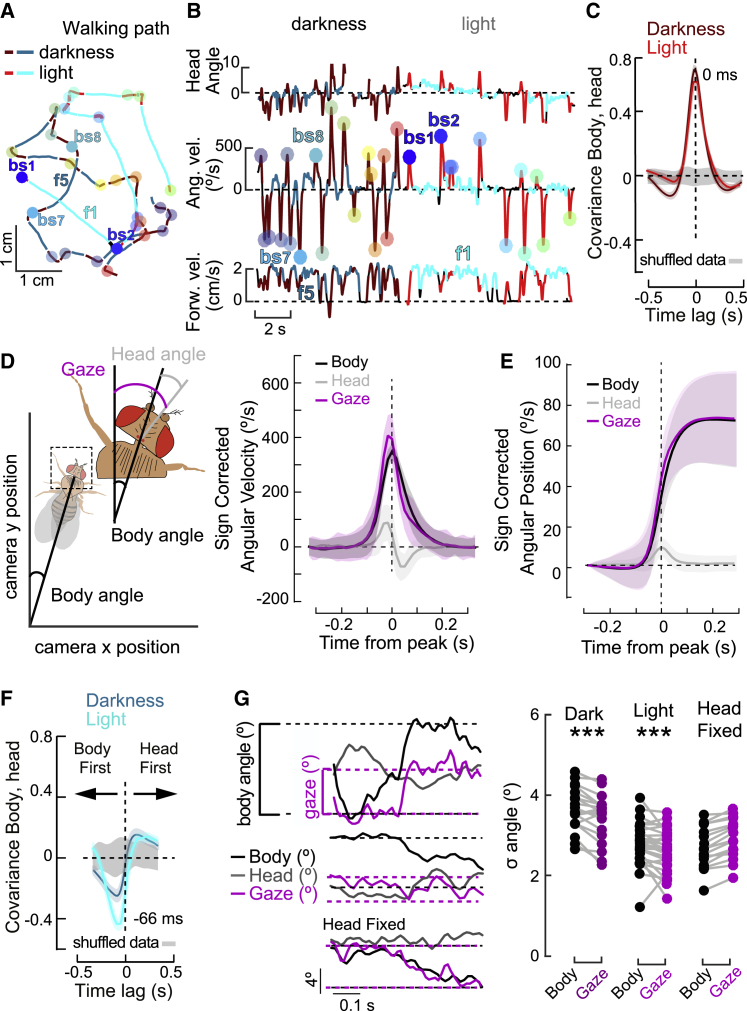
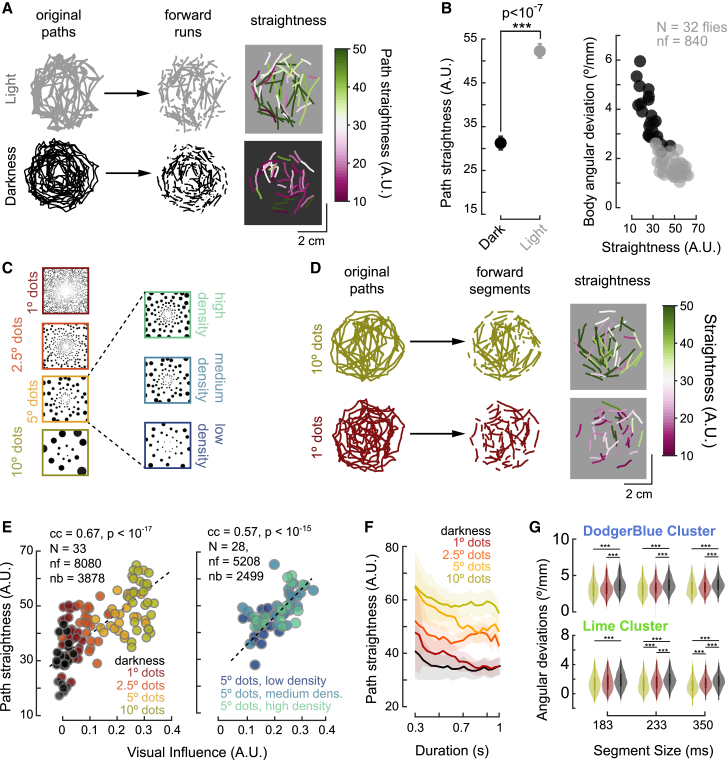
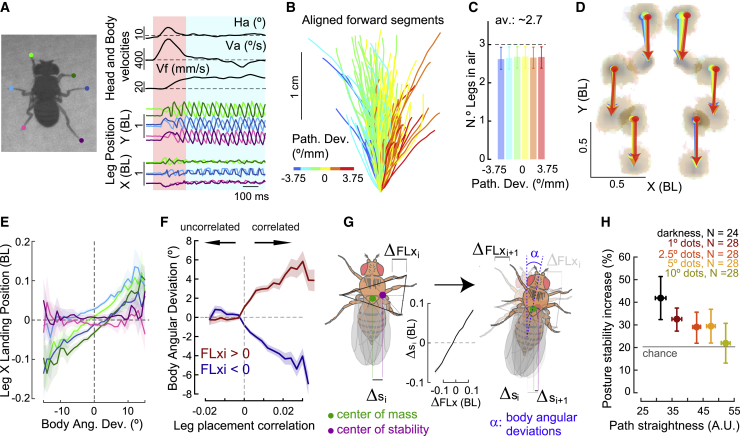
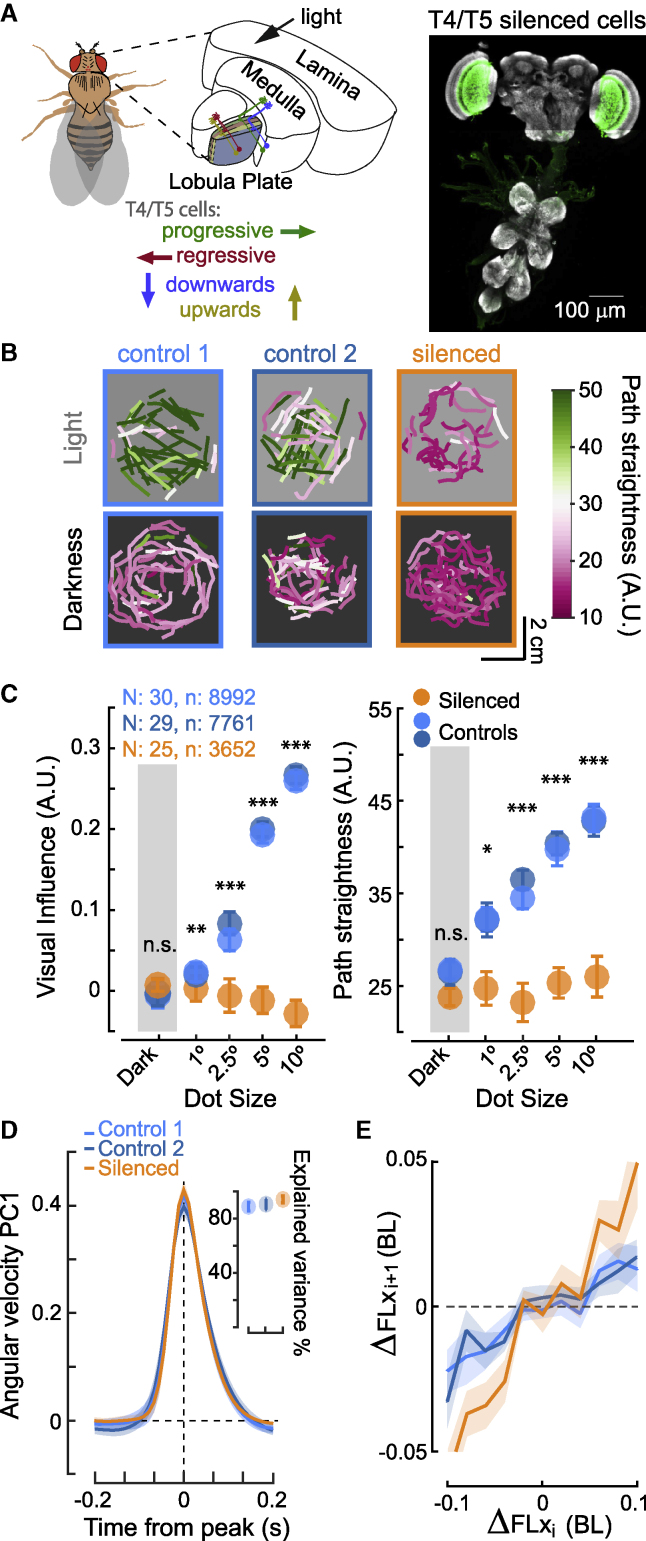
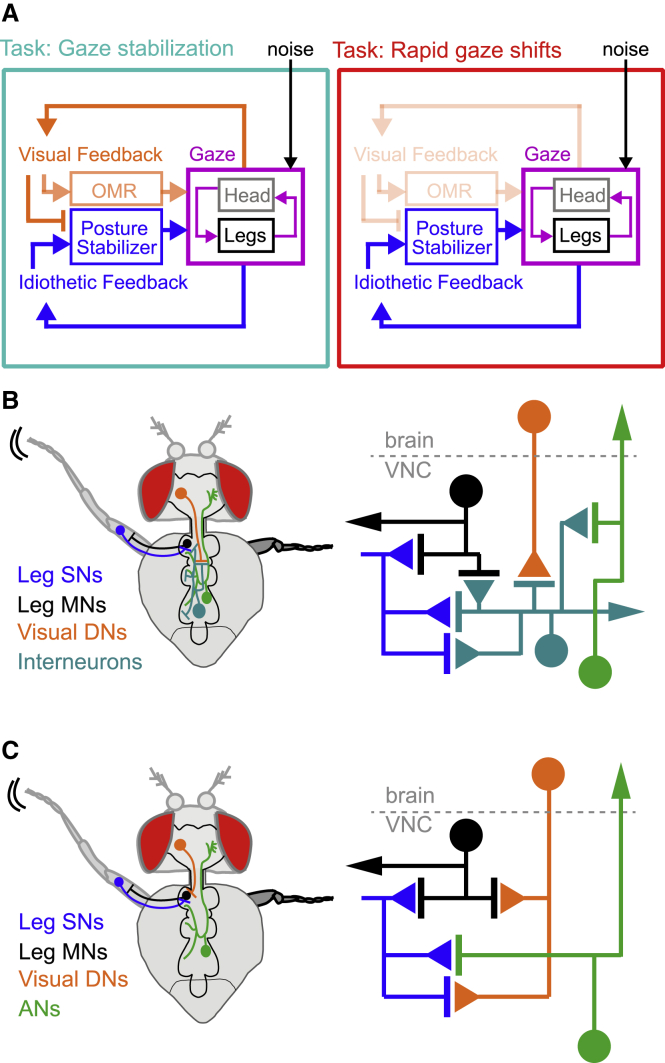
Locomotion requires a balance between mechanical stability and movement flexibility to achieve behavioral goals despite noisy neuromuscular systems, but rarely is it considered how this balance is orchestrated. We combined virtual reality tools with quantitative analysis of behavior to examine how Drosophila uses self-generated visual information (reafferent visual feedback) to control gaze during exploratory walking. We found that flies execute distinct motor programs coordinated across the body to maximize gaze stability. However, the presence of inherent variability in leg placement relative to the body jeopardizes fine control of gaze due to posture-stabilizing adjustments that lead to unintended changes in course direction. Surprisingly, whereas visual feedback is dispensable for head-body coordination, we found that self-generated visual signals tune postural reflexes to rapidly prevent turns rather than to promote compensatory rotations, a long-standing idea for visually guided course control. Together, these findings support a model in which visual feedback orchestrates the interplay between posture and gaze stability in a manner that is both goal dependent and motor-context specific.

Keywords: Drosophila; gaze stabilization; interlimb coordination; locomotion; motor control; posture control; virtual reality; visually guided walking; visuomotor processing.


Conflict of interest statement

Declaration of interests M.E.C. is an advisory board member at Current Biology.

Figures

None
Graphical abstract
Figure 1
Figure 1
An experimental paradigm to study the role of visual feedback in exploratory walking (A) Left: two control systems affecting gaze during walking. Right: possible walking trajectories when each system controls behavior. OMR: optomotor response system; PS: posture stabilizer system. (B) Virtual reality setup for freely walking flies (STAR Methods). (C) Top: low-magnification view of a walking fly. Bottom: the corresponding high-magnification view with head (red segment), body (green cross), and leg (colored dots) tracked. (D) Occupancy probability in darkness (top) and in light (bottom). (E) Virtually constrained visual feedback. See also Video S1.
Figure 2
Figure 2
Distinct regular dynamics and specific transitions define the structure of exploration (A) Example walking path. (B) Distribution of segment durations. Red: continuous locomotion; black: stationary segments and onset/offset of walking (N = 84 flies; n = 64,467 segments). (C) Hierarchical organization of continuous walking (Figure S2). (D) Left: representative velocity profiles per cluster for 233 ms segments. Right: example clusters with (magenta and dark green) or without (lime and dodger blue) angular bias, across segment durations (average ±SD) (E) Left: one-step probability transition matrix between clusters. Right, top: second-to-fourth transition modes (Figure S2D; STAR Methods). Right, bottom: velocity profiles of the largest contributors to each transition mode. See also Video S1.
Figure 3
Figure 3
The structure of exploration reveals head-body motor programs that maximize gaze stability independent of vision (A) Walking paths under light and dark conditions. f, forward runs; bs, body saccades, also indicated by colored dots. (B) Corresponding time series of the head angle and the angular and forward velocities. Left: darkness. Right: light. Body saccades are indicated in red. Forward runs are indicated in cyan (Figure S3; STAR Methods). (C) Cross-covariance between the head angle and body angular velocity during saccades in light (N = 33; n = 1,022) and dark (N = 24; n = 4,252) conditions (grand mean ± SEM). Gray: same with shuffled body angular velocity. (D) Left: definition of head, gaze, and body angles. Right: angular velocity of the body (black), head (gray), and gaze (purple) during saccades of 300 to 400°/s (average ± SD), N = 57; n = 1,232) (Figure S4). (E) Same as in (D) for angular position. (F) Same as (C) during forward runs in light (N = 33; n = 840) and dark (N = 24; n = 2,663) conditions. (G) Left, top: the body, head, and gaze angles during example forward run segments. Bottom: same for a fly with a head fixed to the body. Right: comparison between the body versus gaze angle standard deviation in light (N = 33), dark (N = 24), and head fixed under light (N = 16) conditions (∗∗∗p < 0.005, Wilcoxon signed-rank test). See also Video S2.
Figure 4
Figure 4
Visual feedback rapidly controls path straightness during forward runs (A) Original walking paths (left), isolated forward runs (middle), and path straightness of forward runs (right) under light (top) or dark (bottom) conditions (STAR Methods). (B) Left: mean path straightness under light (gray) or dark (black) conditions (grand mean± SEM, Wilcoxon rank-sum test). Right: average body angular deviations versus average path straightness. (C) Different visual environments. (D) Similar to (A), under two different visual environments (1° and 10° dots). (E) Path straightness as a function of visual influence, varying dot size (left, t test) or density (right, t test) (STAR Methods; Figure S1). (F) Mean path straightness versus forward run duration under different visual environments (averaged±SD). (G) Body angular deviations versus segment duration under different visual environments for clusters with high forward velocity (∗∗∗p < 0.001; ∗∗p < 0.01; p < 0.05, Wilcoxon rank-sumtest two-sided with Bonferroni correction). Across-condition sample sizes: lime, 311–997 segments; dodge blue, 208–642 segments.
Figure 5
Figure 5
Visual feedback prevents pairwise interlimb correlations underlying postural adjustments (A) Left: tracking labels of leg position. Right: time series of head angle, body velocities, and leg positions parallel (Y) or orthogonal (X) to body direction. Red shade: body saccade; cyan shade: forward run. BL, body length. (B) Forward runs aligned at the starting position, colored by path deviations. (C) Number of legs in the air during forward runs versus path deviation (average ±SD, N = 52 flies; n = 15,754 forward runs). (D) Distributions of leg landing and lift-off positions with respect to the body, color coded by path deviation. Arrows: movement from the center of the landing to the center of the lift-off distributions. (E) Leg X landing position in a single step (grand mean ±SEM, N = 52 flies; n = 42,524 high-quality steps; STAR Methods) versus the body angular deviation in that step (Figure S5). Color code is the same as in (A). (F) Body angular deviations versus front-leg-correlated lateral movement classified by the direction of the initial leg displacement (left: blue; right: red; grand mean ± SEM, N = 52 flies; n = 42,524 high-quality steps). (G) Schematic of the relationship between posture stability change (Δsi and Δsi+1), front-leg lateral displacement (ΔFLxi), correlated front-leg lateral movement in consecutive steps (ΔFLxi+1), and body angular deviations (α). (H) Posture stability increase (%Δs) following an initial leg displacement versus average path straightness under different visual environments (grand mean±SEM, colored). Chance was calculated by shuffling the step sequence. See also Video S3.
Figure 6
Figure 6
Motion-sensitive circuits are crucial for visual tuning of postural reflexes (A) Left: schematic of the fly optic system highlighting direction-selective and motion-sensitive T4/T5 cells. Right: selective expression of Kir2.1:GFP in T4/T5 cells (green). (B) Walking path straightness of controls (light/dark blue) and experimental exemplar flies (orange) in light (top) and dark (bottom) conditions. Visual environment: 10° dots. (C) Visual influence (left) and path straightness (right) across visual environments. Color code same as in (B). Grand mean ±SEM, Wilcoxon rank-sum test: p < 0.05; ∗∗p < 0.01; ∗∗∗p < 0.005. (D) Dynamics of the first principal component of body saccades in control (blue) and experimental flies (orange). Grand mean ±SEM. (E) Front-leg lateral displacement (ΔFLXi+1) versus the contralateral leg displacement in the preceding step (ΔFLXi) in controls (blue) and experimental flies (orange). Grand mean ±SEM. See also Figures S6, S7, and Video S4.
Figure 7
Figure 7
Goal-directed rapid tuning of postural reflexes by visual feedback (A) Left: in the context of gaze stabilization, visual feedback tunes down postural reflexes, thereby preventing body rotations. Right: in the context of saccades, we found no effect of visual feedback (Figures 6D and S4A). (B and C) Schematic of potential circuit architectures by which visual feedback tunes postural reflexes within ventral nerve cord circuits. (B) Visual descending neurons (VDNs) may project to interneurons within VNC to tune sensitivity to postural reflexes. (C) VDNs directly connect to either motor neurons (MNs) or leg proprioceptive sensory neurons (SNs) to control leg placement.

Comment in

References

    1. Matthis J.S., Yates J.L., Hayhoe M.M. Gaze and the Control of Foot Placement When Walking in Natural Terrain. Curr. Biol. 2018;28:1224–1233.e5. - PMC - PubMed
    1. Dickinson M.H., Farley C.T., Full R.J., Koehl M.A., Kram R., Lehman S. How animals move: an integrative view. Science. 2000;288:100–106. - PubMed
    1. Bernstein N. Pergamon; 1967. The Coordination and Regulation of Movements.
    1. Haith A.M., Krakauer J.W. In: Gollhofer A., Taube W., Nielsen J.B., editors. Routledge; 2012. Theoretical models of motor control and motor learning; pp. 7–28. (Routledge Handbook of Motor Control and Motor Learning).
    1. Scott S.H. Optimal feedback control and the neural basis of volitional motor control. Nat. Rev. Neurosci. 2004;5:532–546. - PubMed

Publication types

LinkOut - more resources