. 2021 Sep 30;184(20):5179-5188.e8.
doi: 10.1016/j.cell.2021.08.014. Epub 2021 Aug 17.

Generation and transmission of interlineage recombinants in the SARS-CoV-2 pandemic

Affiliations

Generation and transmission of interlineage recombinants in the SARS-CoV-2 pandemic

Ben Jackson et al. Cell. .

Abstract

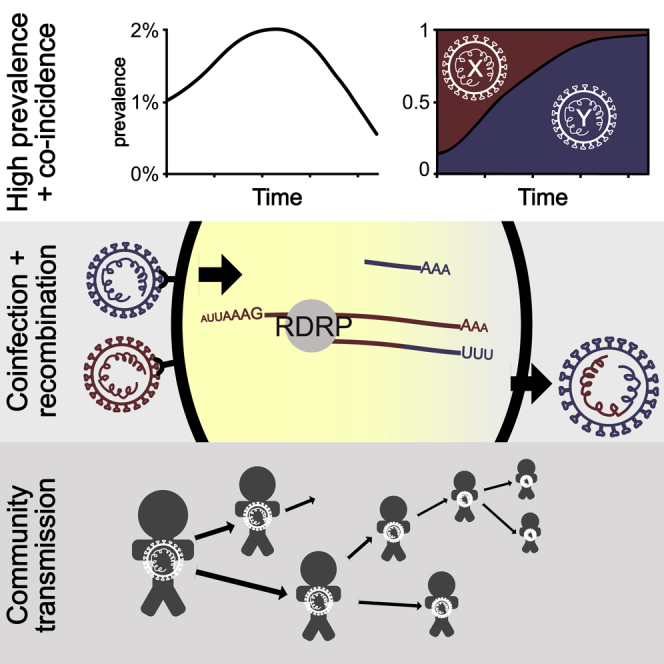
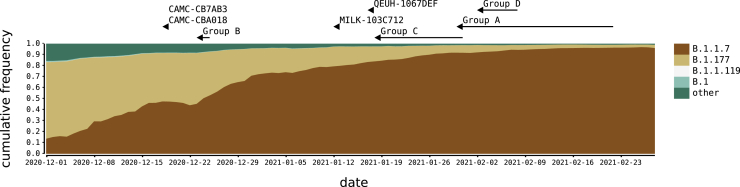
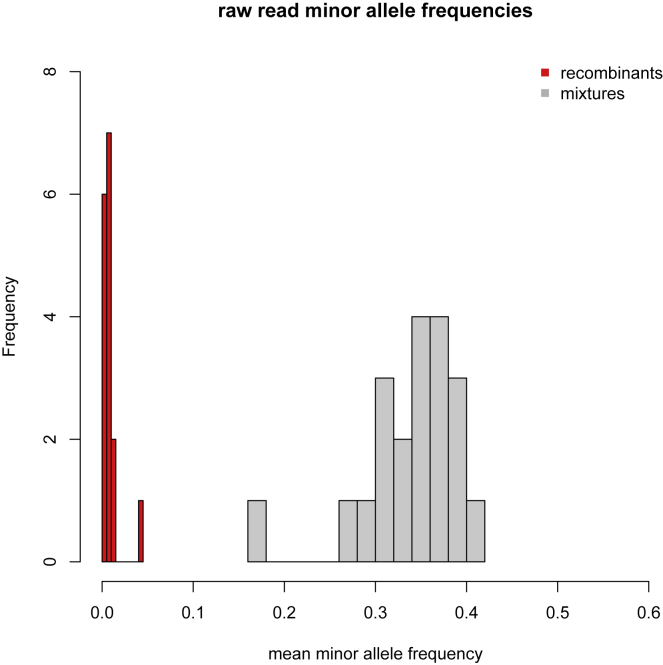
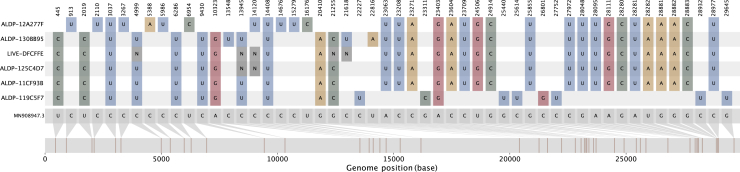
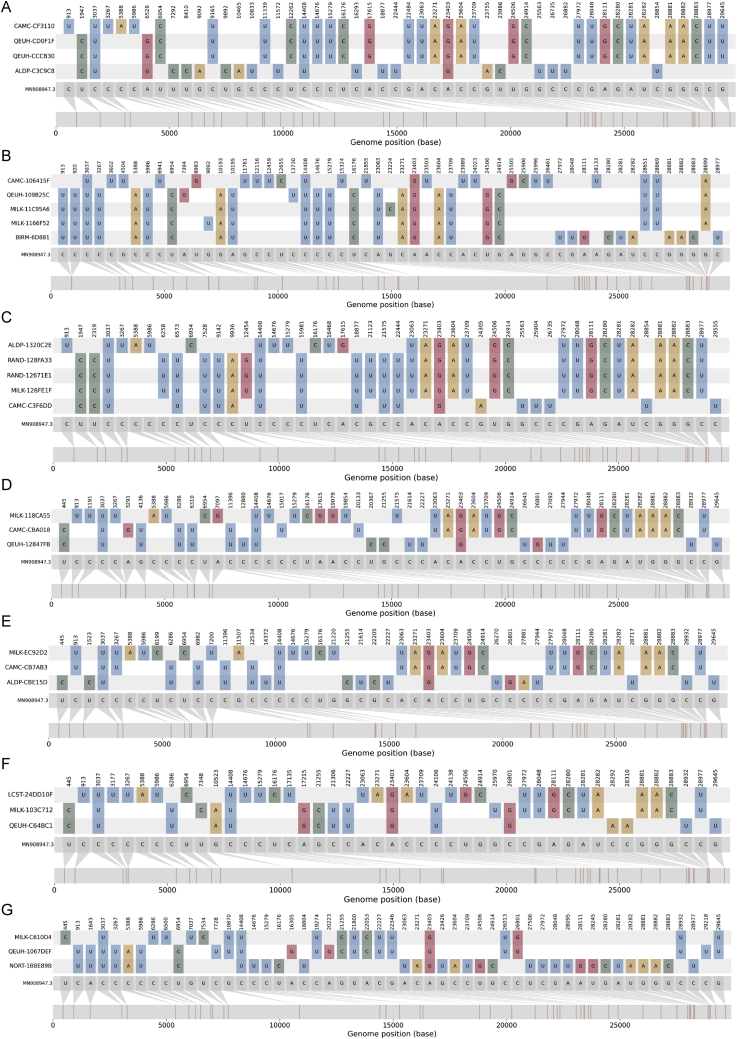
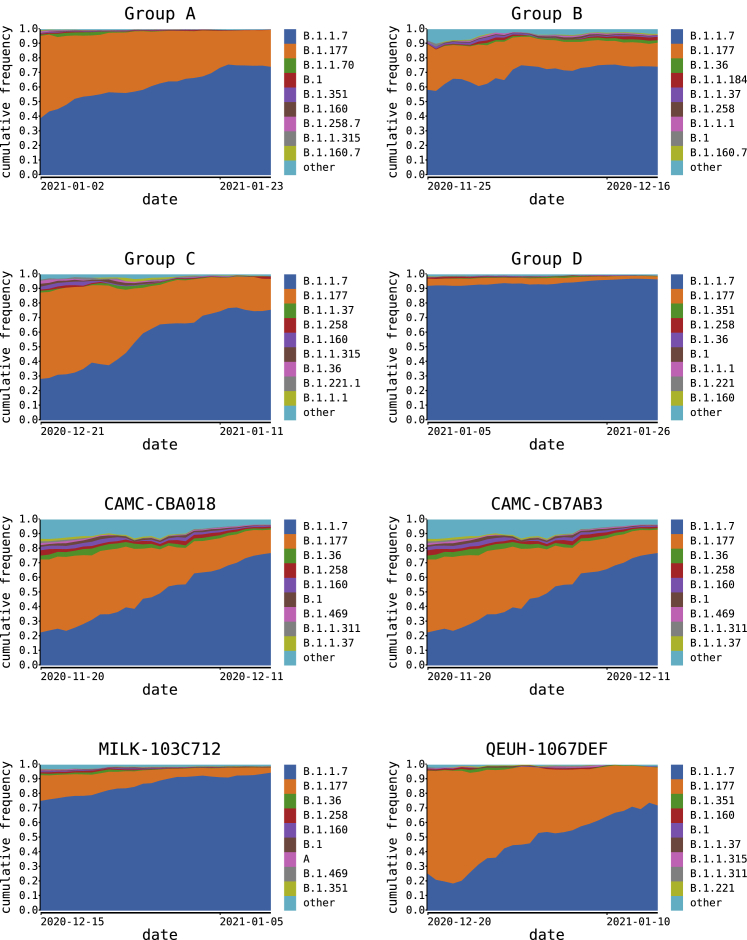
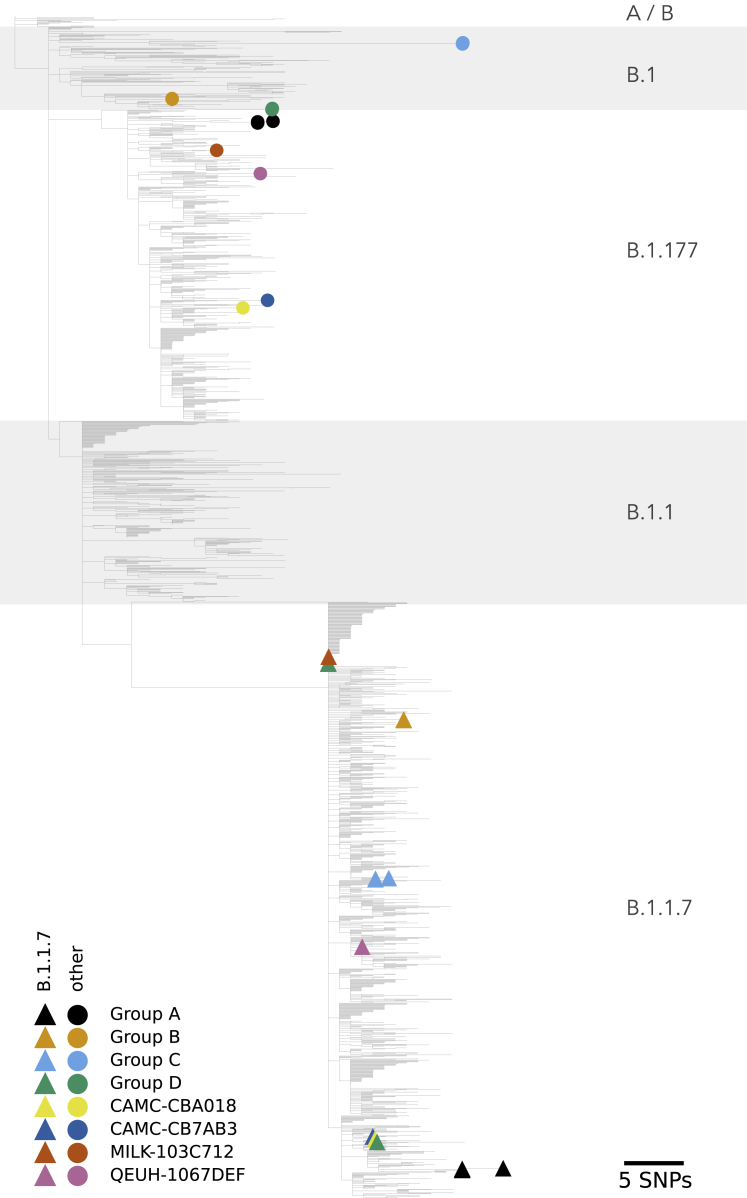
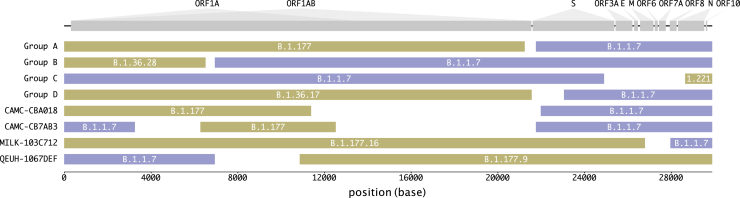
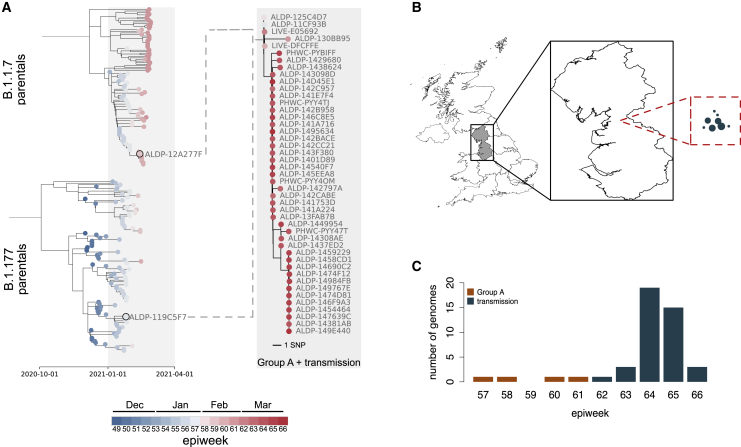
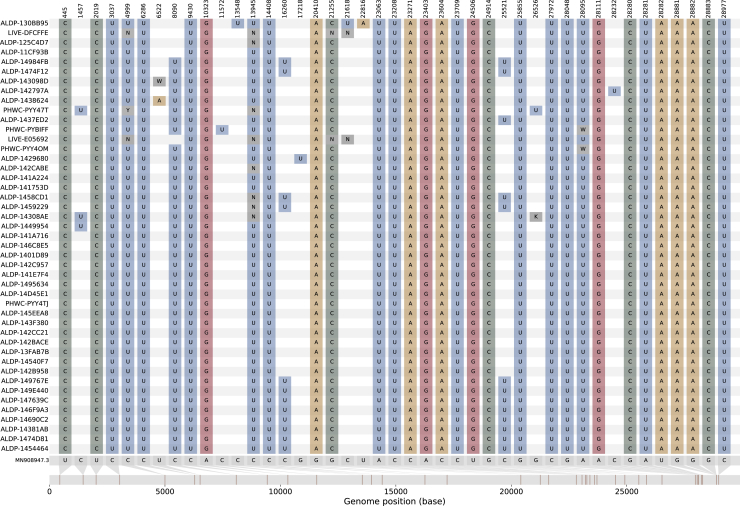
We present evidence for multiple independent origins of recombinant SARS-CoV-2 viruses sampled from late 2020 and early 2021 in the United Kingdom. Their genomes carry single-nucleotide polymorphisms and deletions that are characteristic of the B.1.1.7 variant of concern but lack the full complement of lineage-defining mutations. Instead, the remainder of their genomes share contiguous genetic variation with non-B.1.1.7 viruses circulating in the same geographic area at the same time as the recombinants. In four instances, there was evidence for onward transmission of a recombinant-origin virus, including one transmission cluster of 45 sequenced cases over the course of 2 months. The inferred genomic locations of recombination breakpoints suggest that every community-transmitted recombinant virus inherited its spike region from a B.1.1.7 parental virus, consistent with a transmission advantage for B.1.1.7's set of mutations.

Keywords: B.1.1.7; SARS-CoV-2; evolution; genomic epidemiology; genomics; recombination; variants.


Conflict of interest statement

Declaration of interests The authors declare no competing interests.

Figures

None
Graphical abstract
Figure 1
Figure 1
SARS-CoV-2 lineages in the UK, winter 2020–2021 The distribution of the most frequent SARS-CoV-2 lineages in the UK from December 2020 to February 2021. Here, B.1.177 refers to B.1.177, including all of its descendant lineages (e.g., B.1.177.9). For each recombinant or recombinant group, the date of the earliest sampled genome is indicated by an arrowhead. The recombination event that generated each must have occurred before this date. For groups A–D, the body of the arrow represents the range of dates that the samples span.
Figure S1
Figure S1
Read data minor allele frequencies, related to STAR Methods The distribution of minor allele frequencies from the read data for the 16 putative recombinants (red bars) and 20 samples suspected of being sequenced mixtures, either due to co-infection or laboratory contamination (gray bars). For each recombinant, the minor allele frequency is the mean across all sites that differ by a nucleotide change from the reference (MN908947.3) in it or either of its putative parentals by genetic similarity. For the mixtures, the minor allele frequency is the mean across the sites that differ by a nucleotide change from the reference at genomic positions where mutations occur in B.1.1.7.
Figure 2
Figure 2
The nucleotide variation present in group A The nucleotide variation with respect to the reference sequence (MN908947.3; gray genome, far bottom) for the four members of group A (ALDP-11CF93B, ALDP-125C4D7, LIVE-DFCFFE, and ALDP-130BB95; middle four colored genomes) and their closest neighbors by genetic similarity among all UK sequences from the same time period for the B.1.1.7-like region of their genomes (ALPD-12A277F; top colored genome) and the B.1.177-like region of their genomes (ALDP-119C5F7; bottom colored genome). See also Figure S2.
Figure S2
Figure S2
The nucleotide variation present in the recombinants and their parentals, related to Figure 2 The nucleotide variation with respect to the reference sequence (MN908947.3; gray genome far bottom) for each of the recombinant genomes (middle colored genomes in each panel) and their closest neighbors by genetic similarity among all UK sequences from the same time period, for the B.1.1.7-like and non-B.1.1.7-like regions of their genomes (top and bottom colored genomes in each panel). (A) Group B. (B) Group C. (C) Group D. (D) CAMC-CBA018. (E) CAMC-CB7AB3. (F) MILK-103C712. (G) QEUH-1067DEF.
Figure S3
Figure S3
SARS-CoV-2 lineages in geographic regions of the UK relevant to the recombinants, related to Figure 1 The distribution of the most frequent SARS-CoV-2 lineages in the NUTS1 location of each set (Groups A-D and the four singletons) of recombinants for the four weeks immediately preceding each set’s (earliest) sample date. Here, B.1.177 refers to B.1.177 itself and all its descendant lineages (e.g., B.1.177.9); the same is true for B.1.36.
Figure 3
Figure 3
Phylogenetic placement of putative recombinant genome regions Phylogenetic reconstruction of 2,000 samples chosen to be representative of the course of the epidemic in the UK, as well as the 16 recombinant genomes, with their B.1.1.7-like part (colored triangles) and non-B.1.1.7-like part (colored circles) alternately unmasked. The tree is scaled by genetic divergence, and the scale in numbers of nucleotide changes is given in the bottom right of the Figure.
Figure 4
Figure 4
Mosaicism of putative recombinants Recombinant groups A–D contain multiple sequences exhibiting the same mosaic genome structures (see Table 1 for details). Tracts matching lineage B.1.1.7 are shown in blue, while virus genome regions matching other lineages are shown in yellow. Gaps represent ambiguity in the exact position of the recombinant breakpoints; there are no lineage-defining mutations within these regions. The breakpoint coordinates are taken from Table 1.
Figure 5
Figure 5
The community transmission of group A (A) The phylogenetic relationships between the closest genetic neighbors of group A for the B.1.1.7-inherited region of their genome (top clade; left-hand tree) and the B.1.177-inherited region of their genome (bottom clade; left-hand tree), with branch lengths scaled by time. The sample date in cumulative epidemiological weeks (epiweeks) since the first epiweek of 2020 for each sequence is also represented by colored circles at the tips of each tree; see the key for this scale. The closest two parental sequences by genetic similarity for the two regions of the genomes (ALDP-12A277F and ALDP-119C5F7) are labeled in the left-hand tree, and their tips are highlighted by black rings. The phylogenetic relationships within group A (top four taxa) and their descendants (bottom 41 taxa) are shown in the right-hand tree, with branch lengths scaled by divergence. The dashed lines represent the formation of a new recombinant clade between the members of group A and their parental lineages. (B) The geographic context of the transmitted recombinant sequences. The exploded region of the map is the North-West region of England. All of the 41 recombinants descended from group A were sampled in this region. The relative distribution of their locations, in the same scale as the exploded region, are represented by the circles in the red dashed square. The size of the points represents the number of genomes sequenced in each location. The absolute locations of the recombinants within North West England are not represented by this panel. (C) The distribution of the sampling dates for the 45 recombinants, aggregated by epiweek. Orange bars, four original members of group A; green bars, 41 descendants from group A.
Figure S4
Figure S4
The nucleotide variation present in the descendants of group A, related to Figure 5 The distribution of nucleotide variation in the original members of group A (top four colored rows) and the 41 additional sequences that are derived from it (bottom 41 colored rows), with respect to the reference sequence (MN908947.3; very bottom gray sequence).

References

    1. Banner L.R., Lai M.M. Random nature of coronavirus RNA recombination in the absence of selection pressure. Virology. 1991;185:441–445. - PMC - PubMed
    1. Boni M.F., Posada D., Feldman M.W. An exact nonparametric method for inferring mosaic structure in sequence triplets. Genetics. 2007;176:1035–1047. - PMC - PubMed
    1. Boni M.F., de Jong M.D., van Doorn H.R., Holmes E.C. Guidelines for identifying homologous recombination events in influenza A virus. PLoS ONE. 2010;5:e10434. - PMC - PubMed
    1. Boni M.F., Lemey P., Jiang X., Lam T.T.-Y., Perry B.W., Castoe T.A., Rambaut A., Robertson D.L. Evolutionary origins of the SARS-CoV-2 sarbecovirus lineage responsible for the COVID-19 pandemic. Nat. Microbiol. 2020;5:1408–1417. - PubMed
    1. COG-UK (COVID-19 Genomics UK) An integrated national scale SARS-CoV-2 genomic surveillance network. Lancet Microbe. 2020;1:e99–e100. - PMC - PubMed

Publication types