. 2021 Aug 25;26(17):5136.
doi: 10.3390/molecules26175136.

Concurrent Reactive Oxygen Species Generation and Aneuploidy Induction Contribute to Thymoquinone Anticancer Activity

Affiliations

Concurrent Reactive Oxygen Species Generation and Aneuploidy Induction Contribute to Thymoquinone Anticancer Activity

Mohammed Al-Hayali et al. Molecules. .

Abstract

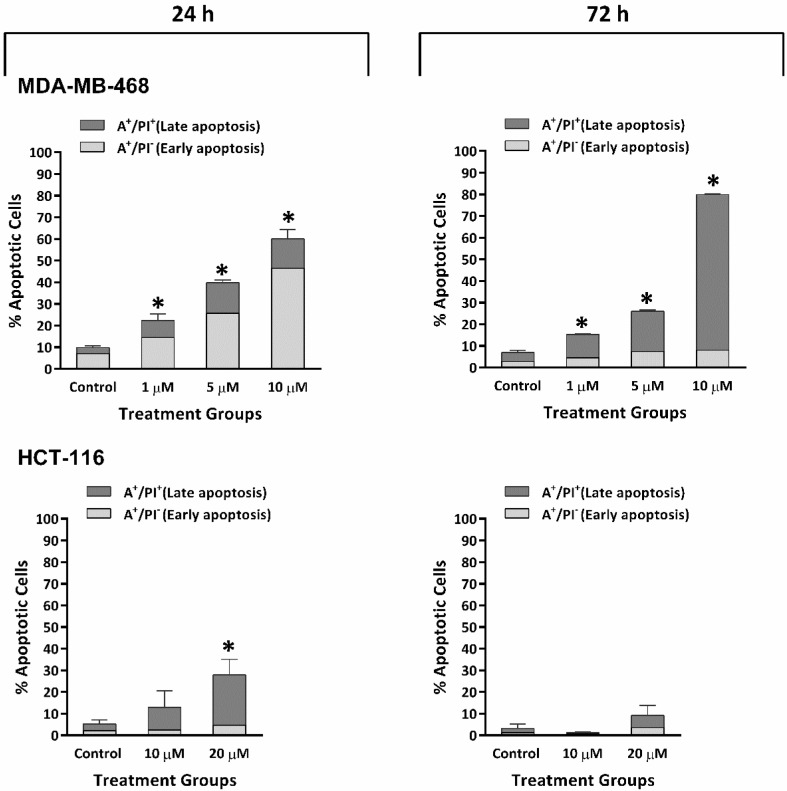
Thymoquinone (TQ) is the main biologically active constituent of Nigella sativa. Many studies have confirmed its anticancer actions. Herein, we investigated the different anticancer activities of, and considered resistance mechanisms to, TQ. MTT and clonogenic data showed TQ's ability to suppress breast MDA-MB-468 and T-47D proliferation at lower concentrations compared to other cancer and non-transformed cell lines tested (GI50 values ≤ 1.5 µM). Flow-cytometric analyses revealed that TQ consistently induced MDA-MB-468 and T-47D cell-cycle perturbation, specifically inducing pre-G1 populations. In comparison, less sensitive breast MCF-7 and colon HCT-116 cells exhibited only transient increases in pre-G1 events. Annexin V/PI staining confirmed apoptosis induction in MDA-MB-468 and HCT-116 cells, which was continuous in the former and transient in the latter. Experiments revealed the role of reactive oxygen species (ROS) generation and aneuploidy induction in MDA-MB-468 cells within the first 24 h of treatment. The ROS-scavenger NAD(P)H dehydrogenase (quinone 1) (NQO1; DT-diaphorase) and glutathione (GSH) were implicated in resistance to TQ. Indeed, western blot analyses showed that NQO1 is expressed in all cell lines in this study, except those most sensitive to TQ-MDA-MB-468 and T-47D. Moreover, TQ treatment increased NQO1 expression in HCT-116 in a concentration-dependent fashion. Measurement of GSH activity in MDA-MB-468 and HCT-116 cells found that GSH is similarly active in both cell lines. Furthermore, GSH depletion rendered these cells more sensitive to TQ's antiproliferative actions. Therefore, to bypass putative inactivation of the TQ semiquinone metabolite, the benzylamine analogue was designed and synthesised following modification of TQ's carbon-3 atom. However, the structural modification negatively impacted potency against MDA-MB-468 cells. In conclusion, we disclose the following: (i) The anticancer activity of TQ may be a consequence of ROS generation and aneuploidy; (ii) Early GSH depletion could substantially enhance TQ's anticancer activity; (iii) Benzylamine substitution at TQ's carbon-3 failed to enhance anticancer activity.

Keywords: GSH depletion; ROS generation; aneuploidy; apoptosis; thymoquinone.


Conflict of interest statement

The authors of this work declare that there is no conflict of interest.

Figures

Figure 1
Figure 1
Thymoquinone Structure.
Figure 2
Figure 2
(A). Line graphs show TQ’s growth-inhibitory effects on A549, HCT-116, HT-29, MCF-7, MDA-MB-468, MIAPaCa-2, T-47D, and MRC-5. Each graph shows three independent MTT trials. For each graph, the T0 value is the average of three trials. Cells were seeded in 96-well plates (3 × 10³ cells/well) and treated with TQ for 72 h. No. trials ≥ 3; n = 4 per independent experiment. (B). Mean ± SD bars show TQ’s inhibition of A549, HCT 116, HT-29, MCF-7, MDA-MB-468, MIAPaCa-2, and T-47D colonies. Data presented as mean survival fraction as % of control. Asterisk indicates significant inhibition (p ≤ 0.05). Cells were seeded, treated with TQ (24 h), and then medium was replaced. When colonies contained ≥50 cells in control wells, colonies were fixed, stained, and counted. Plating efficiencies ranged between 20 and 35%. No. trials ≥ 3; n = 2 per independent trial.
Figure 3
Figure 3
Mean ± SD bars showing % events distribution of MDA-MB-468 T-47D, MCF-7, and HCT-116 cell-cycles after 24, 72 h TQ exposures. MDA-MB-468 and T-47D treated with 1, 5, 10 μM TQ, and MCF-7 and HCT-116 treated with 10, 20 μM TQ. In former cells, TQ induced a significant concentration- and time-dependent increase in pre-G1 (<2N), with decreases in other cell-cycle phases. In the latter cells and after 24 h, TQ also induced a significant concentration-dependent increase pre-G1 (<2N), but after 72 h, fewer pre-G1 events were seen. Cells were treated, then stained with PI, and ≥20,000 events/sample were analysed. Asterisks indicate significant (p ≤ 0.05) changes compared to control. No. trials ≥ 3; n = 2 per independent experiment.
Figure 4
Figure 4
Mean ± SD bars showing annexin V/PI results of MDA-MB-468 and HCT-116 cells treated with TQ for 24, 72 h. MDA-MB-468 cells were treated with 1, 5, 10 μM TQ, and HCT-116 treated with 10, 20 μM TQ. TQ caused a significant concentration-dependent increase in apoptotic events. Samples were stained with annexin V/PI, and ≥10,000 events were detected. The percentage of apoptotic events was equal to the sum of cells undergoing early apoptosis (A+/PI−) plus late apoptosis (A+/PI+). Asterisks indicate statistically significant (p ≤ 0.05) increments compared to control. No. trials ≥ 3; n = 2 per independent experiment.
Figure 5
Figure 5
Mean ± SD bars showing a significant increase in ROS caused by TQ in MDA-MB-468 and T-47D in a concentration-dependent fashion. Higher ROS levels were seen in both cells after 6 h TQ treatments (1, 5, 10 μM) compared to the control. After 24 h, TQ (5, 10 μM) increased ROS but to reduced levels compared to 6 h treatments. No. trials ≥ 3; n = 2 per independent experiment. Asterisk indicates a statistically significant (p ≤ 0.05) fold increase relative to control.
Figure 6
Figure 6
Representative histograms showing the effect of TQ (5 μM) on MDA-MB-468 cell cycle following 6, 12, 24 h exposures. TQ induced significant time-dependent increase in aneuploid cells at G1, S, and G2/M phases after 6 and 12 h with increased pre-G1. After 24 h, pre-G1 and fewer aneuploid cells were observed. Red arrows show aneuploid cells. Cells were stained with PI, and ≥20,000 events/sample were detected. No. trials ≥ 3; n = 2 per independent experiment.
Figure 7
Figure 7
Representative western blot bands and mean ± SD bars showing NQO1 expression and band intensity in untreated A549, HCT-116, HT-29, MCF-7, MDA-MB-468, MIAPaCa-2, T-47D protein lysates. Antibodies to NQO1 and housekeeping gene β-Actin were used. NQO1 expression was seen in tested cell lines except for MDA-MB-468 and T-47D. Arrows show no detectable NQO1 expression in MDA-MB-468 and T-47D. Assay repeated three times.
Figure 8
Figure 8
Representative western blot bands and mean ± SD bars showing NQO1 expression in HCT-116 and MDA-MB-468 protein lysates after TQ treatments (24 and 72 h) using 10, 20 μM and 5, 10 μM TQ, respectively. Antibodies to NQO1 and housekeeping gene β-Actin were used. A time-dependent increase in NQO1 was observed in HCT-116, while no NQO1 expression was seen in MDA-MB-468 lysates. Assays were repeated three times. Asterisks indicate a statistically significant (* p ≤ 0.05, ** p ≤ 0.01) change compared to the control.
Figure 9
Figure 9
GSH depletion study in MDA-MB-468 and HCT-116 cells. (A,B): Mean ± SD bars showing GSH activity level in MDA-MB-468 and HCT-116 after 24 h TQ treatment using 1, 5 μM and 10, 20 μM, respectively. TQ significantly depleted GSH in MDA-MB-468 and HCT-116 at 5 μM and 20 μM, respectively. (C,D): Line graphs showing growth-inhibitory effects of BSO in MDA-MB-468 and HCT-116. Means ± SDs from one representative MTT trial (No. trials ≥ 3; n = 4 per independent experiment). Cells were seeded in 96-well plates (3 × 10³ cells/well) and treated with BSO for 72 h. (E,F): Mean ± SD bars shows GSH depletion by BSO in MDA-MB-468 and HCT-116 cells following 24 h exposure. Rectangles show the optimum BSO concentrations for GSH depletion with minimal effects on cell proliferation. Asterisk indicates a statistically significant (p ≤ 0.05).
Figure 10
Figure 10
Mean ± SD bars show the effect of GSH depletion on TQ GI50 in MDA-MB-468 and HCT-116. GSH depletion significantly enhanced HCT-116 sensitivity to TQ. Asterisks indicate statistically significant (p ≤ 0.001) change compared to non-GSH depleted HCT-116. MDA-MB-468 showed slightly decreased GI50, which was not significant. No. trials ≥ 3; n = 4 per independent experiment.
Figure 11
Figure 11
Synthesis of TQ1 (c) by Michael addition reaction of benzylamine (b) and TQ (a) with the less nucleophilic nitrogen attacking carbon 3 of TQ.
Figure 12
Figure 12
Growth-inhibitory effects of TQ1 in MDA-MB-468 and HCT-116. Each representative graph shows one independent MTT trial. Cells were seeded in 96-well plates (3 × 10³ cells/well) and treated with TQ1 for 72 h. No. trials ≥ 3; n = 4 per independent experiment.
Figure 13
Figure 13
Diagram showing TQ’s oxido-reduction cycling. TQ can be converted through enzymatic reaction into thymohydroquinone either by a one-step two-electron reduction or by two-step one-electron reduction. A one-step two-electron reduction can lead to the direct formation of thymohydroquinone by NQO1. TQ may also be reduced in a non-enzymatic reaction through interaction with GSH to generate glutathionyldihydro-TQ. Alternatively, in one-electron reduction, E1, E2, and E3 catalyse TQ’s conversion into the pro-oxidant semiquinone. Thereafter, semiquinone is converted into thymohydroquinone. While thymohydroquinone and glutathionyldihydro-TQ are antioxidants, semiquinone acts as a pro-oxidant in the tumour environment. The superoxide anion produced by the oxidation of reduced TQ can be detoxified by E4 and E5. In the absence of detoxifying enzymes, which is common in numerous cancers, the increased superoxide levels can contribute to the pro-oxidant effect of TQ [20].

Similar articles

Cited by

References

    1. Hanahan D., Weinberg R.A. Hallmarks of cancer: The next generation. Cell. 2011;144:646–674. doi: 10.1016/j.cell.2011.02.013. - DOI - PubMed
    1. Imran M., Rauf A., Khan I.A., Shahbaz M., Qaisrani T.B., Fatmawati S., Abu-Izneid T., Imran A., Rahman K.U., Gondal T.A. Thymoquinone: A novel strategy to combat cancer: A review. Biomed. Pharmacother. 2018;106:390–402. doi: 10.1016/j.biopha.2018.06.159. - DOI - PubMed
    1. Khan A., Tania M., Fu S., Fu J. Thymoquinone, as an anticancer molecule: From basic research to clinical investigation. Oncotarget. 2017;8:51907–51919. doi: 10.18632/oncotarget.17206. - DOI - PMC - PubMed
    1. Schneider-Stock R., Fakhoury I., Zaki A.M., El-Baba C., Gali-Muhtasib H.U. Thymoquinone: Fifty years of success in the battle against cancer models. Drug Discov. Today. 2014;19:18–30. doi: 10.1016/j.drudis.2013.08.021. - DOI - PubMed
    1. Rajput S., Kumar B.P., Dey K.K., Pal I., Parekh A., Mandal M. Molecular targeting of Akt by thymoquinone promotes G1 arrest through translation inhibition of cyclin D1 and induces apoptosis in breast cancer cells. Life Sci. 2013;93:783–790. doi: 10.1016/j.lfs.2013.09.009. - DOI - PubMed