. 2021 Aug 29;14(17):4919.
doi: 10.3390/ma14174919.

Printable and Machinable Dental Restorative Composites for CAD/CAM Application-Comparison of Mechanical Properties, Fractographic, Texture and Fractal Dimension Analysis

Affiliations

Printable and Machinable Dental Restorative Composites for CAD/CAM Application-Comparison of Mechanical Properties, Fractographic, Texture and Fractal Dimension Analysis

Wojciech Grzebieluch et al. Materials (Basel). .

Abstract

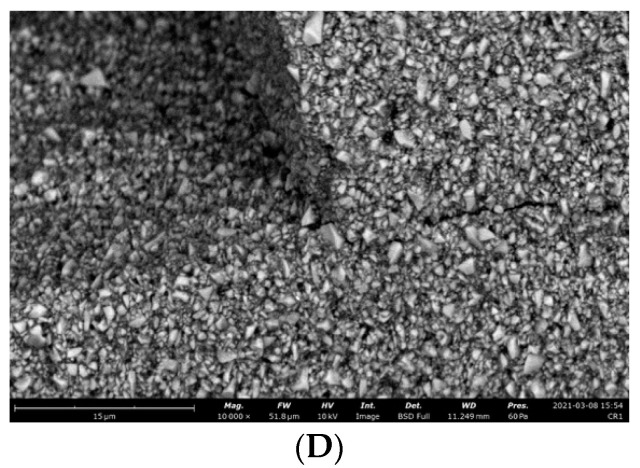
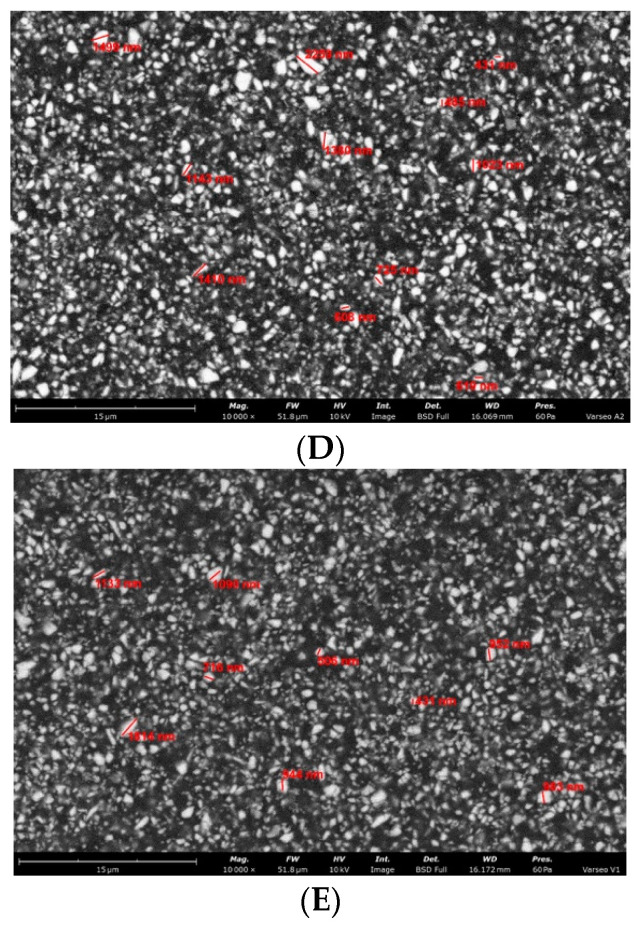
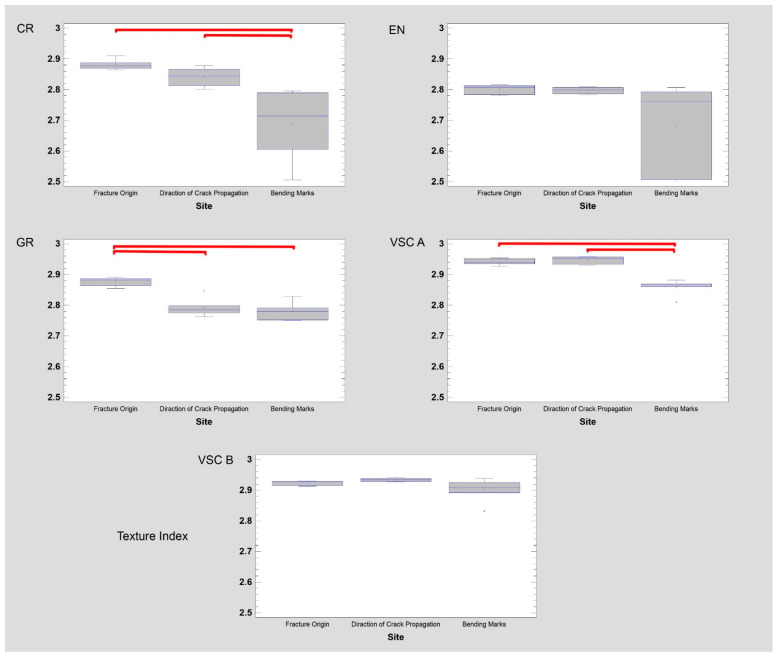
Thanks to the continuous development of light-curing resin composites it is now possible to print permanent single-tooth restorations. The purpose of this study was to compare resin composites for milling -Gandio Blocks (GR), Brilliant Crios (CR) and Enamic (EN) with resin composite for 3D printing-Varseo Smile Crown plus (VSC). Three-point bending was used to measure flexural strength (σf) and flexural modulus (Ef). The microhardness was measured using a Vickers method, while fractographic, microstructural, texture and fractal dimension (FD) analyses were performed using SEM, optical microscope and picture analysis methods. The values of σf ranged from 118.96 (±2.81) MPa for EN to 186.02 (±10.49) MPa for GR, and the values of Ef ranged from 4.37 (±0.8) GPa for VSC to 28.55 (±0.34) GPa for EN. HV01 ranged from 25.8 (±0.7) for VSC to 273.42 (±27.11) for EN. The filler content ranged from 19-24 vol. % for VSC to 70-80 vol. % for GR and EN. The observed fractures are typical for brittle materials. The correlation between FD of materials microstructure and Ef was observed. σf of the printed resin depends on layers orientation and is significantly lower than σf of GR and CR. Ef of the printed material is significantly lower than Ef of blocks for milling.

Keywords: dental CAD/CAM materials; fractal dimension analysis; fractography; printable resin composites; texture analysis.


Conflict of interest statement

The authors declare no conflict of interest. The funders had no role in the design of the study; in the collection, analyses, or interpretation of data; in the writing of the manuscript, or in the decision to publish the results.

Figures

Figure 1
Figure 1
(A) bottle of VarseoSmile Crown plus composite resin for 3D printing; (B) blocks of materials for milling; (C) diamond saw or blocks cutting; (D) 3D printed holder with CAD/CAM block during cutting process; (E) 3D printed bars of VarseoSmile Crown plus on the printing platform (after cleaning with ethanol).
Figure 2
Figure 2
Graphical interpretation of counting box method for fractal dimension counting; (A) analysed bitmap, dimension of analysed square size (ε); (B) Number of squares need to cover examined shape in the function of square size (ε); (C) a straight line drawn through points from table B on the x-y chart in decimal logarithm scale. The slope factor of this straight line is a value fractal dimension counted using the box method.
Figure 3
Figure 3
Graphical interpretation of intensity difference algorithm for fractal dimension counting. (A) an example of a grayscale 8 bits image, with numbers in squares representing the intensity level of each pixel–0–black, 255 white. Red squares represent scale—ε. (B) the values of intensity difference for each step of scale reduction (ε). (C) a straight line drawn through points from table B on the x-y chart in the natural logarithm scale. The slope factor for this straight line is a value fractal dimension counted by intense difference algorithm.
Figure 4
Figure 4
Representative microscopic and SEM images of the fracture surface of the GR sample; (A) visible compression curl on top, the direction of crack propagation (DCP) and the origin on the bottom; (B) Red lines indicate the width and depth of the crack at the fracture origin. Black arrows indicate the direction of crack propagation away from the crack origin, white arrows indicate bending marks on the fracture surface; (C) microcrack spreading along the particle boundaries visible on the enlarged area of figure (B) indicated by the white arrow; (D) microcrack spreading along the particle boundaries visible on the enlarged area of figure (B) indicated by the white arrow.
Figure 4
Figure 4
Representative microscopic and SEM images of the fracture surface of the GR sample; (A) visible compression curl on top, the direction of crack propagation (DCP) and the origin on the bottom; (B) Red lines indicate the width and depth of the crack at the fracture origin. Black arrows indicate the direction of crack propagation away from the crack origin, white arrows indicate bending marks on the fracture surface; (C) microcrack spreading along the particle boundaries visible on the enlarged area of figure (B) indicated by the white arrow; (D) microcrack spreading along the particle boundaries visible on the enlarged area of figure (B) indicated by the white arrow.
Figure 5
Figure 5
Representative microscopic and SEM images of the fracture surface of the CR sample; (A) visible compression curl on top, the direction of crack propagation and the origin on the bottom; (B) Red lines indicate the width and depth of the crack at the fracture origin. Black arrows indicate the direction of crack propagation away from the crack origin, white arrows indicate bending marks on the fracture surface; (C) microcrack spreading along the particle boundaries visible on the enlarged area of figure (B) indicated by the white arrow; (D) microcrack spreading along the particle boundaries visible on the enlarged area of figure (B) indicated by the white arrow.
Figure 5
Figure 5
Representative microscopic and SEM images of the fracture surface of the CR sample; (A) visible compression curl on top, the direction of crack propagation and the origin on the bottom; (B) Red lines indicate the width and depth of the crack at the fracture origin. Black arrows indicate the direction of crack propagation away from the crack origin, white arrows indicate bending marks on the fracture surface; (C) microcrack spreading along the particle boundaries visible on the enlarged area of figure (B) indicated by the white arrow; (D) microcrack spreading along the particle boundaries visible on the enlarged area of figure (B) indicated by the white arrow.
Figure 6
Figure 6
Representative microscopic and SEM images of the fracture surface of the EN sample; (A) visible compression curl on top, the direction of crack propagation and the origin on the bottom; (B) Red lines indicate the width and depth of the crack at the fracture origin. Black arrows indicate the direction of crack propagation away from the crack origin, white arrows indicate bending marks on the fracture surface; (C) microcrack by particles visible on the enlarged area of figure (B) indicated by the white arrow; (D) microcrack by particles visible on the enlarged area of figure (B) indicated by the white arrow.
Figure 6
Figure 6
Representative microscopic and SEM images of the fracture surface of the EN sample; (A) visible compression curl on top, the direction of crack propagation and the origin on the bottom; (B) Red lines indicate the width and depth of the crack at the fracture origin. Black arrows indicate the direction of crack propagation away from the crack origin, white arrows indicate bending marks on the fracture surface; (C) microcrack by particles visible on the enlarged area of figure (B) indicated by the white arrow; (D) microcrack by particles visible on the enlarged area of figure (B) indicated by the white arrow.
Figure 7
Figure 7
Representative microscopic and SEM images of the fracture surface of the VSC A sample; (A) visible compression curl on top, the direction of crack propagation and the origin on the bottom; (B) Red lines indicate the width and depth of the crack at the fracture origin. Black arrows indicate the direction of crack propagation away from the crack origin, white arrows indicate bending marks on the fracture surface; (C) microcrack spreading along the particle boundaries visible on the enlarged area of figure (B) indicated by the white arrow; (D) microcrack spreading along the particle boundaries visible on the enlarged area of figure (B) indicated by the white arrow.
Figure 7
Figure 7
Representative microscopic and SEM images of the fracture surface of the VSC A sample; (A) visible compression curl on top, the direction of crack propagation and the origin on the bottom; (B) Red lines indicate the width and depth of the crack at the fracture origin. Black arrows indicate the direction of crack propagation away from the crack origin, white arrows indicate bending marks on the fracture surface; (C) microcrack spreading along the particle boundaries visible on the enlarged area of figure (B) indicated by the white arrow; (D) microcrack spreading along the particle boundaries visible on the enlarged area of figure (B) indicated by the white arrow.
Figure 8
Figure 8
Representative microscopic and SEM images of the fracture surface of the VSC B sample; (A) visible compression curl on top, the direction of crack propagation and the origin on the bottom; (B) Red lines indicate the width and depth of the crack at the fracture origin. Black arrows indicate the direction of crack propagation away from the crack origin, white arrows indicate bending marks on the fracture surface; (C) microcrack spreading along the particle boundaries visible on the enlarged area of figure (B) indicated by the white arrow; (D) microcrack spreading along the particle boundaries visible on the enlarged area of figure (B) indicated by the white arrow.
Figure 8
Figure 8
Representative microscopic and SEM images of the fracture surface of the VSC B sample; (A) visible compression curl on top, the direction of crack propagation and the origin on the bottom; (B) Red lines indicate the width and depth of the crack at the fracture origin. Black arrows indicate the direction of crack propagation away from the crack origin, white arrows indicate bending marks on the fracture surface; (C) microcrack spreading along the particle boundaries visible on the enlarged area of figure (B) indicated by the white arrow; (D) microcrack spreading along the particle boundaries visible on the enlarged area of figure (B) indicated by the white arrow.
Figure 9
Figure 9
Representative SEM images of the surface of tested materials; (A) GR filler size ranged from 190 nm to 7 µm, filler content 70–80 vol. %; (B) CR filler size ranged from 160 nm to 3 µm, filler content around 55–65 vol. %; (C) EN filler size ranged from 1 µm to 11 µm, filler content around 75 vol. %; (D) VSC A filler size ranged 430 nm to 3 µm, filler content around 24–30 vol. %; (E) VSC B filler size 430 nm do 3 µm, filler content around 19–24 vol. % (GR—Grandio blocs, CR—Brilliant Crios, EN—Enamic, VSC—Varseo Smile Crown plus).
Figure 9
Figure 9
Representative SEM images of the surface of tested materials; (A) GR filler size ranged from 190 nm to 7 µm, filler content 70–80 vol. %; (B) CR filler size ranged from 160 nm to 3 µm, filler content around 55–65 vol. %; (C) EN filler size ranged from 1 µm to 11 µm, filler content around 75 vol. %; (D) VSC A filler size ranged 430 nm to 3 µm, filler content around 24–30 vol. %; (E) VSC B filler size 430 nm do 3 µm, filler content around 19–24 vol. % (GR—Grandio blocs, CR—Brilliant Crios, EN—Enamic, VSC—Varseo Smile Crown plus).
Figure 10
Figure 10
Texture analysis of dental composites samples in two kinds of features in high magnification: ROI = 15 µm × 15 µm. Derived from co-occurrence matrix (Entropy and DifEntrp) and the run-length matrix (ShryREmp and LngREmph). In the feature intensity maps of the polished samples, white indicates a significant intensity of a given texture feature and black indicates none or low intensity of the feature.
Figure 11
Figure 11
Visible light examination of fracture surfaces—microphotographs of five dental composites. Results of surface texture analysis using Texture Index, GR—Grandio blocs, CR—Brilliant Crios, EN—Enamic, VSC—Varseo Smile Crown plus.

Similar articles

Cited by

References

    1. van Noort R. The future of dental devices is digital. Dent. Mater. 2012;28:3–12. doi: 10.1016/j.dental.2011.10.014. - DOI - PubMed
    1. Kawaguchi-Uemura A., Mine A., Matsumoto M., Tajiri Y., Higashi M., Kabetani T., Hagino R., Imai D., Minamino T., Miura J., et al. Adhesion procedure for CAD/CAM resin crown bonding: Reduction of bond strengths due to artificial saliva contamination. J. Prosthodont. Res. 2018;62:177–183. doi: 10.1016/j.jpor.2017.08.006. - DOI - PubMed
    1. Ruse N.D., Sadoun M.J. Resin-composite blocks for dental CAD/CAM applications. J. Dent. Res. 2014;93:1232–1234. doi: 10.1177/0022034514553976. - DOI - PMC - PubMed
    1. Abduo J., Lyons K., Bennamoun M. Trends in computer-aided manufacturing in prosthodontics: A review of the available streams. Int. J. Dent. 2014:783948. doi: 10.1155/2014/783948. - DOI - PMC - PubMed
    1. Naseer M.U., Kallaste A., Asad B., Vaimann T., Rassõlkin A. A Review on Additive Manufacturing Possibilities for Electrical Machines. Energies. 2021;14:1940. doi: 10.3390/en14071940. - DOI