. 2021 Aug 31;10(17):3931.
doi: 10.3390/jcm10173931.

Small Neuron-Derived Extracellular Vesicles from Individuals with Down Syndrome Propagate Tau Pathology in the Wildtype Mouse Brain

Affiliations

Small Neuron-Derived Extracellular Vesicles from Individuals with Down Syndrome Propagate Tau Pathology in the Wildtype Mouse Brain

Aurélie Ledreux et al. J Clin Med. .

Abstract

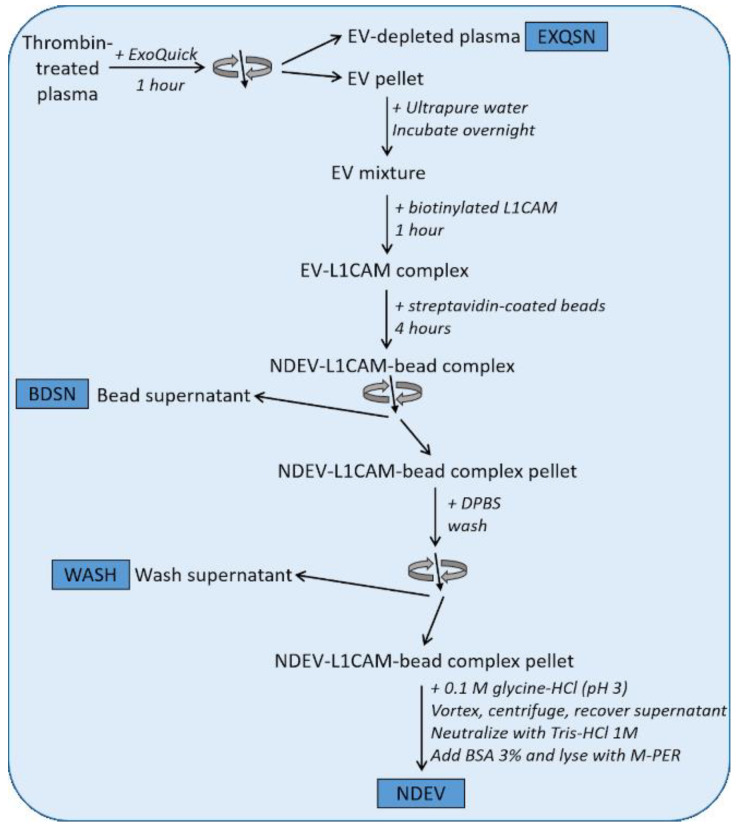
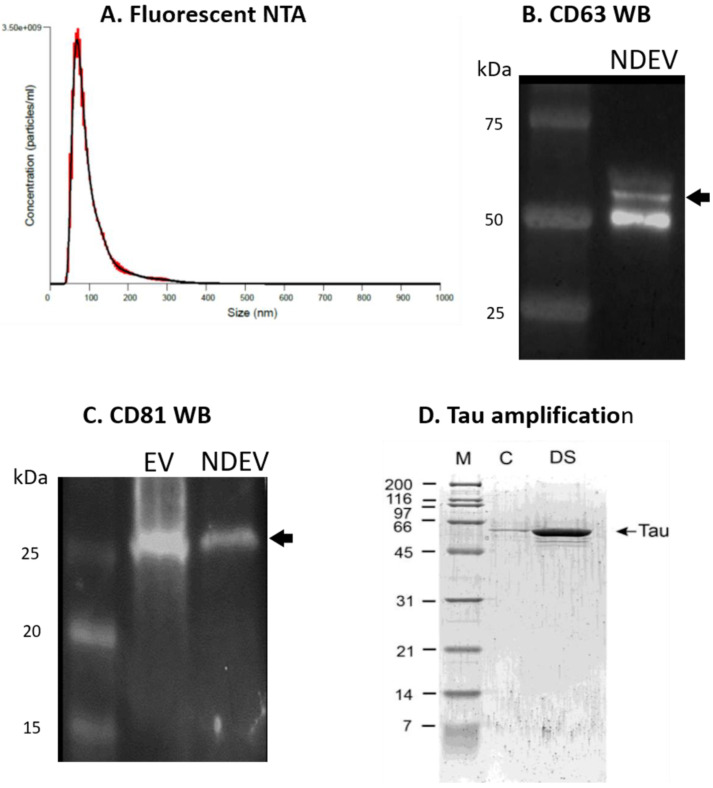
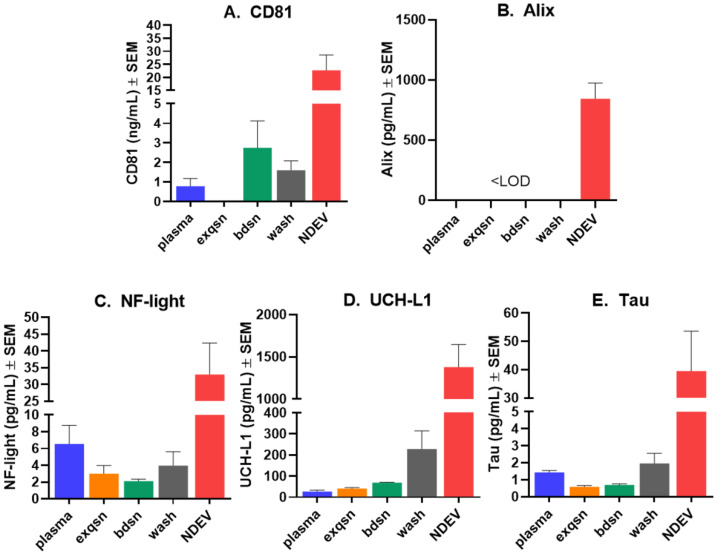
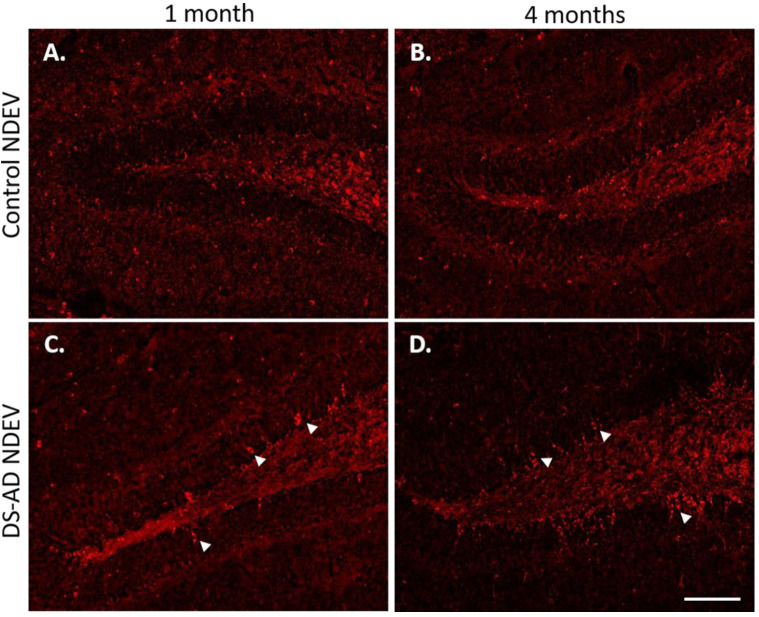
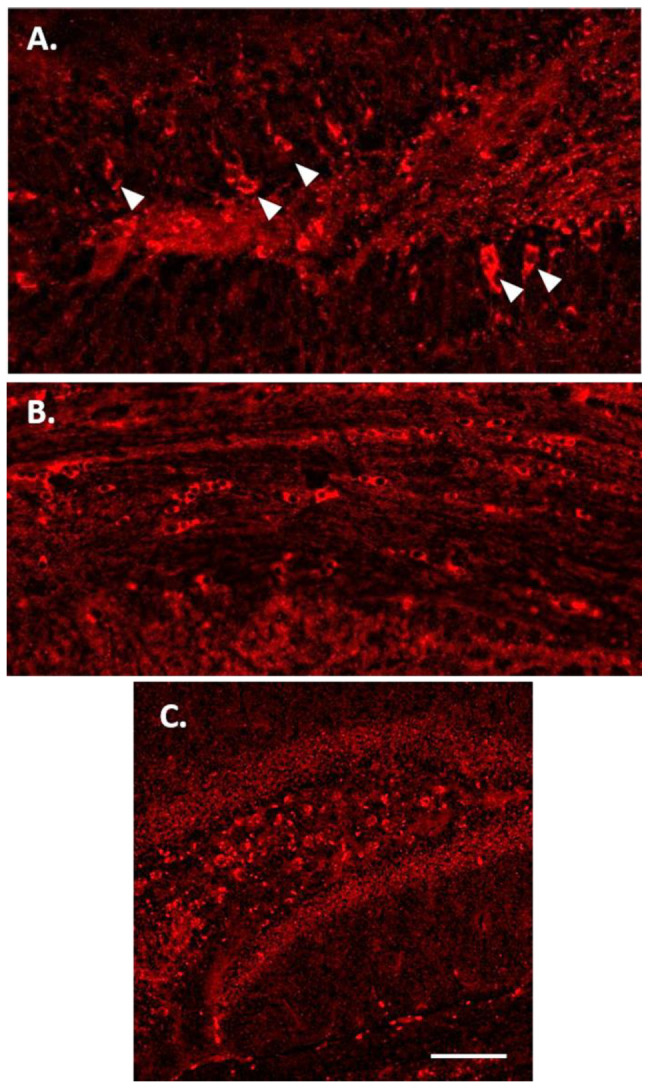
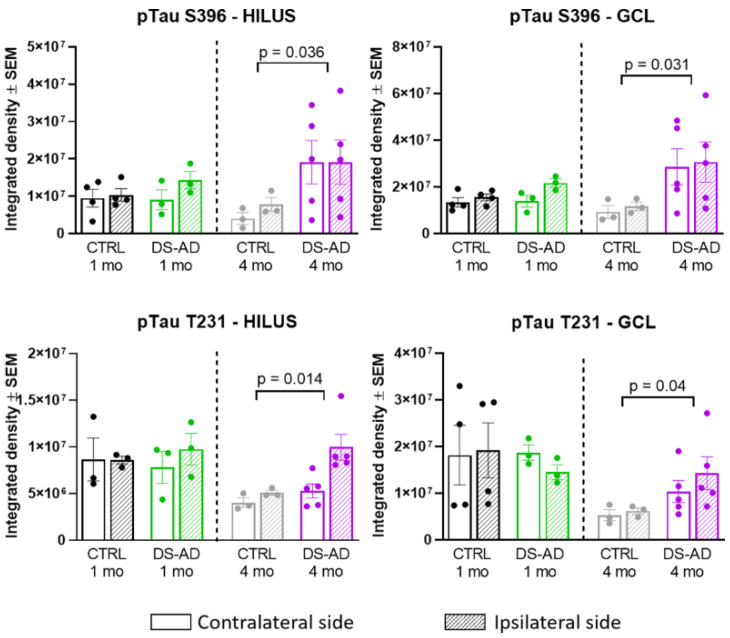
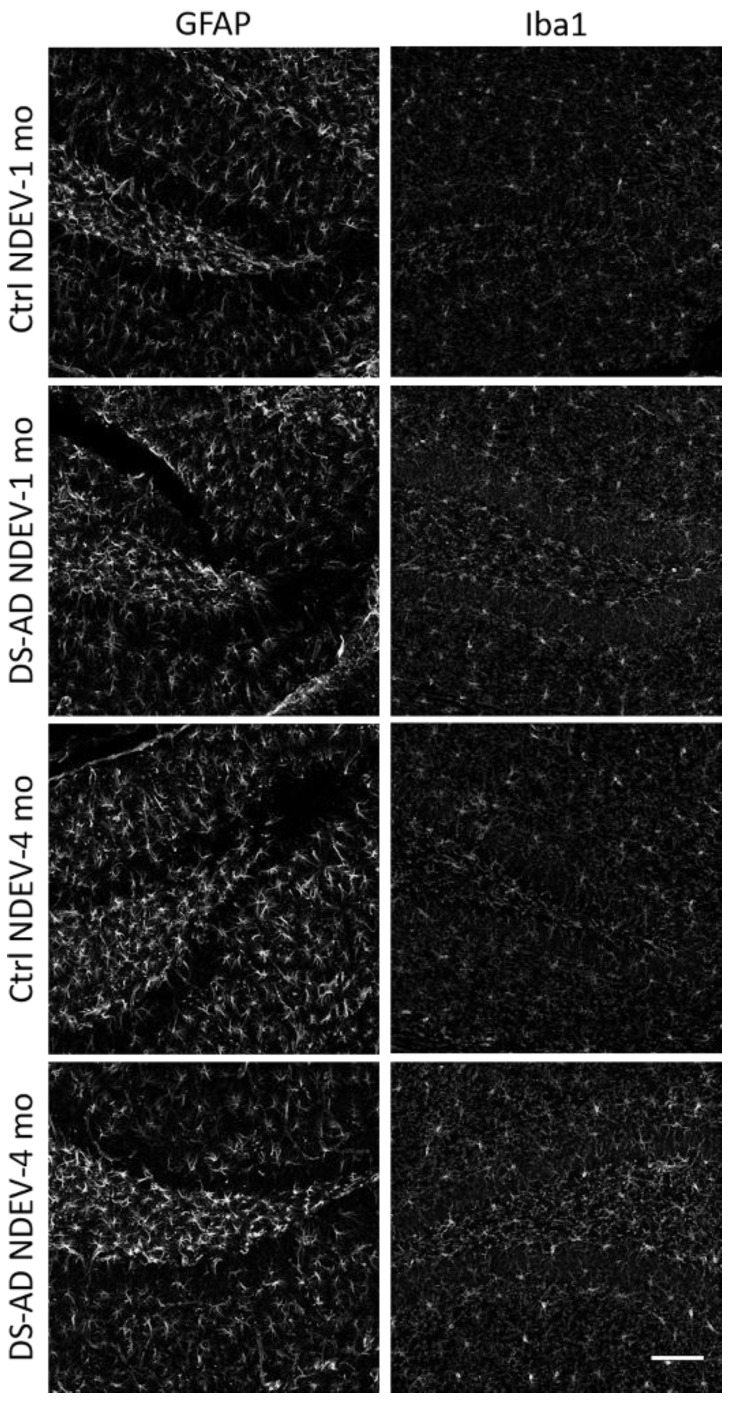
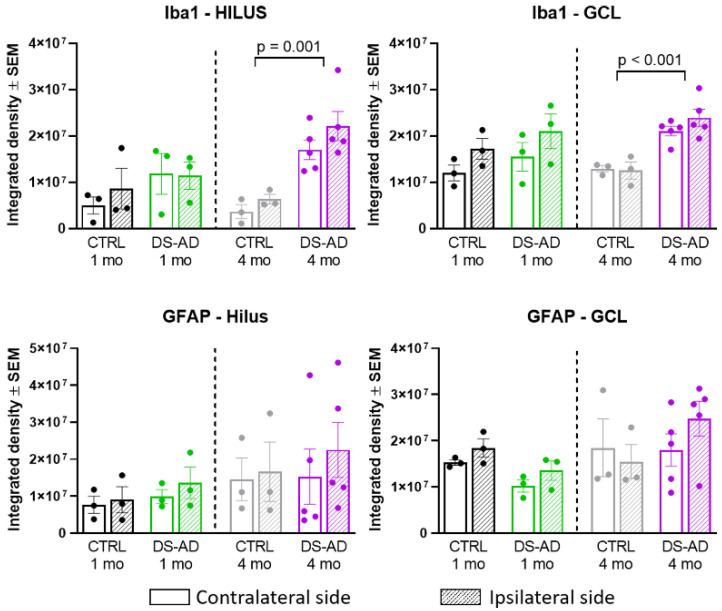
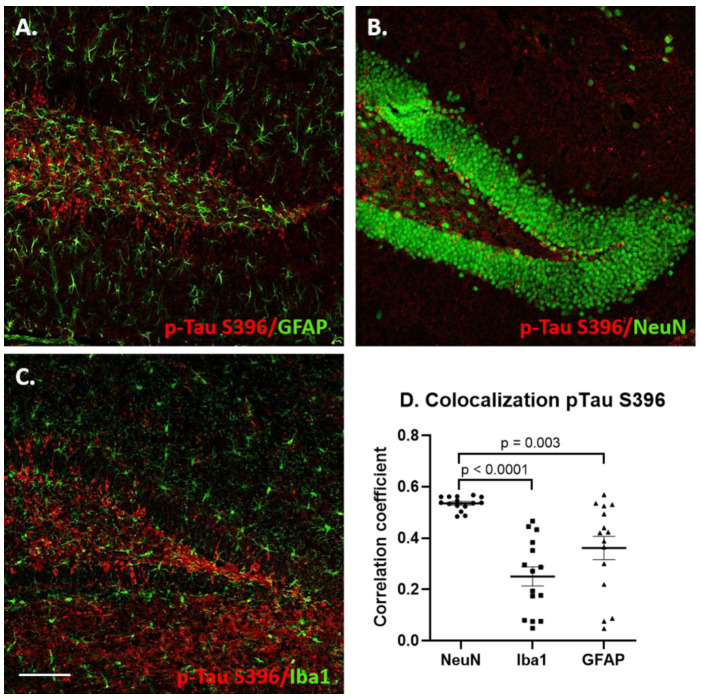
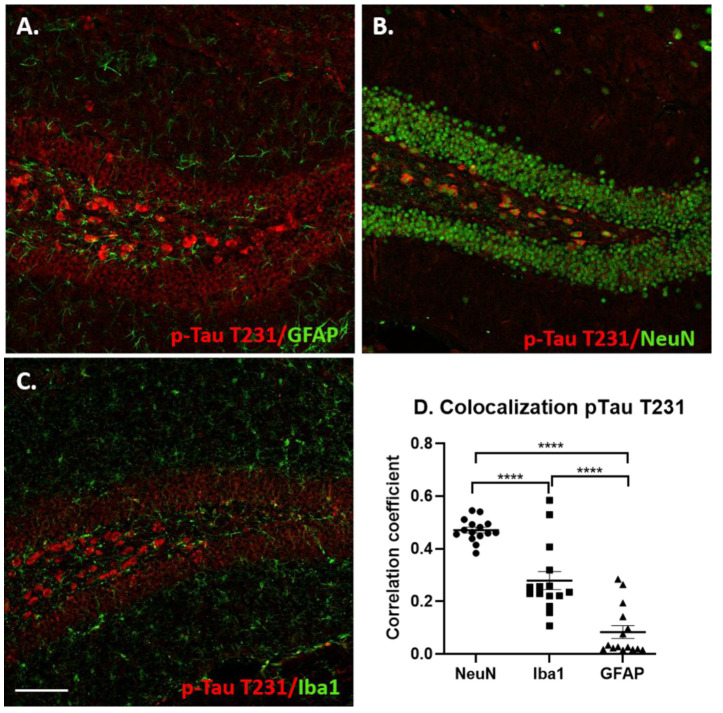
Individuals with Down syndrome (DS) exhibit Alzheimer's disease (AD) pathology at a young age, including amyloid plaques and neurofibrillary tangles (NFTs). Tau pathology can spread via extracellular vesicles, such as exosomes. The cargo of neuron-derived small extracellular vesicles (NDEVs) from individuals with DS contains p-Tau at an early age. The goal of the study was to investigate whether NDEVs isolated from the blood of individuals with DS can spread Tau pathology in the brain of wildtype mice. We purified NDEVs from the plasma of patients with DS-AD and controls and injected small quantities using stereotaxic surgery into the dorsal hippocampus of adult wildtype mice. Seeding competent Tau conformers were amplified in vitro from DS-AD NDEVs but not NDEVs from controls. One month or 4 months post-injection, we examined Tau pathology in mouse brains. We found abundant p-Tau immunostaining in the hippocampus of the mice injected with DS-AD NDEVs compared to injections of age-matched control NDEVs. Double labeling with neuronal and glial markers showed that p-Tau staining was largely found in neurons and, to a lesser extent, in glial cells and that p-Tau immunostaining was spreading along the corpus callosum and the medio-lateral axis of the hippocampus. These studies demonstrate that NDEVs from DS-AD patients exhibit Tau seeding capacity and give rise to tangle-like intracellular inclusions.

Keywords: Alzheimer’s disease; Down syndrome; aging; biomarkers; neuropathology.


Conflict of interest statement

The authors declare no conflict of interest.

Figures

Figure 1
Figure 1
Experimental workflow for exosome validation studies. Thrombin-treated plasma was first processed with ExoQuick polymer reagent, whereafter the EV-depleted plasma (EXQSN) was collected. The EV pellets were then mixed with L1CAM biotinylated antibody, then streptavidin-coated beads. The bead supernatant (BDSN) was collected for biomarker analyses and the bead complex was next washed with Dulbecco’s Phosphate Buffered Saline (DPBS) (WASH was collected). Neuron-derived small extracellular vesicles (NDEVs) were then recovered from the mix. Exosome-related proteins and neuron-specific proteins were measured at each step of the isolation procedure. The results from these validation studies are presented in Figures 2 and 3.
Figure 2
Figure 2
NDEV characterization. (A) Fluorescent nanoparticle tracking analysis illustrating size distribution and concentration of extracellular vesicles in neuron-derived exosome samples. The single peak at ≈100 nm suggests small extracellular vesicle (EV)-specific enrichment. (B) Representative Western blot image of CD63 tetraspanin protein indicative of EV enrichment. CD63 (System Biosciences, EXOAB-CD63A-1) was detected at 53 kD in NDEVs isolated from human plasma via Western blot. (C) Representative Western blot showing tetraspanin CD81 (SAB3500454, Sigma Aldrich) at 25 kD in total EVs (EV) from human plasma (System Biosciences, EXOP-500A-1) and neuron-derived EVs (NDEV) isolated from human plasma. (D) Amplification of Tau fibrils from NDEVs obtained from blood. M = marker, C = control NDEVs, DS = NDEVs from plasma from a subject with Down syndrome.
Figure 3
Figure 3
Quantification of biomarkers showing enrichment for neuron-derived EVs. Biomarkers were measured in plasma, EV-depleted plasma (exqsn), bead supernatant (bdsn), wash supernatant (wash) and in NDEVs (described in Figure 1). Levels of small EV-associated tetraspanin CD81 (A) and Alix (B) were measured using commercial ELISA kits (Cusabio). Levels of neuron-specific proteins NF-light (C), UCH-L1 (D) and Tau (E) in plasma were measured using Simoa assay kits on the SR-X instrument (Quanterix). Note that NDEVs contained significantly higher levels of all components including the neuron-specific markers, strongly suggesting that the immunoprecipitation procedure for NDEVs had succeeded. The same process was used to obtain the NDEVs for injection into mouse brain.
Figure 4
Figure 4
Representative images of p-Tau (S396) staining in WT mouse dentate gyrus area 1 month or 4 months following intra-hippocampal injections of NDEVs enriched from plasma from a control case (A,B) and a DS-AD case (C,D). Note the significant increase in p-Tau inclusions in neurons after DS-AD NDEV injections (arrowheads in (C,D)), especially in neurons located in the granule cell layer (GCL). Few, if any, intraneuronal p-Tau inclusions were observed in brains injected with control NDEVs (A,B). Scale bar in (D) represents 100 μm.
Figure 5
Figure 5
p-Tau immunostaining 4 months after injection of DS-AD NDEVs. There was a wide distribution of p-Tau S396-positive cells within the GCL of the dentate gyrus (A) and the corpus callosum (B). (C) Representative p-Tau T231 immunostaining in the hippocampus 1 month following DS-AD NDEV injection. Note the difference in distribution, with large neurons in the hilar region staining in a uniform pattern without strong “flame-like” tangle staining in the apical dendrite. Scale bar in C represents 100 microns.
Figure 6
Figure 6
Densitometry of p-Tau S396, and p-Tau T231 in the Hilar region (left panels) and the GCL (right panels) of the hippocampus. There was a significant increase in p-Tau S396 staining in the Hilar region between DS-AD and controls at 4 months (p = 0.03) and in the GCL (p = 0.03). In addition, there was a significant increase in T231 p-Tau after 4 months in mice injected with DS-AD vs. Controls in the hilar region (p = 0.014) and in the GCL (p = 0.04).
Figure 7
Figure 7
Representative images for GFAP (on the left) and Iba1 (on the right) immunofluorescent staining. Note an increase in staining intensities in mice who received DS-AD NDEVs compared to control NDEV injections. The astrogliosis following DS-AD NDEVs was more obvious but also displayed more variability between animals 4 months following the injections. Note an increase in Iba1 staining intensity in DS-AD NDEV-injected mice 4 months following injection, and to a lesser extent 1 month following injection. Scale bar represents 100 microns.
Figure 8
Figure 8
Densitometry for Iba1 and GFAP showed increased glial activation in mice injected with the DS-AD NDEVs compared to controls. Density measurements for Iba1, but not GFAP, were significantly elevated 4 months after DS-AD injection compared to controls (p < 0.001).
Figure 9
Figure 9
Co-localization of p-Tau S396 staining with neuronal and glial markers in the dentate gyrus region of hippocampus 1 month following DS-AD NDEV injections. (A) Double labeling for p-Tau S396 (red) and GFAP (green), (B) double labeling for p-Tau S396 (red) and NeuN (green), (C) double labeling for p-Tau S396 (red) and Iba1 (green). Scale bar in C corresponds to 100 microns. The scatter plot graph (D) shows the correlation coefficients for p-Tau S396 with NeuN, Iba1 and GFAP.
Figure 10
Figure 10
Co-localization of p-Tau T231 staining with neuronal and glial markers. (A) Double labeling for p-Tau T231 (red) and GFAP (green), (B) double labeling for p-Tau T231 (red) and NeuN (green), (C) double labeling for p-Tau T231 (red) and Iba1 (green). Evaluation of the double-labeled sections revealed p-Tau T231 staining was largely located to neurons, with some staining observed in microglia (Iba1) and to a lesser extent astrocytes (GFAP). The scatter plot graph (D) shows the correlation coefficients for p-Tau T231 colocalization with NeuN, Iba1 and GFAP (****, p < 0.0001).

References

    1. Capone G.T., Chicoine B., Bulova P., Stephens M., Hart S., Crissman B., Videlefsky A., Myers K., Roizen N., Esbensen A., et al. Co-occurring medical conditions in adults with Down syndrome: A systematic review toward the development of health care guidelines. Am. J. Med. Genet. A. 2018;176:116–133. doi: 10.1002/ajmg.a.38512. - DOI - PubMed
    1. Asim A., Kumar A., Muthuswamy S., Jain S., Agarwal S. Down syndrome: An insight of the disease. J. Biomed. Sci. 2015;22:41. doi: 10.1186/s12929-015-0138-y. - DOI - PMC - PubMed
    1. Delabar J.M., Allinquant B., Bianchi D., Blumenthal T., Dekker A., Edgin J., O’Bryan J., Dierssen M., Potier M.C., Wiseman F., et al. Changing Paradigms in Down Syndrome: The First International Conference of the Trisomy 21 Research Society. Mol. Syndr. 2016;7:251–261. doi: 10.1159/000449049. - DOI - PMC - PubMed
    1. Egensperger R., Weggen S., Ida N., Multhaup G., Schnabel R., Beyreuther K., Bayer T.A. Reverse relationship between beta-amyloid precursor protein and beta-amyloid peptide plaques in Down’s syndrome versus sporadic/familial Alzheimer’s disease. Acta Neuropathol. 1999;97:113–118. doi: 10.1007/s004010050963. - DOI - PubMed
    1. Fortea J., Carmona-Iragui M., Benejam B., Fernandez S., Videla L., Barroeta I., Alcolea D., Pegueroles J., Munoz L., Belbin O., et al. Plasma and CSF biomarkers for the diagnosis of Alzheimer’s disease in adults with Down syndrome: A cross-sectional study. Lancet Neurol. 2018;17:860–869. doi: 10.1016/S1474-4422(18)30285-0. - DOI - PubMed

LinkOut - more resources