

Assessing the Water Quality of Lake Hawassa Ethiopia-Trophic State and Suitability for Anthropogenic Uses-Applying Common Water Quality Indices
- PMID: 34501493
- PMCID: PMC8430541
- DOI: 10.3390/ijerph18178904
Assessing the Water Quality of Lake Hawassa Ethiopia-Trophic State and Suitability for Anthropogenic Uses-Applying Common Water Quality Indices
Abstract
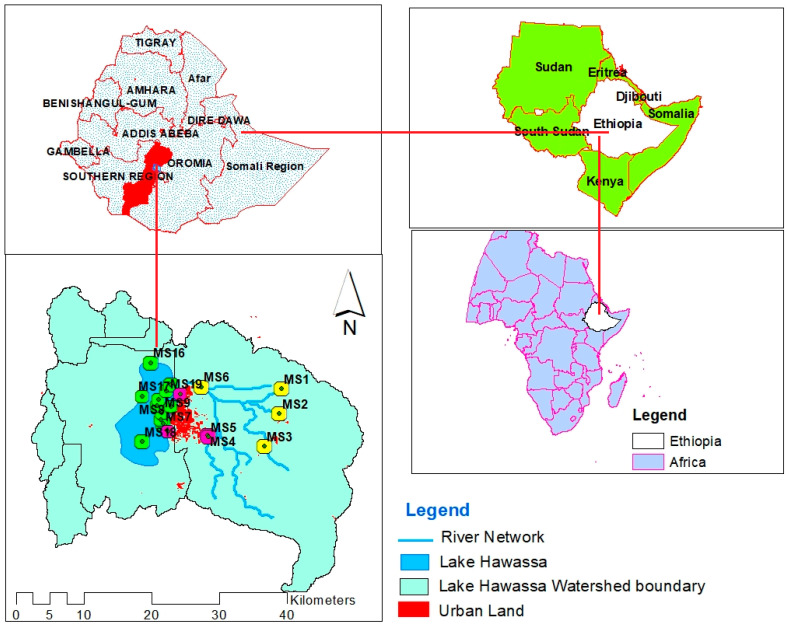
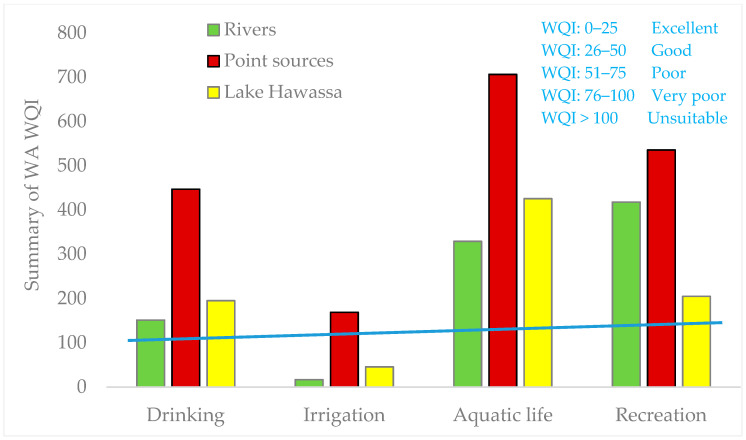
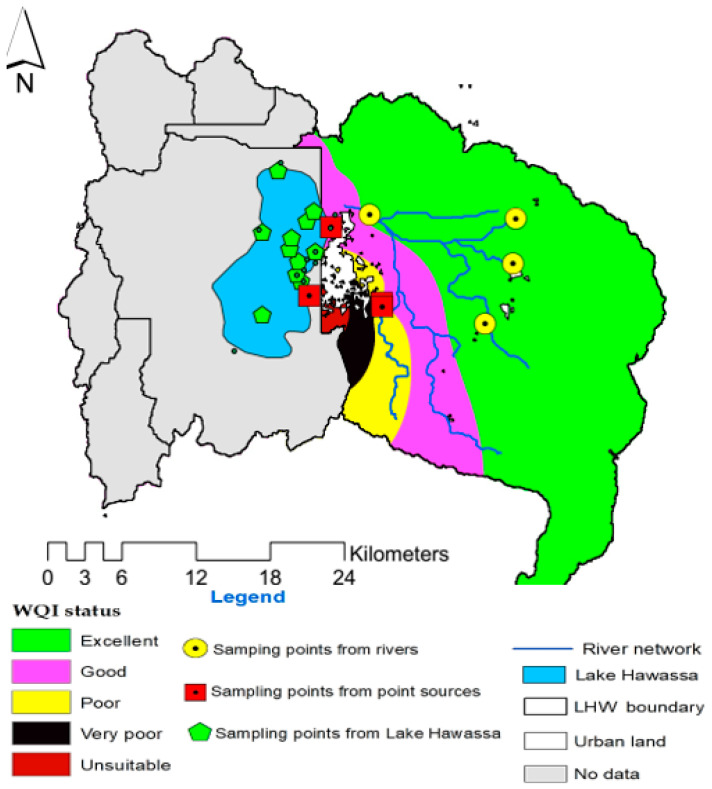
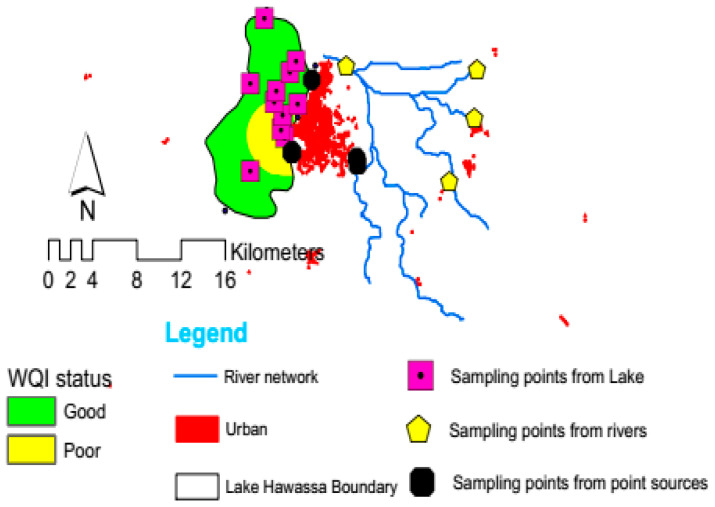
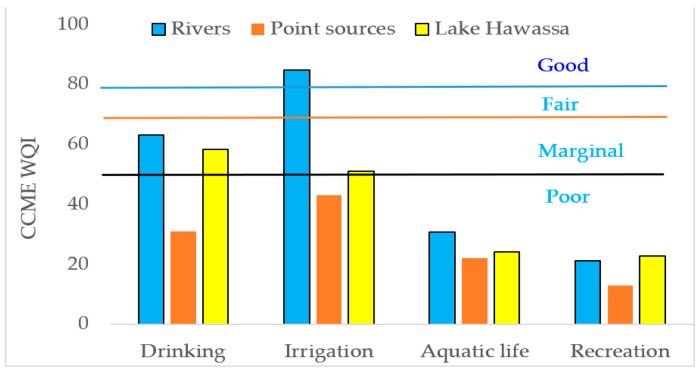
The rapid growth of urbanization, industrialization and poor wastewater management practices have led to an intense water quality impediment in Lake Hawassa Watershed. This study has intended to engage the different water quality indices to categorize the suitability of the water quality of Lake Hawassa Watershed for anthropogenic uses and identify the trophic state of Lake Hawassa. Analysis of physicochemical water quality parameters at selected sites and periods was conducted throughout May 2020 to January 2021 to assess the present status of the Lake Watershed. In total, 19 monitoring sites and 21 physicochemical parameters were selected and analyzed in a laboratory. The Canadian council of ministries of the environment (CCME WQI) and weighted arithmetic (WA WQI) water quality indices have been used to cluster the water quality of Lake Hawassa Watershed and the Carlson trophic state index (TSI) has been employed to identify the trophic state of Lake Hawassa. The water quality is generally categorized as unsuitable for drinking, aquatic life and recreational purposes and it is excellent to unsuitable for irrigation depending on the sampling location and the applied indices. Specifically, in WA WQI, rivers were excellent for agricultural uses and Lake Hawassa was good for agricultural uses. However, the CCME WQI findings showed rivers were good for irrigation but lake Hawassa was marginal for agricultural use. Point sources were impaired for all envisioned purposes. The overall category of Lake Hawassa falls under a eutrophic state since the average TSI was 65.4 and the lake is phosphorous-deficient, having TN:TP of 31.1. The monitored point sources indicate that the city of Hawassa and its numerous industrial discharges are key polluters, requiring a fast and consequent set-up of an efficient wastewater infrastructure, accompanied by a rigorous monitoring of large point sources (e.g., industry, hospitals and hotels). In spite of the various efforts, the recovery of Lake Hawassa may take a long time as it is hydrologically closed. Therefore, to ensure safe drinking water supply, a central supply system according to World Health organization (WHO) standards also for the fringe inhabitants still using lake water is imperative. Introducing riparian buffer zones of vegetation and grasses can support the direct pollution alleviation measures and is helpful to reduce the dispersed pollution coming from the population using latrines. Additionally, integrating aeration systems like pumping atmospheric air into the bottom of the lake using solar energy panels or diffusers are effective mitigation measures that will improve the water quality of the lake. In parallel, the implementation and efficiency control of measures requires coordinated environmental monitoring with dedicated development targets.
Keywords: Lake Hawassa water quality; contaminants; eutrophication; monitoring and assessment; point sources; water quality index.
Conflict of interest statement
The authors claim no conflict of interest in connection with the work.
Figures
Similar articles
-
Geospatial and Multi-Index Assessment of Urban Lake Water Quality: Insights Into Pollution Sources and Irrigation Suitability in Udaipur, the Lake City of India.Water Environ Res. 2025 Jun;97(6):e70116. doi: 10.1002/wer.70116. Water Environ Res. 2025. PMID: 40534540
-
Geographical Information System-driven intelligent surface water quality assessment for enhanced drinking and irrigation purposes in Brahmani River, Odisha (India).Environ Monit Assess. 2025 May 6;197(6):629. doi: 10.1007/s10661-025-14065-8. Environ Monit Assess. 2025. PMID: 40327151
-
Assessment of ecohydrogeochemical status of freshwater Loktak Lake of Manipur, India.Environ Monit Assess. 2022 Aug 9;194(9):659. doi: 10.1007/s10661-022-10336-w. Environ Monit Assess. 2022. PMID: 35943636
-
Assessment and management of lake eutrophication: A case study in Lake Erhai, China.Sci Total Environ. 2021 Jan 10;751:141618. doi: 10.1016/j.scitotenv.2020.141618. Epub 2020 Aug 16. Sci Total Environ. 2021. PMID: 33167190 Review.
-
Sources, pathways, and relative risks of contaminants in surface water and groundwater: a perspective prepared for the Walkerton inquiry.J Toxicol Environ Health A. 2002 Jan 11;65(1):1-142. doi: 10.1080/152873902753338572. J Toxicol Environ Health A. 2002. PMID: 11809004 Review.
Cited by
-
Impacts of Stressors on Riparian Health Indicators in the Upper and Lower Indus River Basins in Pakistan.Int J Environ Res Public Health. 2022 Oct 14;19(20):13239. doi: 10.3390/ijerph192013239. Int J Environ Res Public Health. 2022. PMID: 36293824 Free PMC article.
-
Assessment of Water Quality Parameters in Lake Hayq, Northeastern Ethiopia.ScientificWorldJournal. 2024 Sep 4;2024:7439024. doi: 10.1155/2024/7439024. eCollection 2024. ScientificWorldJournal. 2024. PMID: 39263585 Free PMC article.
-
Microbial Profile of Fresh and Semicooked Nile Tilapia (Oreochromis niloticus) and Hygienic Practice of Fish Handlers in Hawassa, Ethiopia.Int J Microbiol. 2023 Nov 14;2023:5866719. doi: 10.1155/2023/5866719. eCollection 2023. Int J Microbiol. 2023. PMID: 38021089 Free PMC article.
-
Assessment of water quality of groundwater, surface water, and wastewater using physicochemical parameters and microbiological indicators.Sci Prog. 2025 Apr-Jun;108(2):368504251348544. doi: 10.1177/00368504251348544. Epub 2025 Jun 18. Sci Prog. 2025. PMID: 40528420 Free PMC article.
-
Evaluation of the water quality of an artificial inter-andean lake in northern Peru.Sci Rep. 2024 Oct 11;14(1):23793. doi: 10.1038/s41598-024-74648-2. Sci Rep. 2024. PMID: 39394221 Free PMC article.
References
-
- Noori R., Sabahi M.S., Karbassi A.R., Baghvand A., Zadeh H.T. Multivariate Statistical Analysis of Surface Water Quality Based on Correlations and Variations in the Data Set. Desalination. 2010;260:129–136. doi: 10.1016/j.desal.2010.04.053. - DOI
-
- Olal F.O. Assessment of the Impact of Urban Runoff from Migori Town on the Concentration Levels of Selected Heavy Metals in Migori. J. Environ. Earth Sci. 2015;5:24–30.
-
- Fan X., Cui B., Zhao H., Zhang Z., Zhang H. Assessment of River Water Quality in Pearl River Delta Using Multivariate Statistical Techniques. Procedia Environ. Sci. 2010;2:1220–1234. doi: 10.1016/j.proenv.2010.10.133. - DOI
-
- Angello Z.A., Behailu B.M., Tränckner J. Selection of Optimum Pollution Load Reduction and Water Quality Improvement Approaches Using Scenario Based Water Quality Modeling in Little Akaki River, Ethiopia. Water. 2021;13:584. doi: 10.3390/w13050584. - DOI
Publication types
MeSH terms
Substances
LinkOut - more resources
Full Text Sources
