Review
. 2021 Aug 26;22(17):9223.
doi: 10.3390/ijms22179223.

Structural Biology-Based Exploration of Subtype-Selective Agonists for Peroxisome Proliferator-Activated Receptors

Affiliations
Review

Structural Biology-Based Exploration of Subtype-Selective Agonists for Peroxisome Proliferator-Activated Receptors

Hiroyuki Miyachi. Int J Mol Sci. .

Abstract

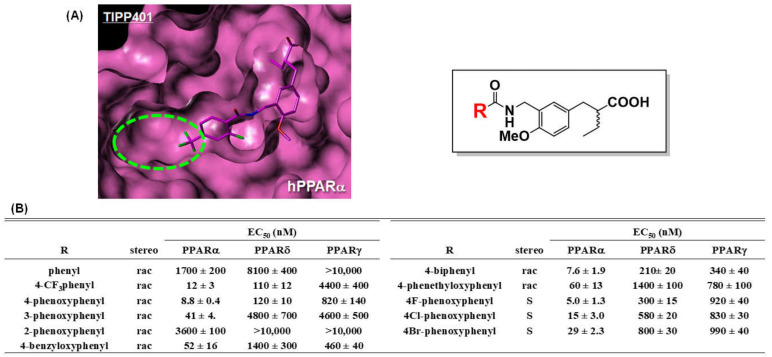
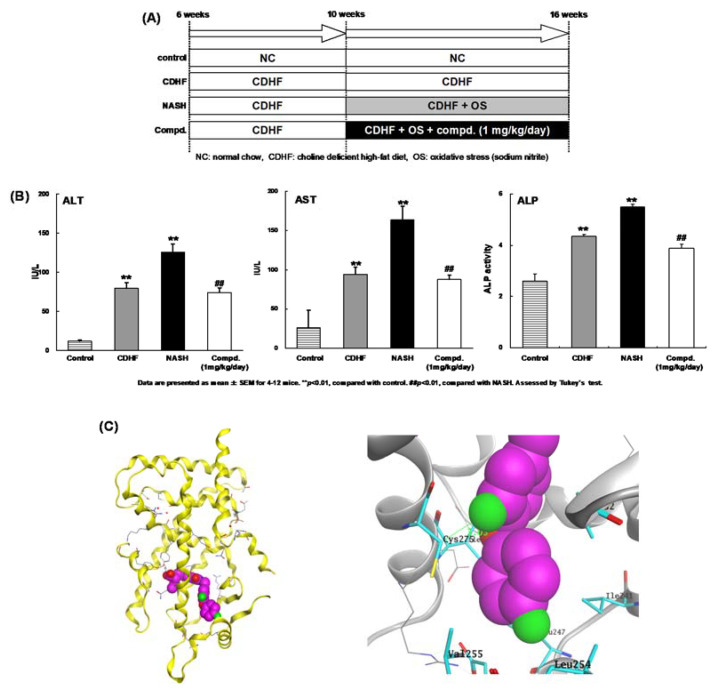
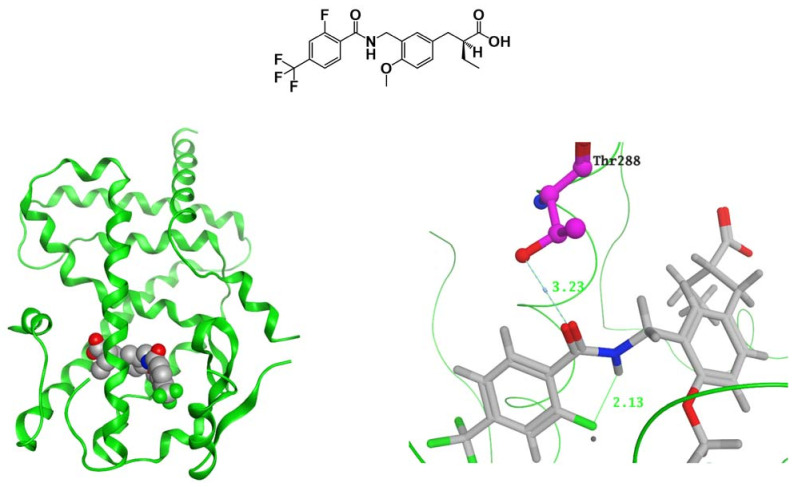
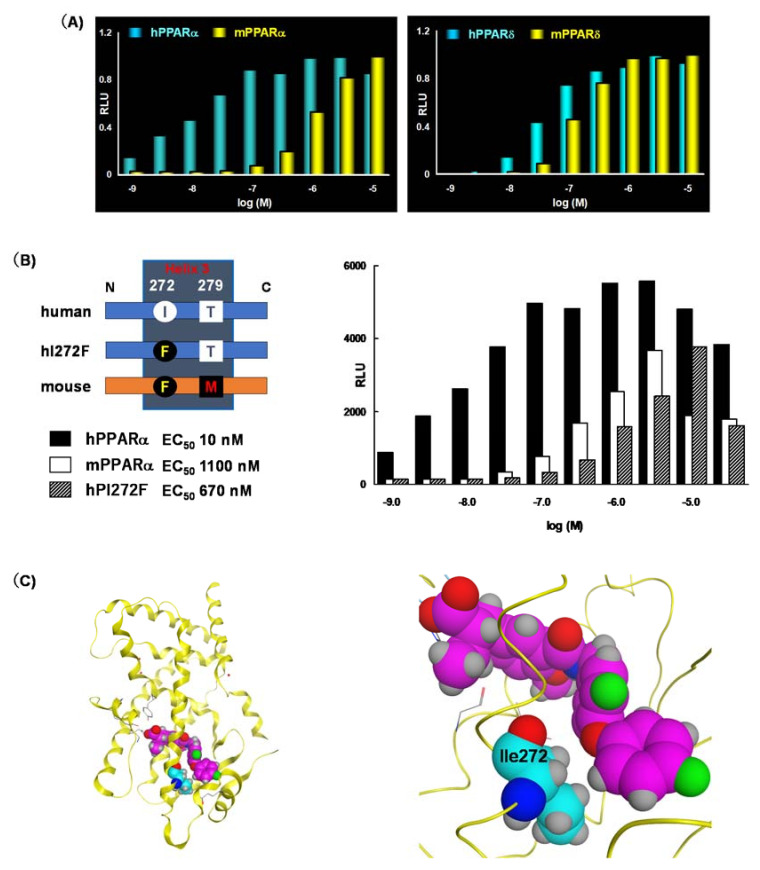
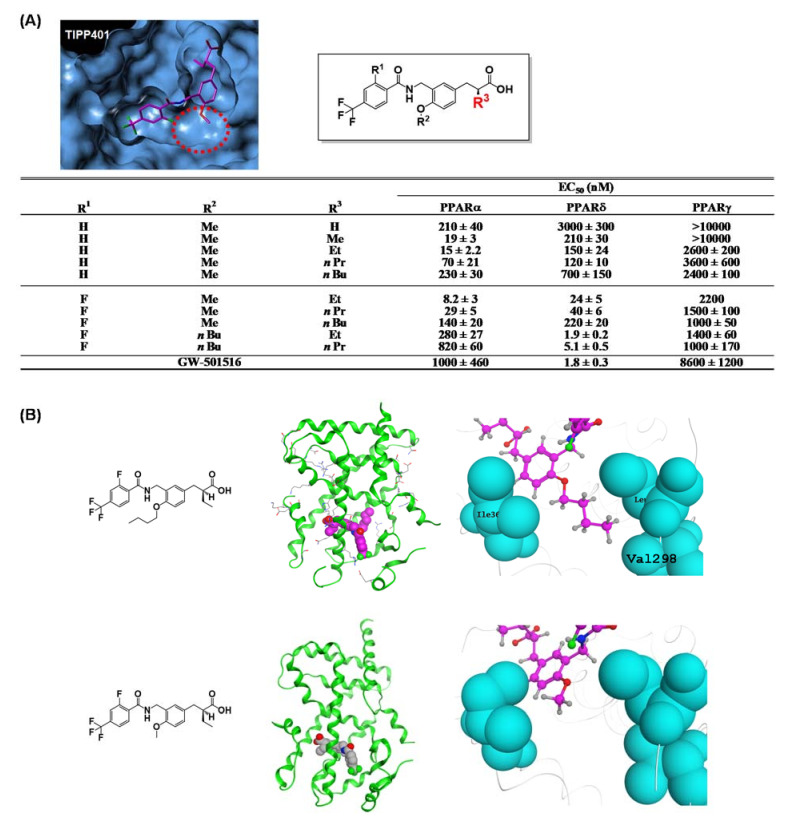
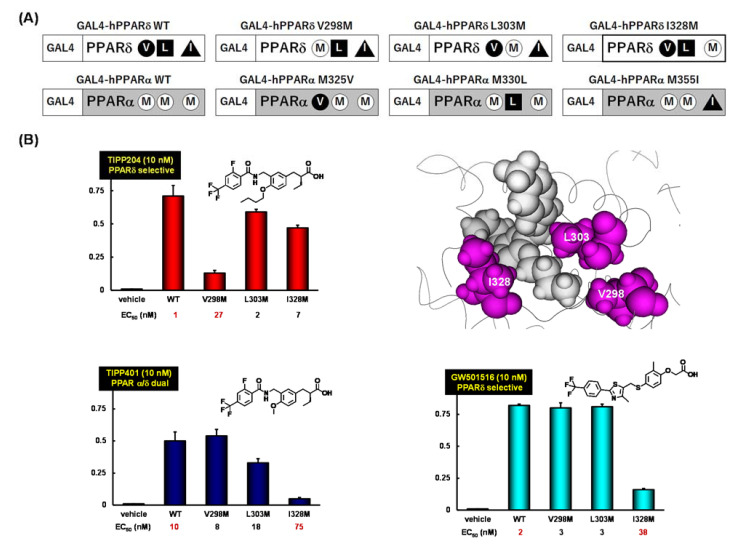
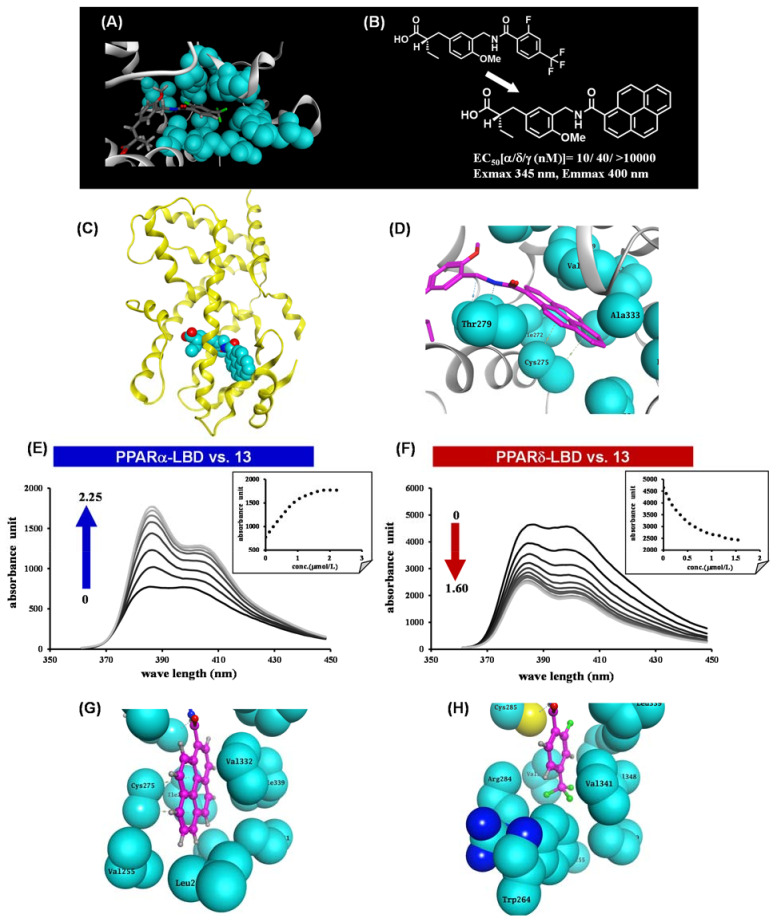
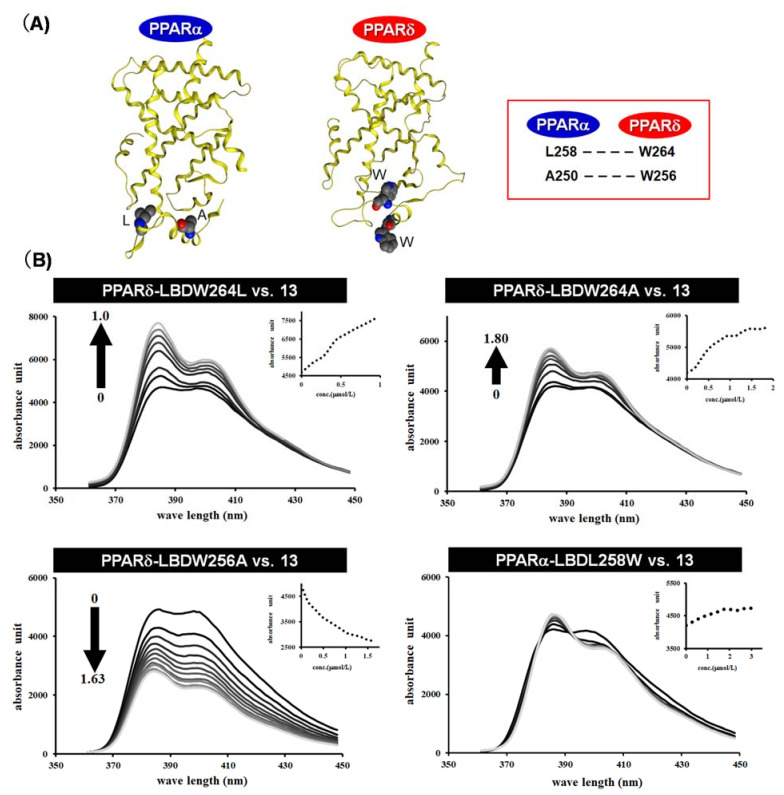
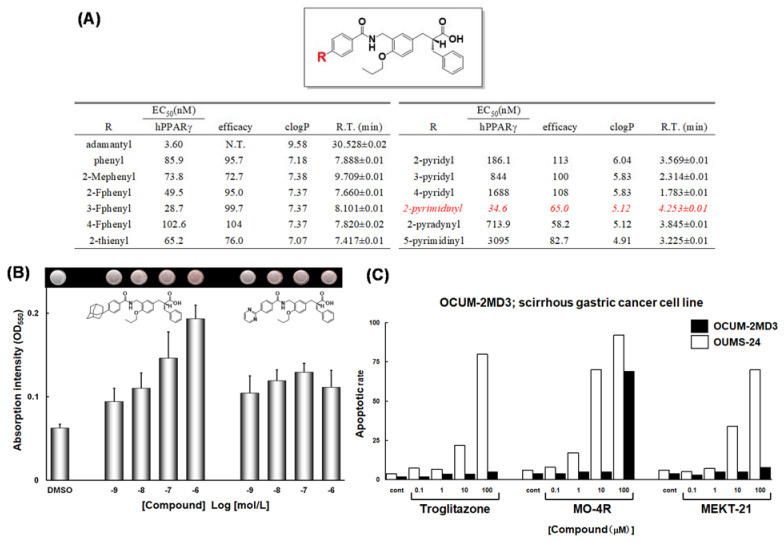
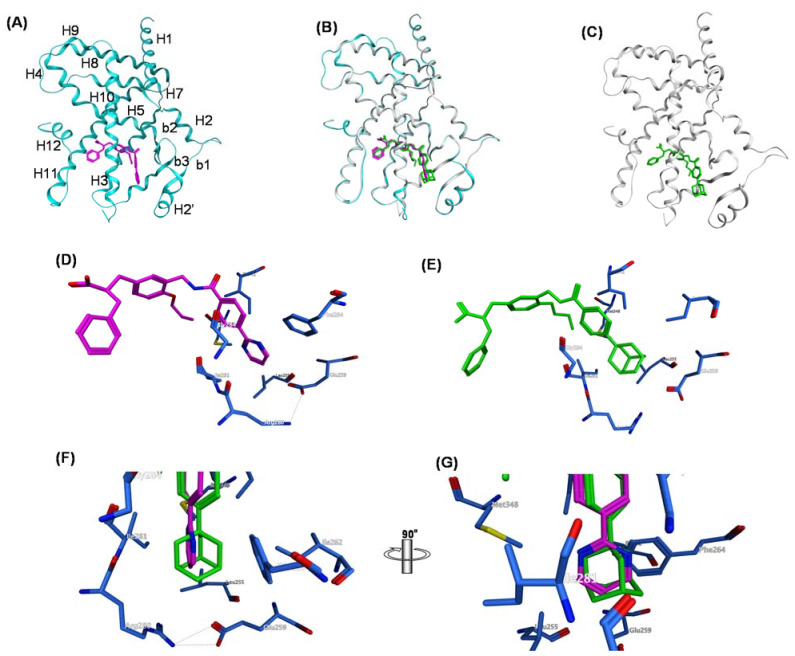
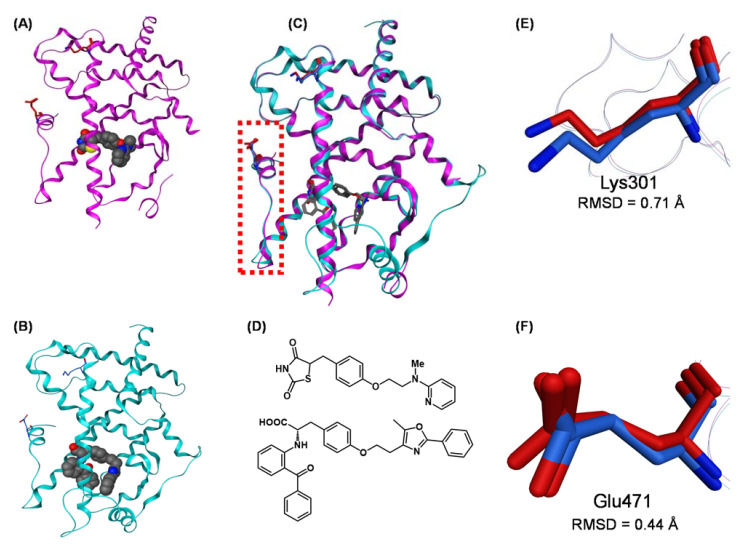
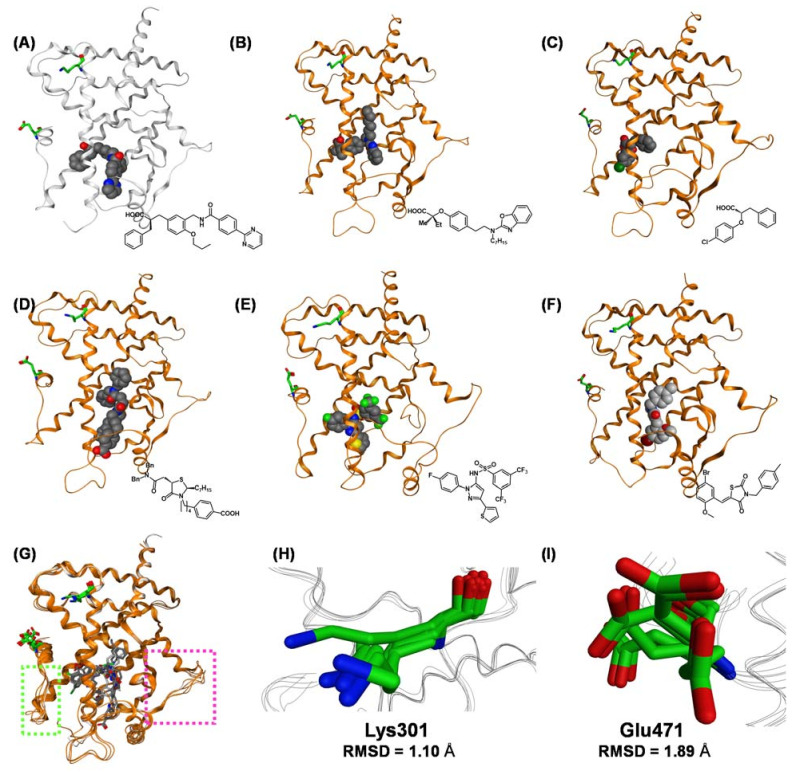
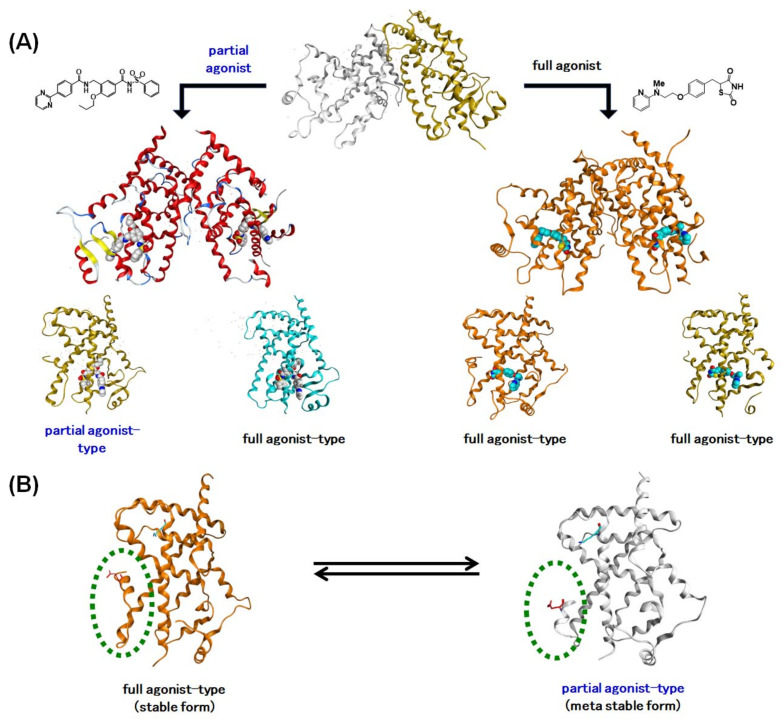
Progress in understanding peroxisome proliferator-activated receptor (PPAR) subtypes as nuclear receptors that have pleiotropic effects on biological responses has enabled the exploration of new subtype-selective PPAR ligands. Such ligands are useful chemical biology/pharmacological tools to investigate the functions of PPARs and are also candidate drugs for the treatment of PPAR-mediated diseases, such as metabolic syndrome, inflammation and cancer. This review summarizes our medicinal chemistry research of more than 20 years on the design, synthesis, and pharmacological evaluation of subtype-selective PPAR agonists, which has been based on two working hypotheses, the ligand superfamily concept and the helix 12 (H12) holding induction concept. X-ray crystallographic analyses of our agonists complexed with each PPAR subtype validate our working hypotheses.

Keywords: PPAR agonist; helix 12 holding induction concept; ligand superfamily concept; peroxisome proliferator-activated receptor; structural biology.


Conflict of interest statement

The author declares no conflict of interest.

Figures

Figure 1
Figure 1
(A) Intact PPARγ–rosiglitazone complex structure. A to F regions are depicted. The position of H12 (helix 12) is indicated with a red dotted circle. (B) Schematic representation of ligand-dependent nuclear receptor activation (PPAR as an example). PPAR forms a heterodimer with another nuclear receptor, RXR in the nucleus.
Figure 2
Figure 2
Structures of PPARγ agonist pioglitazone (1), PPARα agonist fenofibrate (2), and PPARδ agonist GW-501516 (3), and, below, our PPAR agonists.
Figure 3
Figure 3
X-ray-crystallographic structures of our representative PPAR agonists complexed with each PPAR ligand binding domain (LBD).
Scheme 1
Scheme 1
Synthesis routes of the present series of human PPAR agonists.
Figure 4
Figure 4
(A) Molecular modeling structure of TIPP-401 bound to the hPPARα LBD. The binding pocket surrounding the hydrophobic tail is indicated by a light green dotted circle. (B) Transactivation activity of a series of our compounds.
Figure 5
Figure 5
(A) In vivo experiment design. (B) Biochemical markers of hepatobiliary damage. Serum levels of aspartate amino transferase (AST), alanine transaminase (ALT), and alkaline phosphatase (ALP) in the four experimental groups were measured at the end of the study period. Each value represents the mean ± SEM of five rats. ## p < 0.01 versus normal control group, ** p < 0.01 versus choline-deficient high-fat diet fed group (by ANOVA followed by Dunnett’s multiple comparison test). (C) (left) Overall crystal structure of APHM-19 complexed with hPPAR LBD. (right) Zoomed view of the hydrophobic tail of APHM-19.
Figure 6
Figure 6
(Left) Crystal structure of TIPP-401 complexed with the PPARδ LBD. (Right) Zoomed view of the tether region (CONHCH2) of TIPP-401 hydrogen bonded with 288Thr. Predicted mode of binding of the amide derivative and the reversed-amide derivative to PPARδ. Hydrogen bonds are shown as yellow dotted lines.
Figure 7
Figure 7
(A) Dose response activation of human and mouse PPARα and PPARδ by TIPP-401. (B) Transactivation assay using point mutants of the PPARα LBD. (C) (left) Overall crystal structure of APHM-19 complexed with PPARα LBD. (right) Zoomed view of the Ile272 interaction (hydrophobic tail) with APHM-19.
Figure 8
Figure 8
(A) Nuclear receptor cross-reactivity of 0.1 μM, and 1 μM TIPP-401. (B) Regulation of expression of representative PPAR-targeted genes by various PPAR ligands.
Figure 9
Figure 9
(A) Molecular modeling structure of TIPP-401 bound to the PPARδ LBD. The binding pocket surrounding the alkoxy side chain is indicated with a red dotted circle. Transactivation activity of a series of compounds is listed in the table. (B) (left) Overall crystal structure of TIPP-401 and TIPP-204 complexed with the PPARδ LBD. (right) Zoomed view of the alkoxy side chain of TIPP-401 and TIPP-204.
Figure 10
Figure 10
(A) A schematic representation of GAL4-fusion point mutants; (B) Dose responses for transactivation of the GAL4-fusion point mutant constructs with TIPP-204, TIPP-401 and GW-501516.
Figure 11
Figure 11
(A) Zoomed view of the hydrophobic tail of TIPP-401 complexed with the human PPARα LBD. (B) Structural design of APHM-13. (C) X-ray crystallographic structure of APHM-13 complexed with the human PPARα LBD. (D) Zoomed view of the hydrophobic tail of APHM-13 complexed with the human PPARα LBD. (E) Fluorescence polarization value changes with the addition of human PPARα to APHM-13 in PBS. (F) Fluorescence polarization value changes with the addition of human PPARδ to APHM-13 in PBS. (G) Zoomed view of the hydrophobic interaction of the pyrene ring of APHM-13. (H) Zoomed view of the hydrophobic interaction of the 2-fluoro-4-trifluorophenyl ring of TIPP-401.
Figure 12
Figure 12
(A) X-ray crystallographic structure of the human PPARα LBD and human PPARδ LBD. Important amino acids hosting the pyrene moiety are indicated. (B) Fluorescence polarization value changes with the addition of mutated human PPAR to APHM-13 in PBS.
Figure 13
Figure 13
(A) Crystal structures of hPPARδ, hPPARα and hPPARγ LBDs. (B) PPAR agonist activities of a series of compounds. (C) (left) Structure of the whole hPPARγ LBD–TIPP-703 complex. (right) Zoomed view of the amino acids that interact with the hydrophobic tail of TIPP-703 complexed with the hPPARγ LBD. The side chain amino acids and the ligand are depicted with space-filling models.
Figure 14
Figure 14
(A) Changes in the expression of selected genes (CPT1A, HMGCS2, ADRP and ANGPTL4) in Huh-7 cells in response to several PPARs agonists. (B) Induction of adipocyte differentiation by PPAR agonists, MCC-555, rosiglitazone, and TIPP-703.
Figure 15
Figure 15
(A) Expression of PPAR subtypes in PANC-1, and PT-45 cells. (B) Effect of TIPP-703 on the cell cycle of PT-45 cells. (C) Effect of TIPP-703 on the expression of P21, cyclinD1, and p27 in both PANC-1 and PT-45 cells.
Figure 16
Figure 16
(A) Zoomed views of the superposed amino acid residues composing the benzyl group-binding pockets. (left) Superposition of the PPARδ LBD (magenta) and PPARγ LBD (orange). (right) Superposition of the PPARγ LBD (orange) and PPARα LBD (green). Protein backbones are omitted, and the side-chain amino acids are represented as cylinder models. (B) PPAR trancactivation activity for a series of compounds. (C) Zoomed views of the amino acids involved in the interaction of the side chain of the ligands. (left) Zoomed view of the PPARγ LBD-TIPP-703 complex. (right) Zoomed view of the PPARγ LBD-MO-3S complex. Proteins are represented as wireframe models and the amino acids interacting with the side chain ethyl group of TIPP-703 are depicted as yellow cylinders, and the additional interacting amino acid side chains are depicted as green cylinders.
Figure 17
Figure 17
(A) Dose-dependent induction of 3T3-L1 adipocyte differentiation by MO-4R and MO-3S. Data are expressed as the mean with SD (n = 3). (B) Overall crystal structures of hPPARγ LBD-MO-3S (MO-4R) complexes, and zoomed views of the amino acids of the hPPARγ LBD involved in the interaction with the side-chain benzyl group of the ligands. The amino acids and the side-chain benzyl groups are depicted as space filling models in orange (interacting amino acids), magenta (benzyl group of MO-3S), and cyan (benzyl group of MO-4R). The flipped Phe363s are highlighted in green. (C) Zoomed views of the benzyl-binding pocket of hPPARγ LBD-MO-3S and hPPARγ LBD-MO-4R complexes. The four interacting amino acids are indicated.
Figure 18
Figure 18
(A) PPARγ agonist activities of a series of compounds. (B) Adipogenesis-inducing activity of MO-4R and MEKT-21. After pretreatment with 1 l M Dex, 0.5 mM IBMX, and 5 µg/mL insulin, 3T3-L1 cells were incubated with the indicated concentrations of MO-4R and MEKT-21. Oil red O-stained cells are shown at the top and are quantified at the bottom by measurement of OD550 (±SD). (C) Apoptosis-inducing activity of troglitazone, MO-4R and MEKT-21 in OCUM-2MD3 and OUMS-24 cells.
Figure 19
Figure 19
(AG) Crystal structures of hPPARc LBD–MO-4R and hPPARc LBD–MEKT-21 complexes. (A) Structure of the whole hPPARcLBD–MEKT-21 complex. Protein is represented by a blue ribbon model and MEKT-21 is depicted with a magenta cylinder model. The numbering of the second structure is also depicted. The nomenclature of the helices is based on the RXR-α crystal structure. (B) The superimposed structures of MO-4R and MEKT-21 complexed with the hPPARc LBD. (C) Structure of the whole hPPARχ LBD–MO-4R complex. Protein is represented by a white ribbon model and MO-4R is depicted with a green cylinder model. (D) Zoomed view of the binding mode of the hydrophobic tail part of MO-4R in the Y3 arm. The side chains of amino acids of the Y3 arm are depicted by blue cylinder models. (E) Zoomed view of the binding mode of the hydrophobic tail of MEKT-21 in the Y3 arm. (F) Zoomed view of the alignment of the hydrophobic tail of MO-4R and MEKT-21. (G) Image F rotated by 90 degrees.
Figure 20
Figure 20
(A,B) Crystal structures of hPPARχ LBD–rosiglitazone (full agonist) complex (PDB: 2PRG) and hPPARχ LBD–farglitazar (full agonist) complex (PDB: 1FM9). (C) The superimposed structures of hPPARχ LBD–rosiglitazone and hPPARχ LBD–farglitazar complexes. Both ligands are depicted as cylinder models, and Lys301 and Glu473 are highlighted as cylinder models in magenta (rosiglitazone complex) and cyan (farglitazar complex). The N-terminal AF2 region (H12 helix) is highlighted by a light red dotted box. (D) Chemical structures of rosiglitazone and farglitazar. (E) Zoomed view of the superimposed Lys301 of the hPPARχ LBD–rosiglitazone complex and hPPARχ LBD–farglitazar complex. Lys301 is highlighted as a cylinder model in magenta (rosiglitazone complex) or blue (farglitazar). (F) Zoomed view of the superimposed Glu473 of the hPPARχ LBD–rosiglitazone complex and hPPARχ LBD–farglitazar complex. Glu473 is highlighted as a cylinder model in magenta (rosiglitazone complex) or blue (farglitazar). Lys301 residues are highlighted as a green cylinder model.
Figure 21
Figure 21
(AF) Crystal structures of hPPARγ LBD–partial agonist complexes. (A) Crystal structure of the hPPARγ LBD–MEKT-21 complex (PDB: 3VSO). (B) Crystal structure of the hPPARγ LBD–LT127 complex (PDB: 2I4Z). (C) Crystal structure of the hPPARγ LBD–(2S)-2-(4-chlorophenoxy)-3-phenylpropanoic acid complex (PDB: 3CDP). (D) Crystal structure of the hPPAR γ LBD–GW-0072 complex (PDB: 4PRG). (E) Crystal structure of the hPPARγ LBD–N-[1-(4-fluorophenyl)-3-(2-thenyl)-1H-pyrazole-5-yl]-3,5-bis(trifluoromethyl)benzenesulfonamide complex (PDB: 2GOH). (F) Crystal structure of the hPPARγ LBD–GQ-16 complex (PDB: 3T03). (G) The superimposed structures of hPPARγ LBD–partial agonist complexes. All ligands are depicted as cylinder models, and Lys301 and Glu471 are highlighted as green cylinder models. The N-terminal AF2 region (H12 helix) is highlighted with a light green dotted box. (H) Zoomed view of the superimposed Lys301 of hPPARγ LBD–partial agonist complexes. (I) Zoomed view of the superimposed Glu471 of hPPARγ LBD–partial agonist complexes.
Figure 22
Figure 22
(AC) Zoomed views of the binding mode of the AF2 region (H12 helix) of hPPARγ LBD–rosiglitazone. (A) Zoomed view of the hPPARγ LBD–rosiglitazone (full agonist) complex. (B) Zoomed view of the hPPARγ LBD–MEKT-21 (partial agonist) complex. (C) Zoomed view of the hPPARγ LBD–N-[1-(4-fluorophenyl)-3-(2-thenyl)-1H-pyrazole-5-yl]-3,5-bis(trifluoromethyl)benzenesulfonamide (partial agonist) complex. (DF) Chemical structures of these agonists. (D) rosiglitazone, (E) MEKT-21, and (F) N-[1-(4-fluorophenyl)-3-(2-thenyl)-1H-pyrazole-5-yl]-3,5-bis(trifluoromethyl)benzenesulfonamide.
Figure 23
Figure 23
(A) Structural development of a hPPARγ-selective partial agonist from a hPPARγ pan agonist. (B) (left) Transactivation activity of MEKT-75, pioglitazone (pio) and rosiglitazone (ros). (right) Adipocyte differentiation assay of TIPP-703, MEKT-21 and MEKT-75. Homo-dimeric structure of MEKT-75 complexed with the hPPARγ LBD.
Figure 24
Figure 24
(A) Structural development of a hPPARγ-selective partial agonist from a hPPARγ pan agonist. (BE) X-ray crystallographic structure of the homo-dimeric structure of MEKT-75 complexed with the hPPARγ LBD. (B) Homo-dimeric structure of MEKT-75 complexed with the hPPARγ LBD. (C) Full agonist form monomer. (D) Partial agonist form monomer. (E) Superposed structure of the homo-dimeric structure of MEKT-75 complexed with the hPPARγ LBD. MEKT-75 was omitted. (F) Superposed structure of the partial agonist form MEKT-75 monomer and the TIPP-703 monomer complexed with the hPPARγ LBD. (G) Partial agonist form MEKT-75 monomer. (H) Overall structure of TIPP-703 complexed with the hPPARγ LBD. (I) Superposed structure of the full agonist form MEKT-75 monomer and the TIPP-703 monomer complexed with the hPPARγ LBD. (J) Partial agonist form MEKT-75 monomer. (K) Overall structure of TIPP-703 complexed with the hPPARγ LBD. (K,L) (left) Zoomed view of the fully active form of MEKT-75. (right) Zoomed view of the non-fully active form of MEKT-75.
Figure 25
Figure 25
(A) X-ray crystallographic structure of homo-dimeric PDB: 2PRG (full agonist). (B) X-ray crystallographic structure of homo-dimeric PDB: 2Q6R (partial agonist). (C) X-ray crystallographic structure of homo-dimeric PDB: 2I4Z (partial agonist). (D) X-ray crystallographic structure of homo-dimeric PDB: 2Q5S (partial agonist).
Figure 26
Figure 26
(A) Schematic representation of complexation of PPARγ agonists with the apo-type PPARγ homodimer. Full agonists induce structural change of the non-fully active hPPARγ LBD to the fully active LBD, presumably by facilitating a tight hydrogen bond network with the LBD, especially to the C-terminal region (H12). hPPARγ partial agonists lack the ability to induce the fully active LBD. (B) Schematic representation of the dynamic equivalence between the full agonist form of the hPPARγ LBD and the partial agonist form of the hPPARγ LBD.
Figure 27
Figure 27
Structure–activity relationship summary of the present series of compounds.

References

    1. Chawta A., Repa J.J., Evans R.M., Mangelsdorf D.J. Nuclear receptors and lipid physiology: Opening the x-files. Science. 2001;294:1866–1870. - PubMed
    1. Banner C.D., Gottlicher M., Widmark E., Sjovall J., Rafter J.J., Gustafsson J.A. A systematic analytical chemistry/cell assay approach to isolate activators of orphan nuclear receptors from biological extracts: Characterization of peroxisome proliferator-activated receptor activators in plasma. J. Lipid Res. 1993;34:1583–1591. doi: 10.1016/S0022-2275(20)36951-0. - DOI - PubMed
    1. Wagner K.D., Wagner N. Peroxisome proliferator-activated receptor β/δ (PPARβ/δ) acts as regulator of metabolism linked to multiple cellular functions. Pharmacol. Ther. 2010;125:423–435. doi: 10.1016/j.pharmthera.2009.12.001. - DOI - PubMed
    1. Keller H., Dreyer C., Medin J., Mahfoudi A., Ozato K., Wahli W. Fatty acids and retinoids control lipid metabolism through activation of peroxisome proliferator-activated receptor-retinoid X receptor heterodimers. Proc. Natl. Acad. Sci. USA. 1993;90:2160–2164. doi: 10.1073/pnas.90.6.2160. - DOI - PMC - PubMed
    1. Staels B., Auwerx J. Role of PPAR in the pharmacological regulation of lipoprotein metabolism by fibrates and thiazolidinediones. Curr. Pharm. Des. 1997;3:1–14.

LinkOut - more resources