. 2021 Aug 26;22(17):9243.
doi: 10.3390/ijms22179243.

Eugenol-Induced Autophagy and Apoptosis in Breast Cancer Cells via PI3K/AKT/FOXO3a Pathway Inhibition

Affiliations

Eugenol-Induced Autophagy and Apoptosis in Breast Cancer Cells via PI3K/AKT/FOXO3a Pathway Inhibition

Mashan L Abdullah et al. Int J Mol Sci. .

Abstract

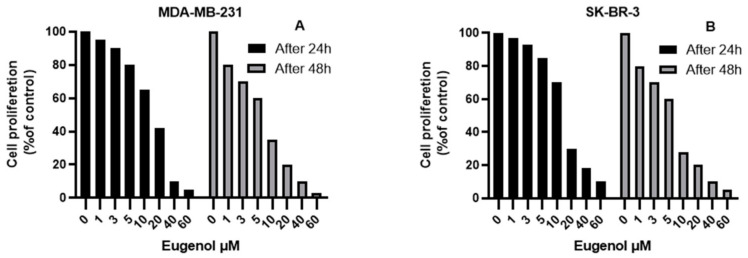
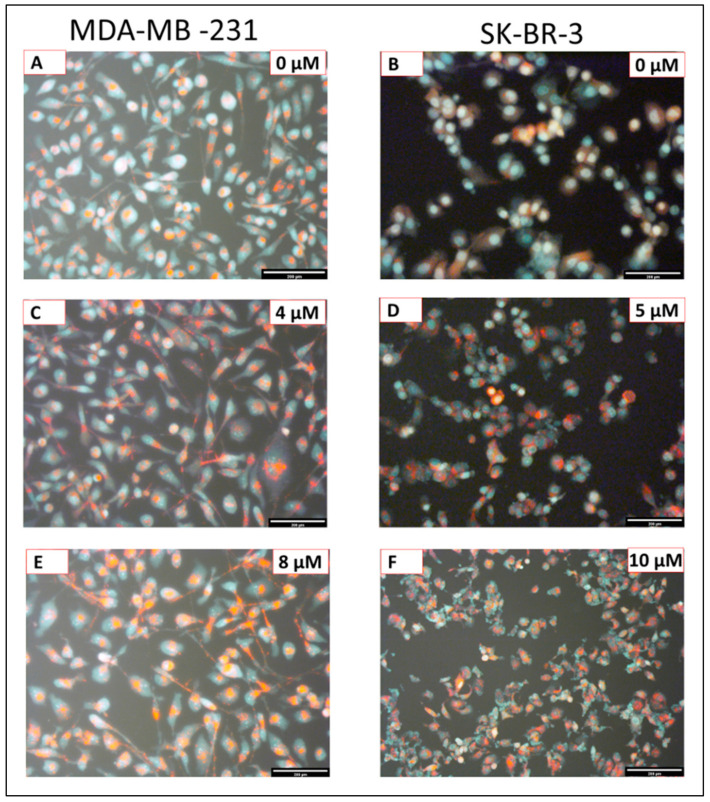
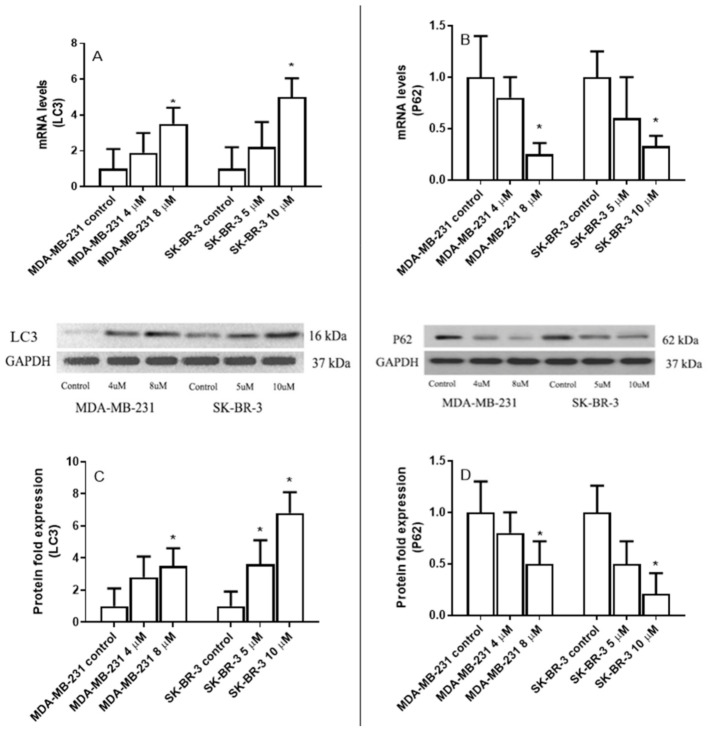
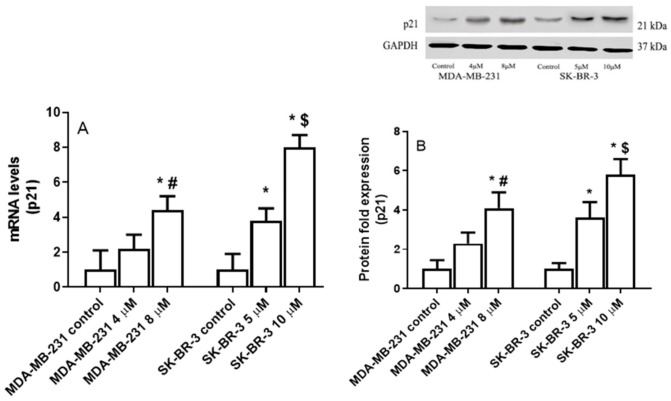
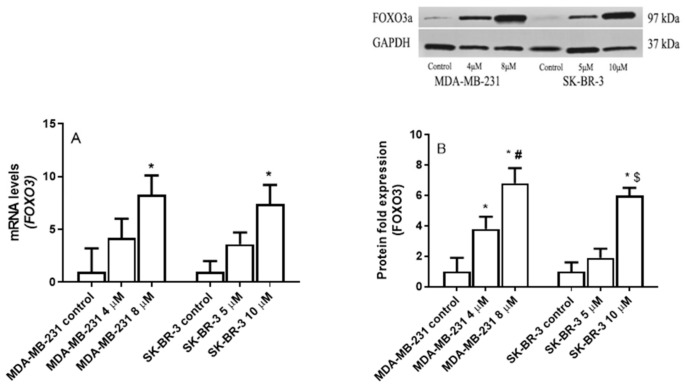
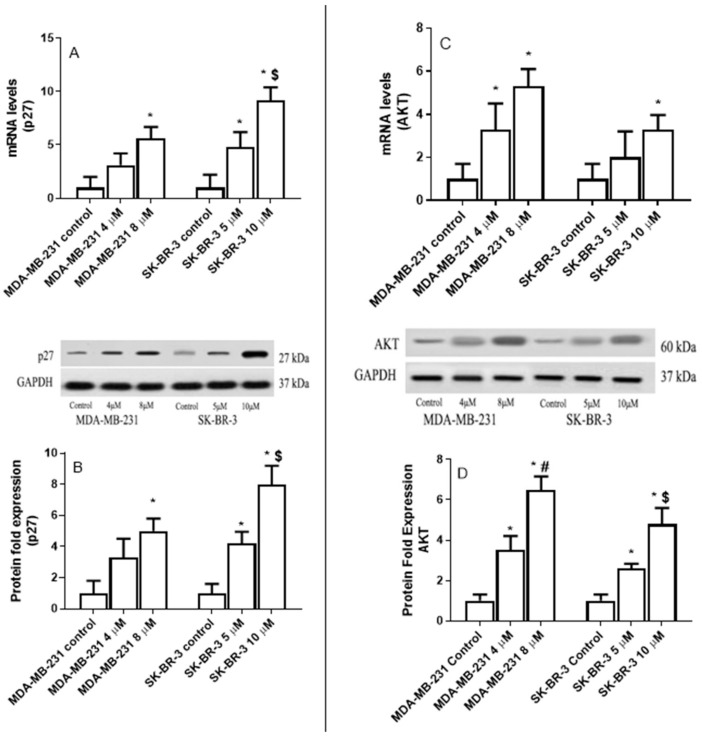
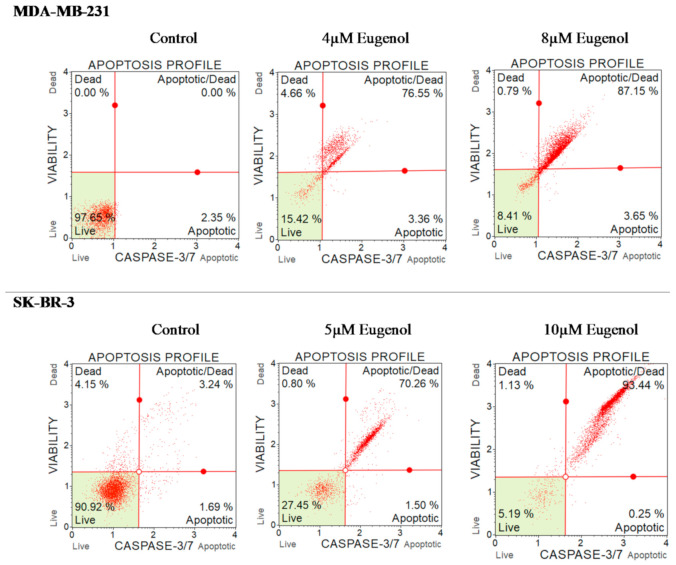
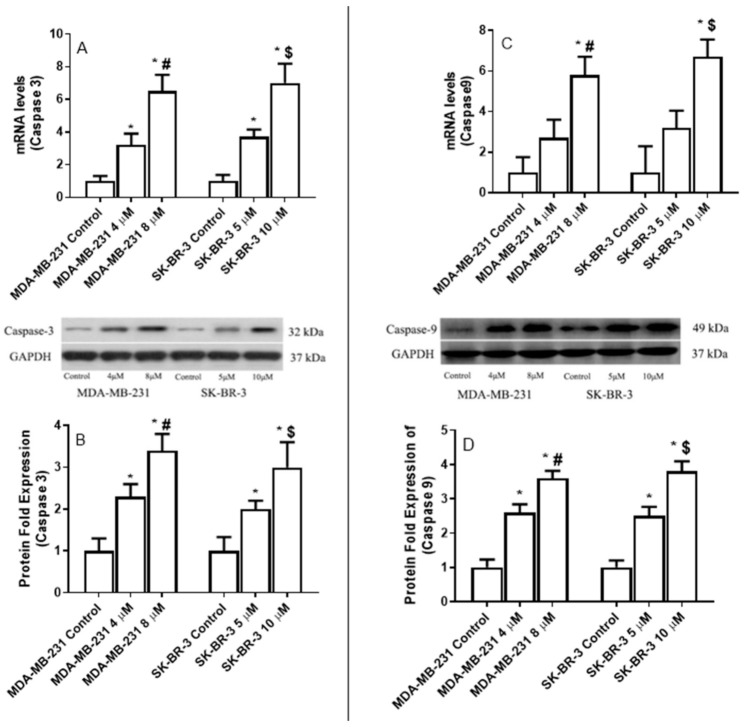
The use of natural compounds is promising in approaches to prevent and treat cancer. The long-term application of most currently employed chemotherapy techniques has toxic side effects. Eugenol, a phenolic phytochemical extracted from certain essential oils, has an anti-cancer effect. The modulation of autophagy can promote either the survival or apoptosis of cancer cells. Triple-negative (MDA-MB-231) and HER2 positive (SK-BR-3) breast cancer cell lines were treated with different doses of eugenol. Apoptosis was detected by a flow-cytometry technique, while autophagy was detected by acridine orange. Real-time PCR and Western blot assays were applied to investigate the effect of eugenol on the gene and protein expression levels of autophagy and apoptotic genes. Treating cells with different concentrations of eugenol significantly inhibited cell proliferation. The protein levels of AKT serine/threonine kinase 1 (AKT), forkhead box O3 (FOXO3a), cyclin dependent kinase inhibitor 1A (p21), cyclin-dependent kinase inhibitor (p27), and Caspase-3 and -9 increased significantly in Eugenol-treated cells. Eugenol also induced autophagy by upregulating the expression levels of microtubule-associated protein 1 light chain 3 (LC3) and downregulating the expression of nucleoporin 62 (NU p62). Eugenol is a promising natural anti-cancer agent against triple-negative and HER2-positive breast cancer. It appears to work by targeting the caspase pathway and by inducing autophagic cell death.

Keywords: PI3K/AKT/FOXO3a pathway; autophagy; eugenol; triple negative breast cancer.


Conflict of interest statement

The authors declare no conflict of interest.

Figures

Figure 1
Figure 1
The effect of eugenol on MDA-MB-231 (A) and SK-BR-3 (B) cell viability using the MTT assay (values represent % of the control).
Figure 2
Figure 2
Population doubling times (PDTs) of MDA-MB-231 and SK-BR-3 cells treated with different concentrations of eugenol. The cells were seeded (2 × 10⁵ cells/well) in an E-16 plate and continuously observed for 72 h, during which time the cell index values were measured. Cell proliferation was observed at 15-min intervals. Each data point signifies an average value ± SD. All cells were analyzed in triplicate. *, #, $, and & indicate significant changes when compared to the control condition when 4 μM, 8 μM, and 5 μM of eugenol were applied, respectively (p < 0.05).
Figure 3
Figure 3
Fluorescence images of MDA-MB-231 and SK-BR-3 cells exposed to different eugenol concentrations stained with Acridine Orange (AO) under blue light excitation: untreated MDA-MB-231 (A) and SK-BR-3 (B) cells; MDA-MB-231 (C) and SK-BR-3 (D) cells treated with 4 μM and 5 μM eugenol for 24 h, respectively; MDA-MB-231 (E) and SK-BR-3 (F) cells treated with 8 μM and 10 μM eugenol for 24 h, respectively. Red fluorescence indicated autophagic vacuoles, while green fluorescence indicates the presence of nuclei. Magnification: ×10; scale bar: 200 μm.
Figure 4
Figure 4
The effect of eugenol treatment on LC3 and p62 mRNA and protein expression levels. MDA-MB231 and SK-BR-3 cells were treated for 24 h (A,B). Thereafter, LC3 and p62 mRNA expression levels were quantified by RT-PCR. The protein expression levels of LC3 and p62 were then assessed in MDA-MB231 and SK-BR3 cells treated for 24 h with 0, 4, and 8 μM and 0, 5, and 10 μM eugenol, respectively (C,D). * indicates a significant change compared to untreated cells (0 μM) at p < 0.05 based on a one-way ANOVA and the Tukey–Kramer post-ANOVA test.
Figure 5
Figure 5
The effect of eugenol treatment on P21 mRNA and protein expression levels. (A) MDA-MB231 and SK-BR-3 cells were treated for 24 h. Thereafter, P21 mRNA expression levels were quantified by RT-PCR. (B) MDA-MB231 and SK-BR3 cells were treated for 24 h with eugenol 0, 4, and 8 μM and 0, 5, and 10 μM eugenol, respectively. Thereafter, P21 protein expression levels were determined by Western blot analysis. * indicates significant change from untreated cells, # indicates significant difference from MDA-MB-231 at eugenol concentration 4 μM, and $ indicates significant difference from SK-BR-3 treated with 10 μM eugenol at p < 0.05 based on a one-way ANOVA and the Tukey–Kramer post-ANOVA test.
Figure 6
Figure 6
The effect of eugenol treatment on FOXO3 mRNA and protein levels. (A) MDA-MB231 and SK-BR-3 cells were treated for 24 h with eugenol; thereafter, FOXO3a mRNA expression levels were quantified by RT-PCR. (B) MDA-MB231 and SK-BR3 cells were treated for 24 h with 0, 4, and 8 μM and 0, 5, and 10 μM eugenol, respectively. Thereafter, FOXO3a protein expression levels were determined by Western blot analysis. One of the three representative experiments is shown. * indicates significant difference from untreated cells, # indicates significant difference from MDA-MB-231 at eugenol concentration 4 μM, and $ indicates significant difference from SK-BR-3 treated with 10 μM eugenol at p < 0.05 using ANOVA followed by Tukey–Kramer post-ANOVA test.
Figure 7
Figure 7
The effect of eugenol treatment on p27 and AKT mRNA and protein expression levels. MDA-MB231 and SK-BR-3 cells were treated for 24 h (A,B). Thereafter, p27 and AKT mRNA expression levels were quantified by RT-PCR. The protein expression levels of p27 and AKT were then assessed in MDA-MB231 and SK-BR3 cells treated for 24 h with eugenol 0, 4, and 8 μM and 0, 5, and 10 μM eugenol, respectively (C,D). * indicates a significant change compared to untreated cells (0 μM), # indicates a significant change from MDA-MB-231 at eugenol concentration 4 μM, and $ indicates significant change from SK-BR-3 treated with 10 μM eugenol at p < 0.05 based on a one-way ANOVA and the Tukey–Kramer post-ANOVA test.
Figure 8
Figure 8
Effect of eugenol treatment on the percentage of apoptosis and caspase-3/7 in MDA-MB-231 and SK-BR-3 cells. Cells were treated for 24 h with eugenol (4 and 8 μM and 5 and 10 μM, respectively). The percentage of cells undergoing apoptosis was determined using a caspase-3/7 assay. Cells were immediately analyzed on the Muse™ Cell Analyzer (Merck KGaA Co., Darmstadt, Germany).
Figure 9
Figure 9
The effect of eugenol treatment on caspase-3 and caspase-9 mRNA and protein expression levels. MDA-MB231 and SK-BR-3 cells were treated for 24 h (A,B). Thereafter, caspase-3 and caspase-9 mRNA expression levels were quantified by RT-PCR. The protein expression levels of caspase-3 and caspase-9 were then assessed in MDA-MB231 and SK-BR3 cells treated for 24 h with 0, 4, and 8 μM and 0, 5, and 10 μM eugenol, respectively (C,D). * indicates a significant change compared to untreated cells (0 μM), # indicates a significant change from MDA-MB-231 at eugenol concentration 4 μM, and $ indicates significant changes from SK-BR-3 treated with 10 μM eugenol at p < 0.05 based on a one-way ANOVA and the Tukey–Kramer post-ANOVA test.

References

    1. Becker S. A historic and scientific review of breast cancer: The next global healthcare challenge. Int. J. Gynecol. Obstet. 2015;131:S36–S39. doi: 10.1016/j.ijgo.2015.03.015. - DOI - PubMed
    1. Maayah Z.H., Ghebeh H., Alhaider A.A., El-Kadi A.O., Soshilov A.A., Denison M.S., Ansari M.A., Korashy H.M. Metformin inhibits 7,12-dimethylbenz[a]anthracene-induced breast carcinogenesis and adduct formation in human breast cells by inhibiting the cytochrome P4501A1/aryl hydrocarbon receptor signaling pathway. Toxicol. Appl. Pharmacol. 2015;284:217–226. doi: 10.1016/j.taap.2015.02.007. - DOI - PubMed
    1. Rychlý B., Sidlová H., Daniś D. The 2007 World Health Organisation classification of tumours of the central nervous system, comparison with 2000 classification. Ceskoslovenska Patol. 2008;44:35–36. - PubMed
    1. Yersal O., Barutca S. Biological subtypes of breast cancer: Prognostic and therapeutic implications. World J. Clin. Oncol. 2014;5:412–424. doi: 10.5306/wjco.v5.i3.412. - DOI - PMC - PubMed
    1. Korlimarla A., Prabhu J.S., Remacle J., Rajarajan S., Raja U., Anupama C.E., Srinath B.S., Manjunath S., Gopinath K.S., Correa M., et al. Identification of BRCA1 Deficiency Using Multi-Analyte Estimation of BRCA1 and Its Repressors in FFPE Tumor Samples from Patients with Triple Negative Breast Cancer. PLoS ONE. 2016;11:e0153113. doi: 10.1371/journal.pone.0153113. - DOI - PMC - PubMed

MeSH terms