. 2021 Aug 29;22(17):9379.
doi: 10.3390/ijms22179379.

ZFP36L2 Role in Thyroid Functionality

Affiliations

ZFP36L2 Role in Thyroid Functionality

Francesco Albano et al. Int J Mol Sci. .

Abstract

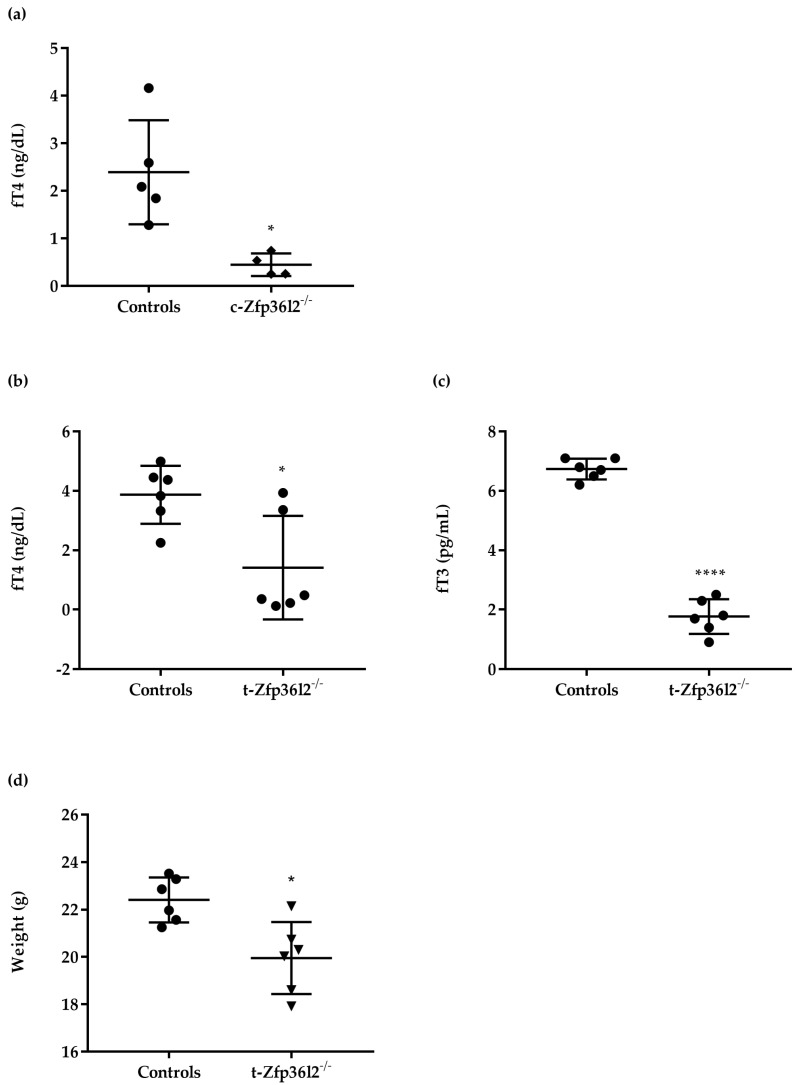
Thyroid hormone levels are usually genetically determined. Thyrocytes produce a unique set of enzymes that are dedicated to thyroid hormone synthesis. While thyroid transcriptional regulation is well-characterized, post-transcriptional mechanisms have been less investigated. Here, we describe the involvement of ZFP36L2, a protein that stimulates degradation of target mRNAs, in thyroid development and function, by in vivo and in vitro gene targeting in thyrocytes. Thyroid-specific Zfp36l2-/- females were hypothyroid, with reduced levels of circulating free Thyroxine (cfT4) and Triiodothyronine (cfT3). Their hypothyroidism was due to dyshormonogenesis, already evident one week after weaning, while thyroid development appeared normal. We observed decreases in several thyroid-specific transcripts and proteins, such as Nis and its transcriptional regulators (Pax8 and Nkx2.1), and increased apoptosis in Zfp36l2-/- thyroids. Nis, Pax8, and Nkx2.1 mRNAs were also reduced in Zfp36l2 knock-out thyrocytes in vitro (L2KO), in which we confirmed the increased apoptosis. Finally, in L2KO cells, we showed an altered response to TSH stimulation regarding both thyroid-specific gene expression and cell proliferation and survival. This result was supported by increases in P21/WAF1 and p-P38MAPK levels. Mechanistically, we confirmed Notch1 as a target of ZFP36L2 in the thyroid since its levels were increased in both in vitro and in vivo models. In both models, the levels of Id4 mRNA, a potential inhibitor of Pax8 activity, were increased. Overall, the data indicate that the regulation of mRNA stability by ZFP36L2 is a mechanism that controls the function and survival of thyrocytes.

Keywords: Nis; Notch1; RNA stability; Zfp36l2 KO; apoptosis; hypothyroidism.


Conflict of interest statement

The authors declare no conflict of interest.

Figures

Figure 1
Figure 1
Phenotype of constitutive and thyroid-specific Zfp36l2-/- mice. The levels of cfT4 were determined by ELISA in blood collected from the controls (n = 5) and conventional Zfp36l2-/- (Zfp36l2-/- n = 4) female mice at PND 21 (a). The levels of cfT4 (b) and cfT3 (c) were determined by ELISA in blood collected from controls (n = 6) and t−Zfp36l2-/- (n = 6) female mice at the PND 90. Body weight evaluation of the t−Zfp36l2-/- mice measurements were collected at PND 90 (d). Data are reported as mean ± standard deviation * p < 0.05; **** p < 0.0001.
Figure 2
Figure 2
Molecular validation of the t−Zfp36l2-/- mice. Analysis of (a) Zfp36l2 mRNA by RTqPCR and (b) protein by Western blotting was conducted on extracts from thyroid samples of the control (n = 3) and t−Zfp36l2-/- (n = 3) mice. RTqPCR data are reported as mean ± standard deviation of ∆∆Ct values (FC values of gene normalized vs. FC values of 18SrRNA to obtain ∆Ct values of samples; ∆Ct values of KO samples are then normalized vs. ∆Ct of Control samples to obtain ∆∆Ct values) in KO (n = 3) and control mice (n = 3); ** p < 0.01.
Figure 3
Figure 3
Analysis of apoptosis in control (n = 3) and t−Zfp36l2-/- mice (n = 3). 10X magnification images of DAPI staining of thyroid samples from controls (a) and t−Zfp36l2-/- mice (d); nuclei positive Tunel staining in controls (b) and t−Zfp36l2-/- mice (e). The merge of the previous images is shown in (c) for controls and (f) for t−Zfp36l2-/- mice. RTqPCR in extracts from thyroid samples was conducted to determine the levels of Bax and Bcl2 mRNAs. The Bax/Bcl2 transcript ratios in control (n = 3) and t−Zfp36l2-/- mice (n = 3) (g). RTqPCR Bax/Bcl2 ratio between mean and standard deviation of Bax and Bcl2 ∆Ct values (FC values of each gene vs. FC of 18SrRNA), in KO (n = 3) and control mice (n = 3); * p < 0.05.
Figure 4
Figure 4
Analysis of thyroid-specific gene expression and protein levels in control and t-Zfp36l2-/- mice. (a) RTqPCR analysis of the expression of the thyroid-specific/enriched transcripts. (b) Western blotting analysis of NIS and PAX8 in extracts from thyroid samples of control (n = 3) and t−Zfp36l2-/- (n = 3) mice. In the Pax8 panel, arrowheads point to the specific band of Pax8; ns indicates non-specific bands. RTqPCR data are reported as mean ± standard deviation of ∆∆Ct values (FC values of gene normalized vs. FC values of 18SrRNA to obtain ∆Ct values of samples; ∆Ct values of KO samples are then normalized vs. ∆Ct of control samples to obtain ∆∆Ct values) in KO (n = 3) and control mice (n = 3); **** p < 0.0001.
Figure 5
Figure 5
Analysis of the recombinant cell line FRTL5 Zfp36l2 KO. Cells were generated as detailed in M&M by transducing them with lenticrispV2 empty (EV) or carrying a specific gRNA sequence targeting the Zfp36l2 rat gene (L2KO). RTqPCR analysis (a) and Western blot (b) were conducted to control the knock-out efficiency both in the bulk culture and in one of the selected clones. (c) Cell growth of the L2KO cells, bulk culture and clone, and EV were monitored by MTT assay during 7 days of culture in normal medium. RTqPCR analysis of P21 mRNA (d), Bax/Bcl2 ratio of the L2KO cells, bulk culture, and clone, vs. EV (e). RTqPCR data are reported as mean ± standard deviation of ∆∆Ct values (FC values of gene normalized vs. FC values of 18SrRNA to obtain ∆Ct values of samples; ∆Ct values of KO samples are then normalized vs. ∆Ct of control samples to obtain ∆∆Ct values) in KO (n = 3) and controls (n = 3). RTqPCR Bax/Bcl2 ratio between mean and standard deviation of Bax and Bcl2 ∆Ct values (FC values of each gene vs FC of 18SrRNA), in KO (n = 3) and controls (n = 3). * p < 0.05; ** p < 0.005; *** p < 0.001; **** p < 0.0001.
Figure 6
Figure 6
Analysis of thyroid-specific/enriched genes. Gene expression (a) or protein (bd) in L2KO and bulk culture vs. EV cells. ZFP36L1 levels were also tested by Western blotting (e). RTqPCR data are reported as mean ± standard deviation of ∆∆Ct values (FC values of gene normalized vs. FC values of 18SrRNA to obtain ∆Ct values of samples; ∆Ct values of KO samples are then normalized vs. ∆Ct of control samples to obtain ∆∆Ct values) in KO (n = 3) and controls (n = 3). * p < 0.05; ** p < 0.005.
Figure 7
Figure 7
Characterization of the time-dependent response to TSH in L2KO and EV cells. Cells were TSH-starved and then stimulated for the reported time as detailed in M&M. (a) Western blotting analysis of ZFP36L2, ZFP36, L1, and NIS. (b) Analysis of the phosphorylation of ZFP36L2 after TSH induction and Calf Intestinal Phosphatase (CIP) treatment of the whole cell lysate. Absence of the ZFP36L2 signal after CIP treatment demonstrates that TSH induced protein phosphorylation. (c) Cell counting conducted on detached cells stained with trypan blue. The indicated time points on the - axis are, 0, number of cells at seeding time; 5H, number of cells after 3 days starvation; TSH 24 h, number of cells after 24 h of stimulation with TSH 1 mU/mL; TSH 48 h, number of cells after 48 h of stimulation with TSH 1 mU/mL. (d) Analysis of the cell cycle was conducted by FACS analysis using Propidium Iodide staining on cells stimulated with TSH for 24 h or 48 h. (e) Western blot analysis of P21, P38-MAPK, and (f) ERK 1/2-MAPK. The activation status of the last two is reported (p-P38 and p-ERK). Trypan blue exclusion cell counts and FACS data reported as mean ± standard deviation of 3 independent experiments. * p < 0.05; ** p < 0.01; *** p < 0.001.
Figure 8
Figure 8
Modulation of Notch1 pathways in t-Zfp36l2-/- mice and L2KO cells. (a) RTqPCR analysis of Notch1 expression in L2KO and EV cells and (b) RTqPCR analysis of Notch1 expression and its modulation by TSH signaling in L2KO and EV cells; 5H, cell culture medium deprived from TSH; 24 h and 48 h, time points of TSH signalling induction using complete cell culture medium. (c) RTqPCR analysis of Notch1 expression in thyroid extracts from t−Zfp36l2-/- (n = 3) and control (n = 3) mice. (d) Western blotting analysis of HES1 in extracts from thyroid samples of t−Zfp36l2-/- (n = 3) and control mice (n = 3). (e) RTqPCR analysis of Id4 mRNA in L2KO and EV cells, (f) thyroid extracts from t−Zfp36l2-/- (n = 3) and control (n = 3) mice. RTqPCR data are reported as mean ± standard deviation of ∆∆Ct values (FC values of gene normalized vs. FC values of 18SrRNA to obtain ∆Ct values of samples; ∆Ct values of KO samples are normalized vs. ∆Ct of control samples to obtain ∆∆Ct values) in KO (n = 3) and controls (n = 3); *p < 0.05; ** p < 0.01; *** p < 0.001; **** p < 0.0001.

References

    1. Szinnai G. Clinical genetics of congenital hypothyroidism. Endocr. Dev. 2014;26:60–78. doi: 10.1159/000363156. - DOI - PubMed
    1. Biebermann H., Gruters A., Schoneberg T., Gudermann T. Congenital hypothyroidism caused by mutations in the thyrotropin-receptor gene. N. Engl. J. Med. 1997;336:1390–1391. doi: 10.1056/NEJM199705083361914. - DOI - PubMed
    1. Clifton-Bligh R.J., Wentworth J.M., Heinz P., Crisp M.S., John R., Lazarus J.H., Ludgate M., Chatterjee V.K. Mutation of the gene encoding human TTF-2 associated with thyroid agenesis, cleft palate and choanal atresia. Nat. Genet. 1998;19:399–401. doi: 10.1038/1294. - DOI - PubMed
    1. Macchia P.E., Lapi P., Krude H., Pirro M.T., Missero C., Chiovato L., Souabni A., Baserga M., Tassi V., Pinchera A., et al. PAX8 mutations associated with congenital hypothyroidism caused by thyroid dysgenesis. Nat. Genet. 1998;19:83–86. doi: 10.1038/ng0598-83. - DOI - PubMed
    1. Gruters A., Krude H., Biebermann H. Molecular genetic defects in congenital hypothyroidism. Eur. J. Endocrinol. 2004;151:U39–U44. doi: 10.1530/eje.0.151u039. - DOI - PubMed