. 2021 Sep 1;22(17):9513.
doi: 10.3390/ijms22179513.

Follistatin-Like-1 (FSTL1) Is a Fibroblast-Derived Growth Factor That Contributes to Progression of Chronic Kidney Disease

Affiliations

Follistatin-Like-1 (FSTL1) Is a Fibroblast-Derived Growth Factor That Contributes to Progression of Chronic Kidney Disease

Nicholas A Maksimowski et al. Int J Mol Sci. .

Abstract

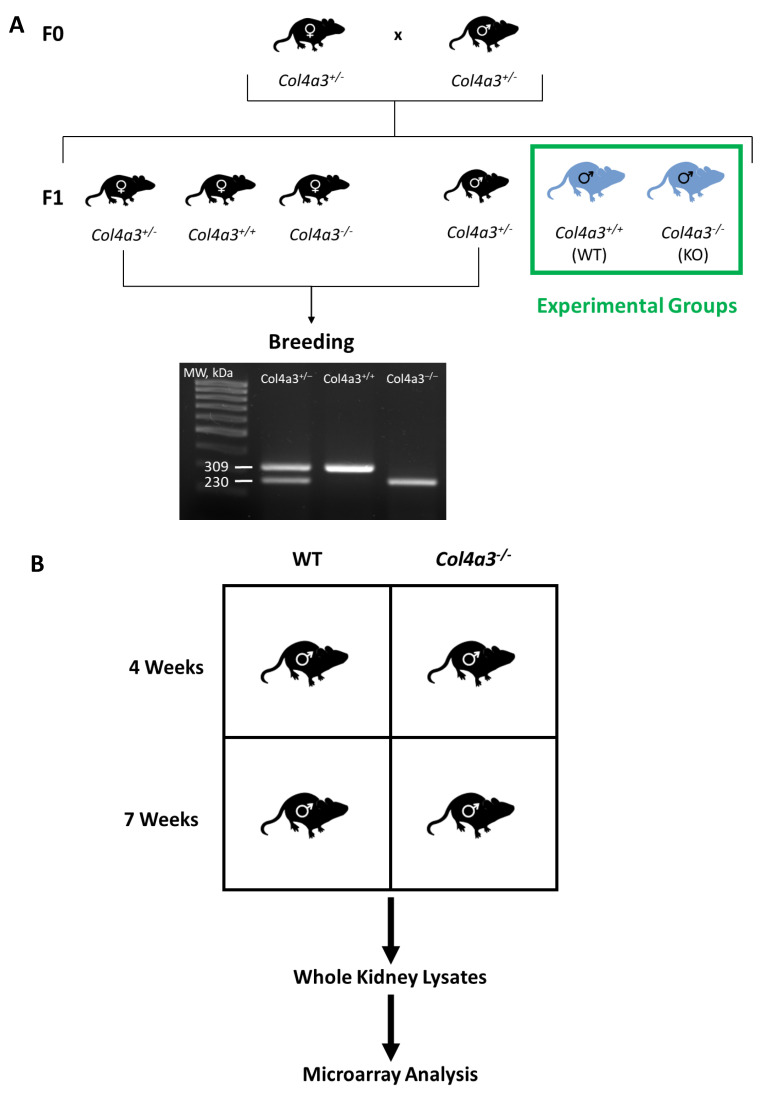
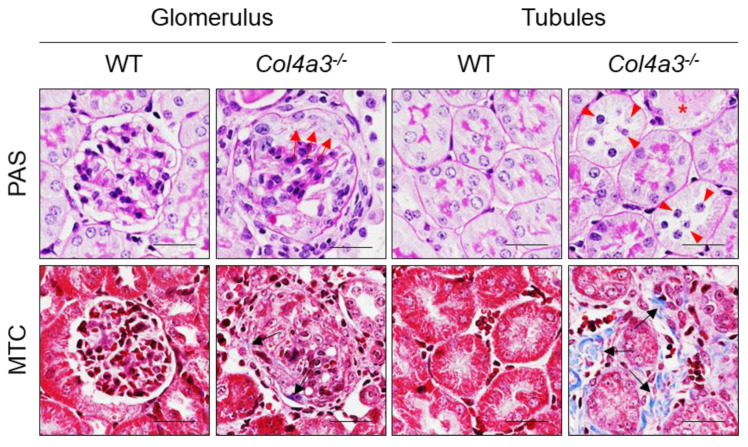
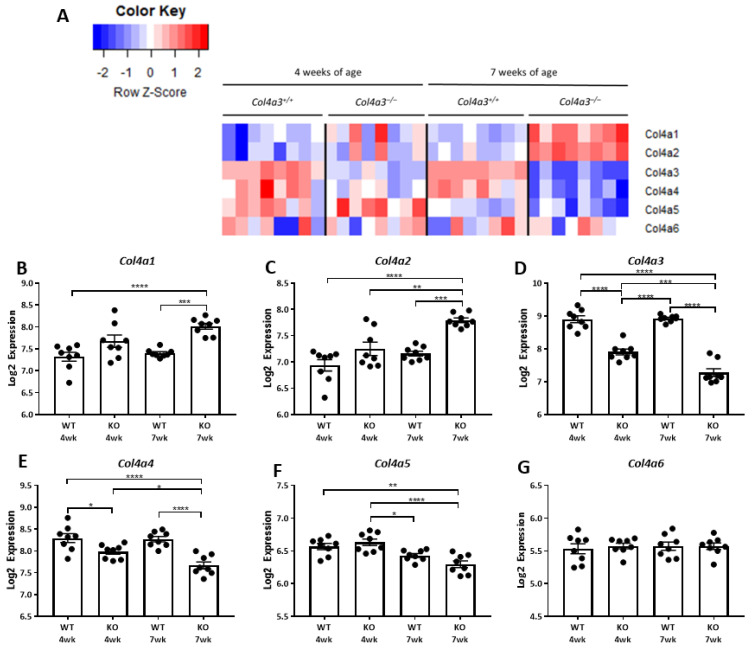
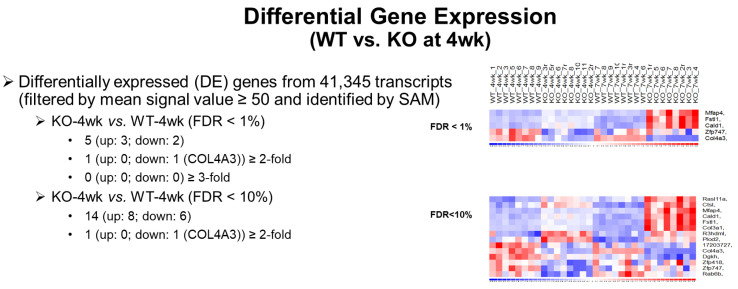
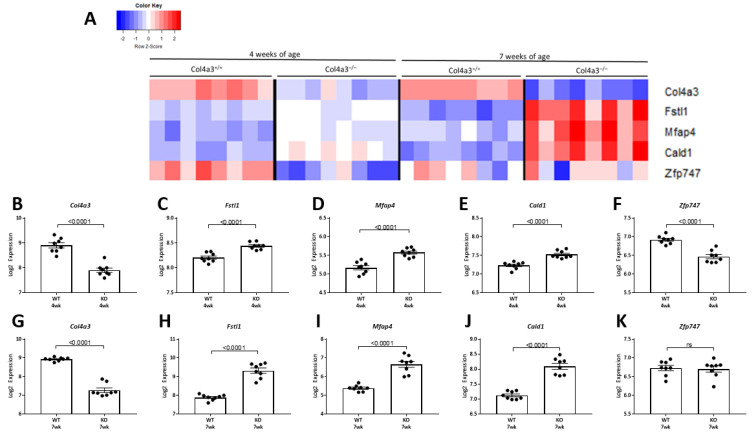
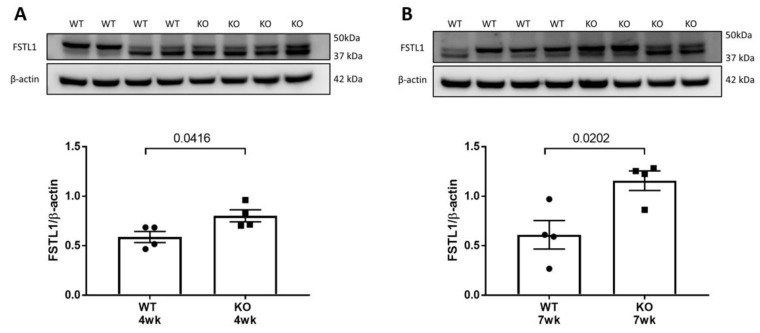
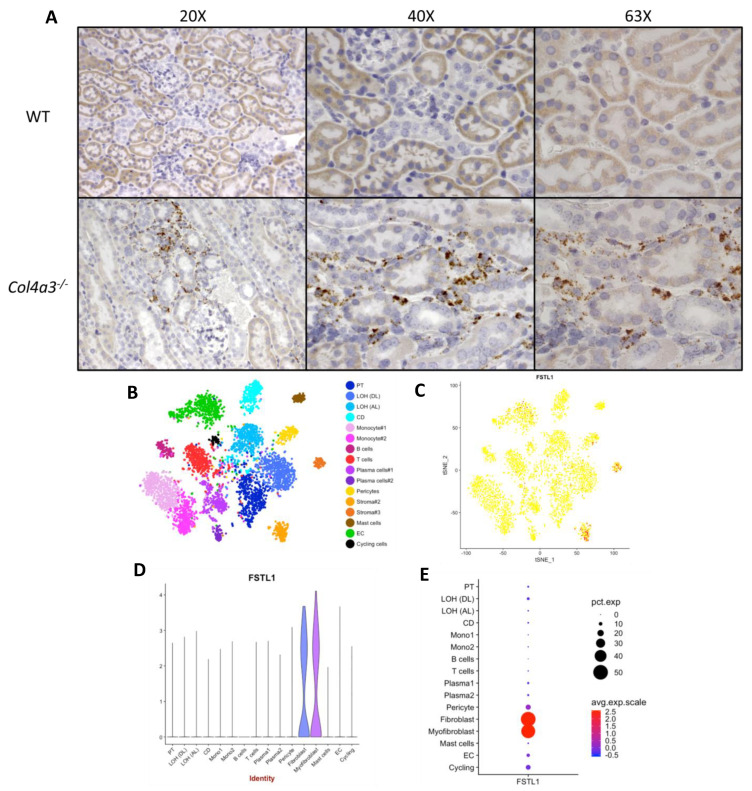
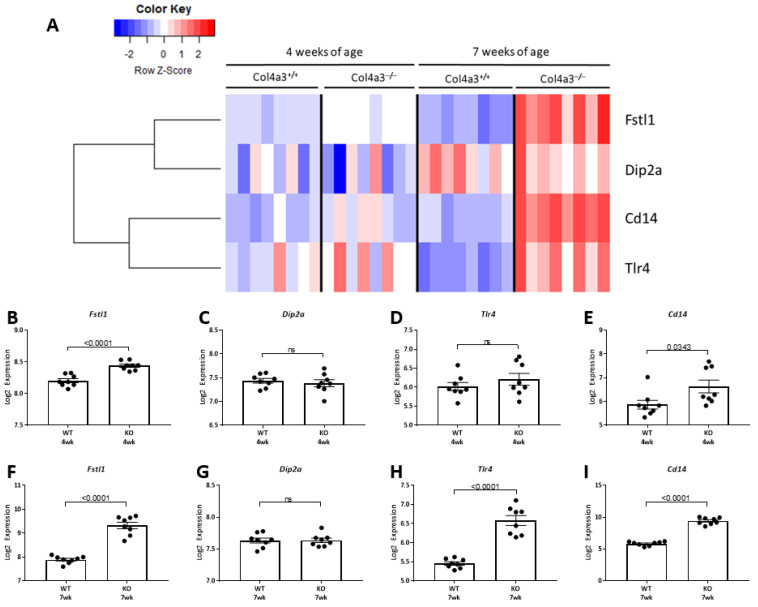
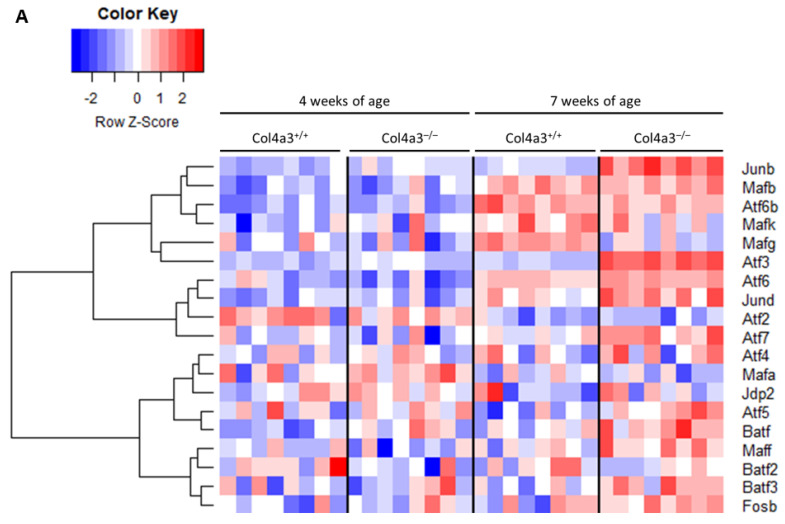
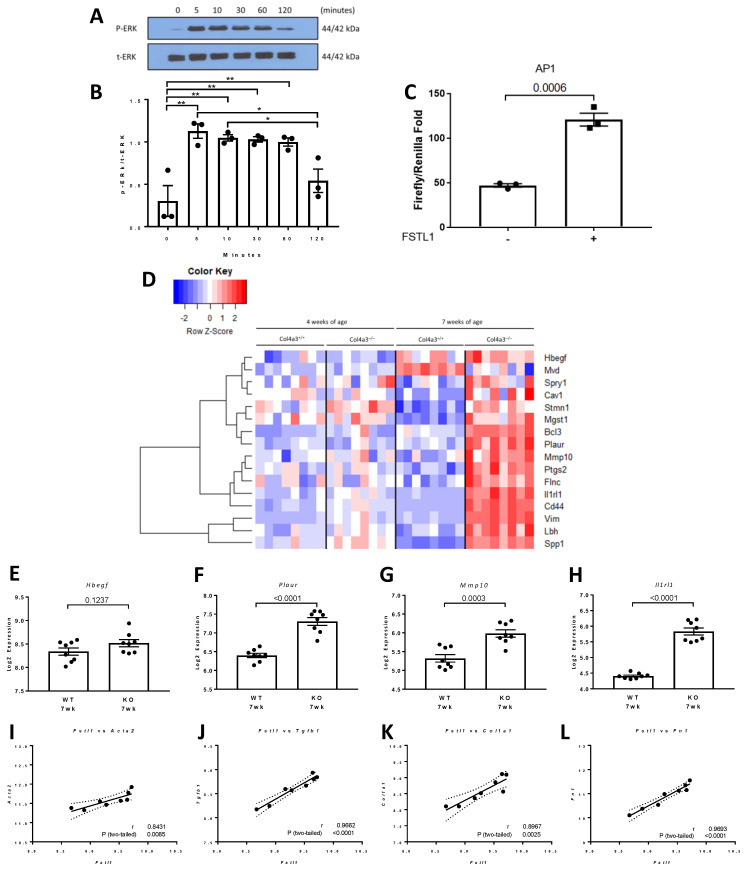
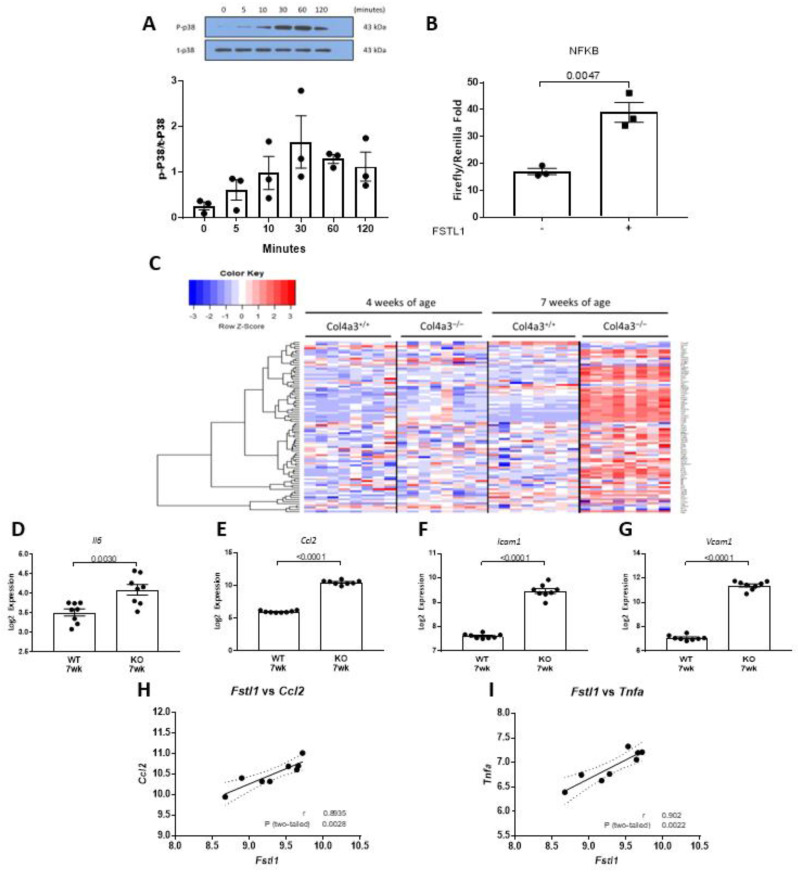
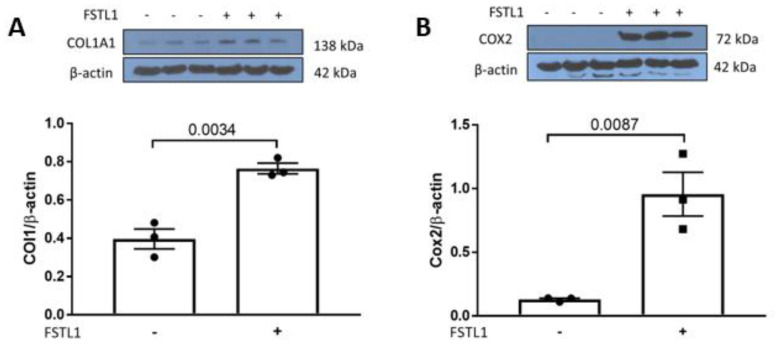
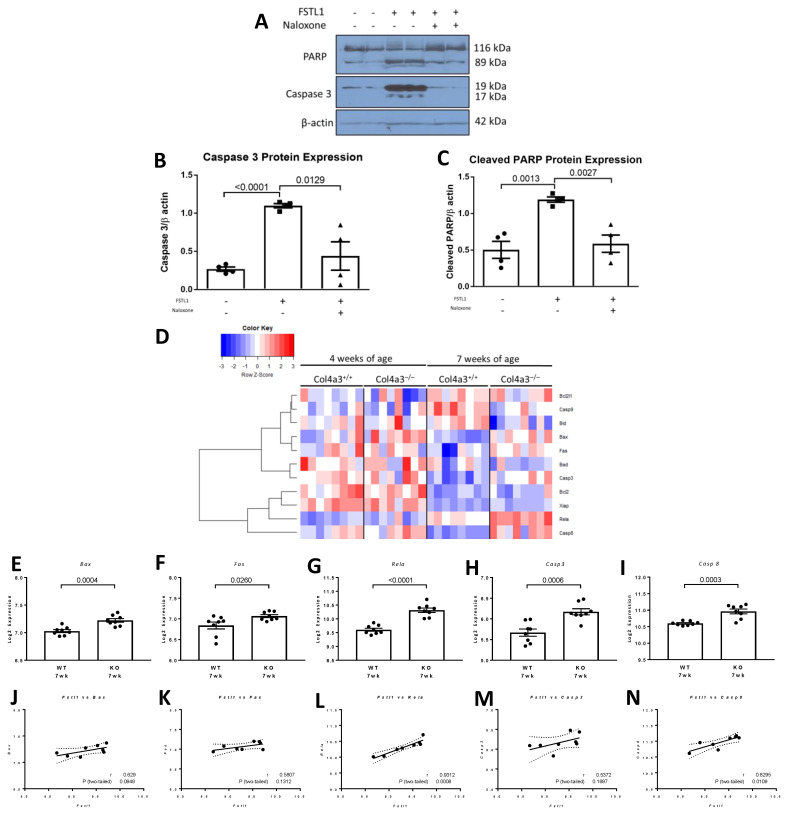
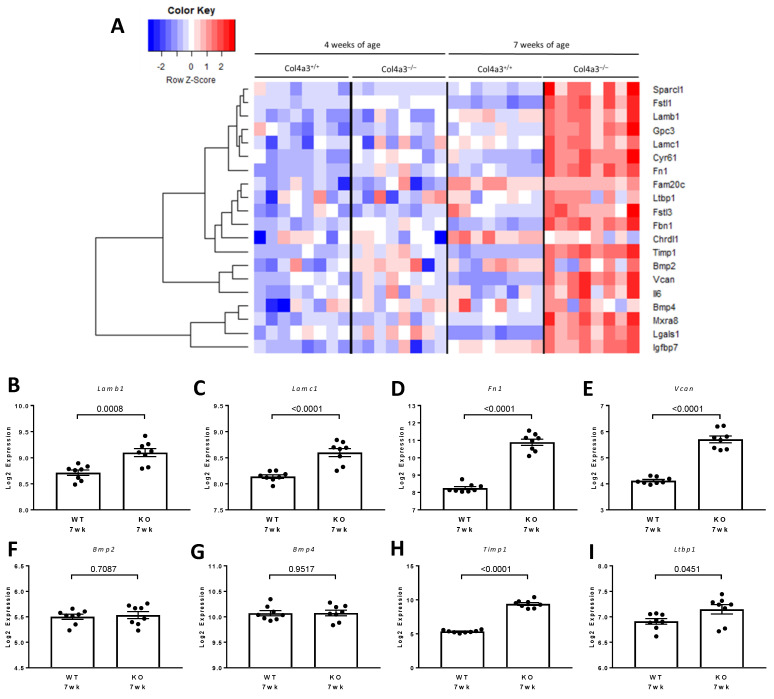
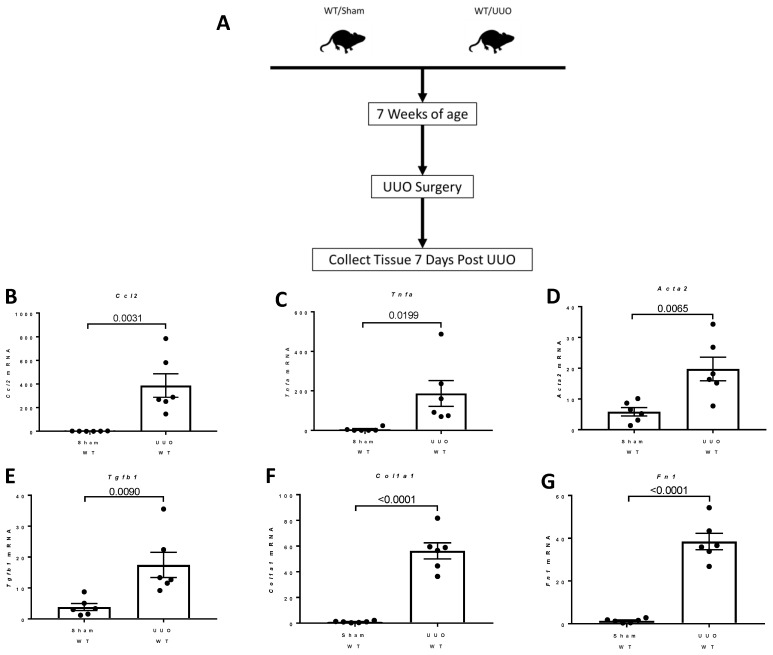
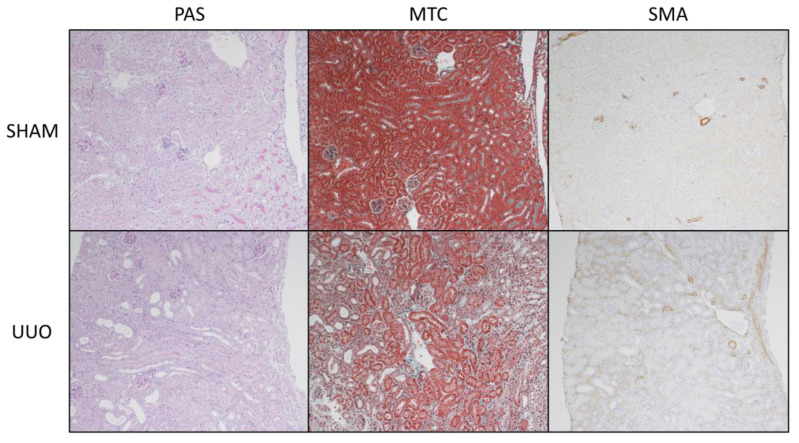
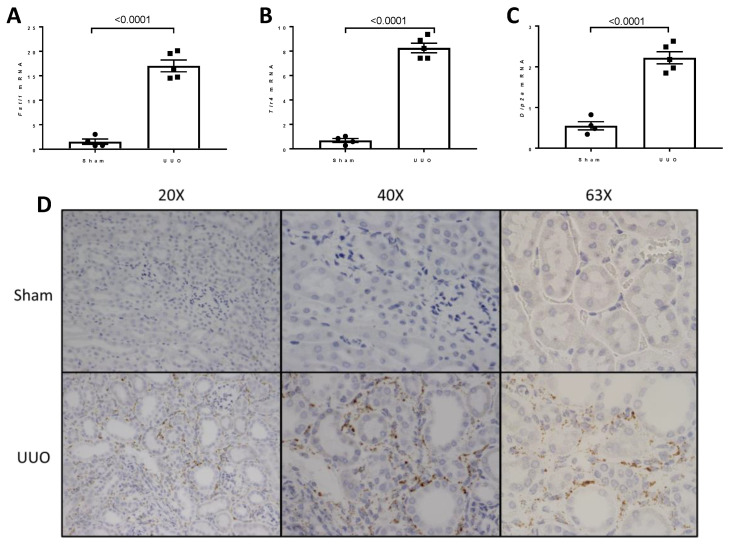
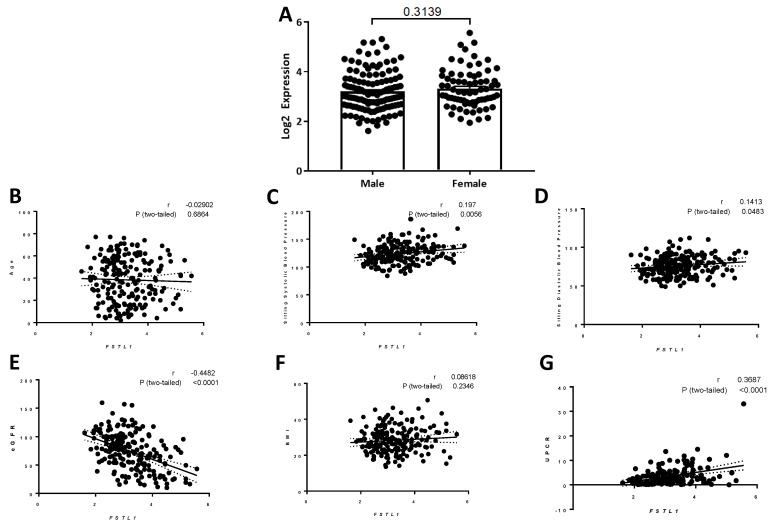
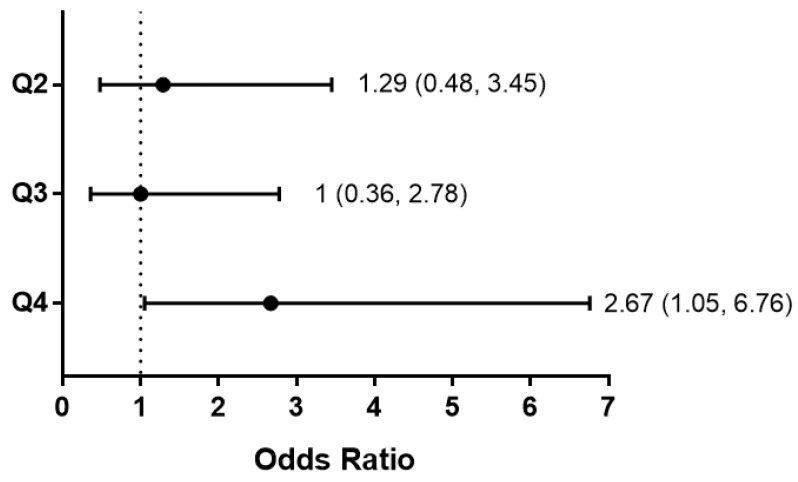
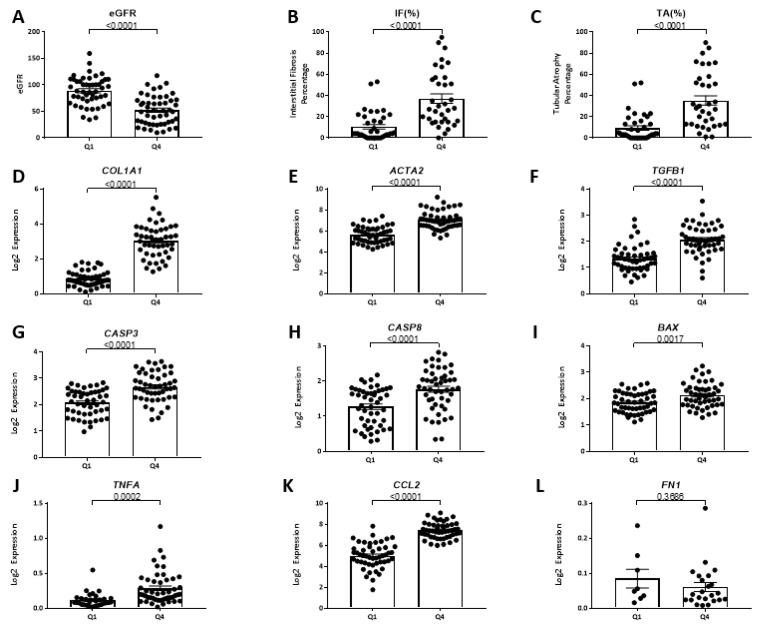
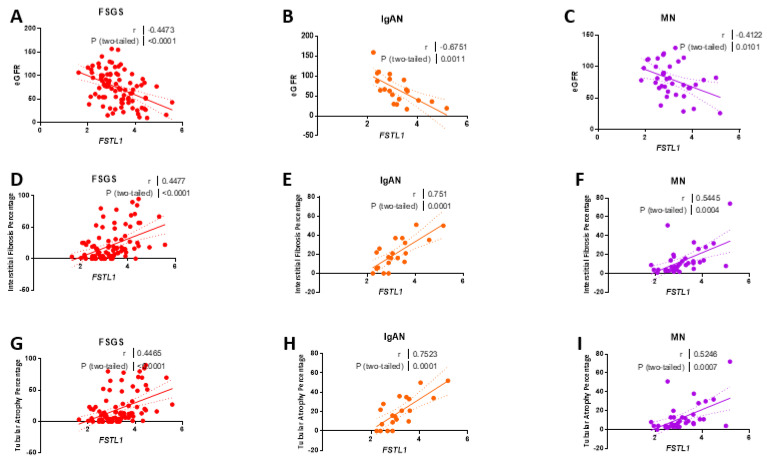
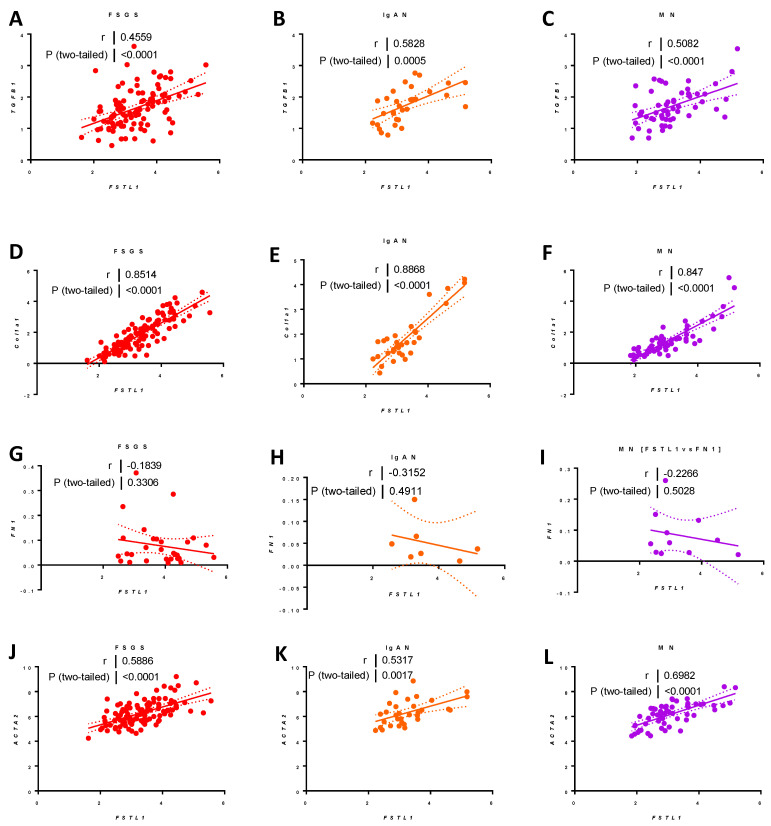
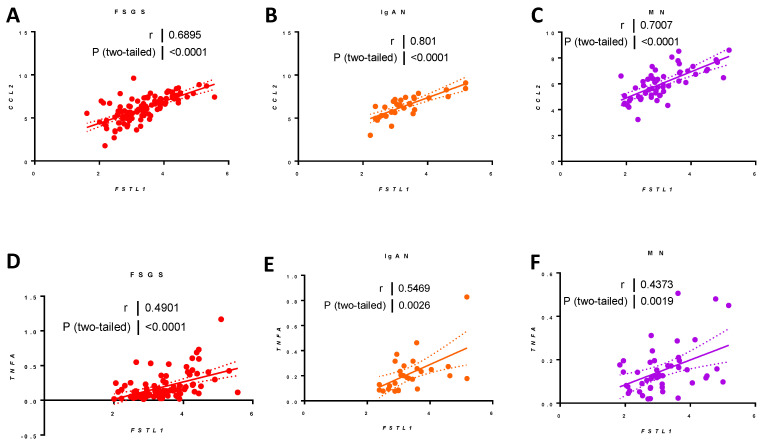
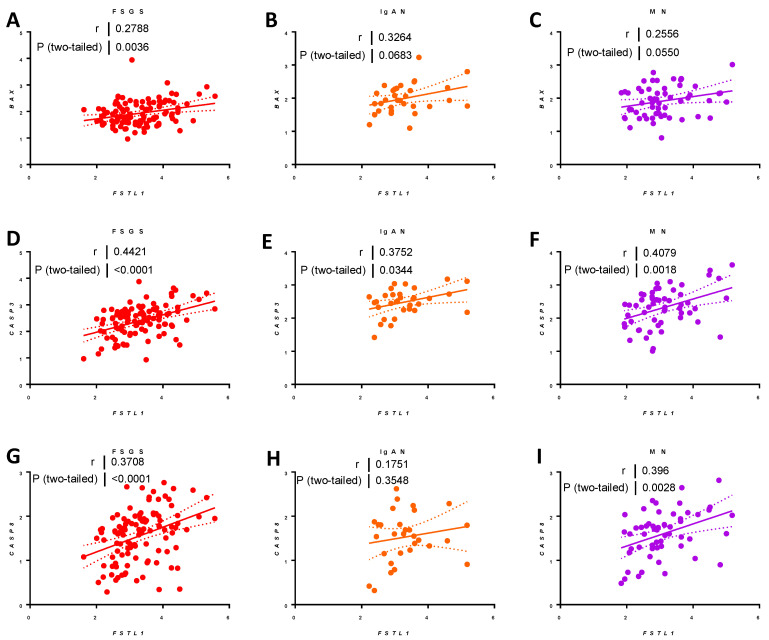
Our understanding of the mechanisms responsible for the progression of chronic kidney disease (CKD) is incomplete. Microarray analysis of kidneys at 4 and 7 weeks of age in Col4a3-/- mice, a model of progressive nephropathy characterized by proteinuria, interstitial fibrosis, and inflammation, revealed that Follistatin-like-1 (Fstl1) was one of only four genes significantly overexpressed at 4 weeks of age. mRNA levels for the Fstl1 receptors, Tlr4 and Dip2a, increased in both Col4a-/- mice and mice subjected to unilateral ureteral obstruction (UUO). RNAscope® (Advanced Cell Diagnostics, Newark CA, USA) localized Fstl1 to interstitial cells, and in silico analysis of single cell transcriptomic data from human kidneys showed Fstl1 confined to interstitial fibroblasts/myofibroblasts. In vitro, FSTL1 activated AP1 and NFκB, increased collagen I (COL1A1) and interleukin-6 (IL6) expression, and induced apoptosis in cultured kidney cells. FSTL1 expression in the NEPTUNE cohort of humans with focal segmental glomerulosclerosis (FSGS), membranous nephropathy (MN), and IgA nephropathy (IgAN) was positively associated with age, eGFR, and proteinuria by multiple linear regression, as well as with interstitial fibrosis and tubular atrophy. Clinical disease progression, defined as dialysis or a 40 percent reduction in eGFR, was greater in patients with high baseline FSTL1 mRNA levels. FSTL1 is a fibroblast-derived cytokine linked to the progression of experimental and clinical CKD.

Keywords: FSTL1; apoptosis; cytokines; fibrosis; inflammation; kidney; nephrotic syndrome.


Conflict of interest statement

The authors declare no conflict of interest. The funders had no role in the design of the study; in the collection, analyses, or interpretation of data; in the writing of the manuscript, or in the decision to publish the results.

Figures

Figure 1
Figure 1
Schematic diagram summarizing experimental workflow. (A) breeding strategy for generating experimental groups for analysis. (B) Whole kidney samples from 4 and 7 week old wild type (WT) and Col4a3-/- (KO) mice were subjected to microarray expression profiling.
Figure 2
Figure 2
Comparisons of the Kidney Tissue Morphology of Kidney of WT and Col4a3-/- mice. Images from glomerulus (left) and tubulointerstitium (right) are presented. Periodic Acid Schiff staining (PAS); Masson’s trichrome staining (MTC). In Col4a3-/- mice, crescents are packing the Bowman’s space (red arrows). Detachment of tubular epithelial cells from basement membrane (red arrowheads), tubular cast (red asterisks), and collagen deposits (black arrows) are also indicated. Scale bars, 50 μm.
Figure 3
Figure 3
Microarray expression of collagen 4 alpha 1-6. (A) Heatmap with unsupervised hierarchical cluster analysis of col4 genes in kidneys of 4 and 7 week old Col4a3-/- and wild-type mice (n = 8 per group). Each column reflects a kidney sample, and each row represents an individual gene. Red and blue color intensities correlate with the scaled up-regulation and downregulation of the gene, respectively. (BG) Graphical representation of microarray expression from panel A. Values are mean ± SEM. p values were determined by 1-way ANOVA. * p value < 0.05. ** p value < 0.01. *** p value < 0.001. **** p value < 0.0001.
Figure 4
Figure 4
Differential Gene Expression in WT vs. KO mice at 4 Weeks of Age. Explanation of the statistical parameters used to identify the 5 differently expressed genes at 4 weeks of age in WT vs. KO mice.
Figure 5
Figure 5
Microarray expression of genes differentially expressed at 4 and 7 weeks of age. (A) Heatmap with unsupervised hierarchical cluster analysis of the five genes that were differentially expressed at 4 weeks of age in the kidneys of Col4a3-/- mice. The analysis shows the gene expression in kidneys of 4 and 7 week old Col4a3-/- and wild-type mice (n = 8 per group). (BF) Graphical representation of mRNA levels in 4 week old wild type mice versus 4 week old Col4a3-/- mice. (GK) Graphical representation of microarray expression in 7 week old wild type versus 7 week old Col4a3-/- mice. Values are mean ± SEM, and significance was defined as a p value of < 0.05 by Student’s t tests.
Figure 6
Figure 6
FSTL1 Protein Expression in WT and KO mouse kidney. (A) Representative immunoblot and quantification of FSTL1 in 4 week WT and KO mouse kidney. (B) Representative immunoblot and quantification of FSTL1 in 7 week WT and KO mouse kidney. Values are the mean ± SEM (black bars). p values were determined by Student’s t tests, and significance was defined as a p value < 0.05.
Figure 7
Figure 7
Fstl1 expression localization in the kidney. (A) Light microscopic images at three magnifications of RNAscope® Fstl1 localization in wild type mice (upper three panels) and Col4a3-/- mice (lower three panels). (BE) Cell Clustering and Fstl1 expression from the Kidney Interactive Transcriptomics (KIT), human rejecting kidney allograft biopsy cells (http://humphreyslab.com/SingleCell, accessed on 15 March 2021).
Figure 8
Figure 8
Fstl1 and cognate receptor expression. (A) Heatmap with unsupervised hierarchical cluster analysis of Fstl1, Dip2a, Cd14, and Tlr4 genes in kidneys of 4 and 7 week old Col4a3-/- and wild-type mice (n = 8 per group). (BE) Graphical representation of microarray expression in 4 week old wild type versus 4 week old Col4a3-/- mice. (FI) Graphical representation of microarray expression in 7 week old wild type versus 7 week old Col4a3-/- mice. Values are mean ± SEM, and significance was defined as a p value of < 0.05 by Student’s t tests.
Figure 9
Figure 9
AP1 Heatmap. (A) Heatmap with unsupervised hierarchical cluster analysis of AP1 genes in kidneys of 4 and 7 week old Col4a3-/- and wild-type mice (n = 8 per group).
Figure 10
Figure 10
p42/p44 MAPK (ERK) activation and AP1-related gene expression. (A) Representative immunoblots for phosphorylated (P-ERK) and total (t-ERK) extracellular signal-regulated kinase in immortalized human proximal tubule epithelial cells that were treated with rhFSTL1 for either 0, 5, 10, 30, 60, or 120 min. (B) Densitometry intensities were quantified and normalized to total ERK (n = 3). Values are mean ± SEM. p values were determined by one-way ANOVA. Significance was defined as a p value of < 0.05. (C) Immortalized human proximal tubule epithelial cells were transfected with an AP1 luciferase reporter plasmid. The experimental group of cells were incubated in rhFSTL1 for 24 h (n = 3 per group). Luciferase activity was subsequently determined. Values are the mean ± SEM (black bars). Values are mean ± SEM, and significance was defined as a p value of < 0.05 by Student’s t tests. (D) Heat map with unsupervised hierarchical cluster analysis of AP1 related genes in kidneys of 4 and 7 week old Col4a3-/- and wild-type mice (n = 8 per group). (EH) Graphical representation of selected mRNA levels in 7 week old wild type versus 7 week old Col4a3-/- mice. Values are mean ± SEM, and significance was defined as a p value of < 0.05 by Student’s t tests. (IL) Fstl1 mRNA levels were correlated with Acta2, Tgfb1, Col1a1, and Fn1 mRNA levels. Pearson’s correlation coefficient (r) was determined, and two-tailed p values derived. Linear regression generated the line of best fit (solid lines) with 95% confidence intervals (dotted lines). Significance was defined as a p value < 0.05. * p value < 0.05. ** p value < 0.01.
Figure 11
Figure 11
p38 MAPK activation and NFκB-related expression. (A) Representative immunoblots for phosphorylated (P-p38) and total (t-p38) p38 in immortalized human proximal tubule epithelial cells that were treated with rhFSTL1 for either 0, 5, 10, 30, 60, or 120 min. Densitometry intensities were quantified and normalized to total p38 (n = 3). Values are mean ± SEM, and p values were determined by one-way ANOVA. Significance was defined as a p value of < 0.05. (B) Immortalized human proximal tubule epithelial cells were transfected with an NFκB luciferase reporter plasmid. Cells were incubated in rhFSTL1 for 24 h (n = 3 per group) and luciferase activity was determined. Values are the mean ± SEM (black bars). Significance was defined as a p value of < 0.05. (C) Heatmap with unsupervised hierarchical cluster analysis of NFκB related genes in kidneys of 4 and 7 week old Col4a3-/- and wild-type mice (n = 8 per group). (DG) Graphical representation of selected gene mRNA levels in 7 week old wild type versus 7 week old Col4a3-/- mice. Values are the mean ± SEM (black bars). p values were determined by Student’s t tests, and significance was defined as a p value < 0.05. (H,I) Fstl1 mRNA levels were correlated with Ccl2 and Tnfa mRNA levels. Pearson’s correlation coefficient (r) was determined, and two-tailed p values derived. Linear regression generated the line of best fit (solid lines) with 95% confidence intervals (dotted lines). Significance was defined as a p value < 0.05.
Figure 12
Figure 12
rhFSTL1 treatment of cultured human kidney cells. (A) Representative Western blots for collagen type I alpha1 chain (COL1a1) and β-actin in immortalized human proximal tubule epithelial cells treated with rhFSTL1 for 24 h. Densitometry intensities were quantified and normalized to total (n = 3). (B) Representative Western blots for cyclooxygenase 2 (COX2) and β-actin in immortalized human proximal tubule epithelial cells that were treated with rhFSTL1 for 24 h. Densitometry intensities were quantified and normalized to total (n = 3). Values are the mean ± SEM (black bars). p values were determined by Student’s t tests, and significance was defined as a p value < 0.05.
Figure 13
Figure 13
Fstl1 apoptosis. (A) Representative Western blots for poly (ADP-Ribose) polymerase 1 (PARP), Caspase 3 (CASP3), and β-actin in immortalized human proximal tubule epithelial cells treated with rhFSTL1 ± naloxone for 24 h. (B,C) Quantitative densitometry of immunoblots for PARP and CASP3, respectively. Intensities were quantified and normalized to β-actin (n = 3). Values are the mean ± SEM (black bars). p values were determined by Student’s t tests, and significance was defined as a p value of <0.05. (D) Heat map with unsupervised hierarchical cluster analysis of apoptotic-related genes in kidneys of 4 and 7 week old Col4a3-/- and wild-type mice (n = 8 per group). (EI) Graphical representation of mRNA levels for selected apoptosis-related genes in 7 week old wild type versus 7 week old Col4a3-/- mice. Values are the mean ± SEM (black bars). p values were determined by Student’s t tests, and significance was defined as a p value < 0.05. (JN) Fstl1 mRNA levels were correlated with Bax, Fas, Rela, Casp3, and Casp8 mRNA levels in 7 week old Col4a3-/- mice. Pearson’s correlation coefficient (r) was determined, and two-tailed p values derived. Linear regression generated the line of best fit (solid lines) with 95% confidence intervals (dotted lines). Significance was defined as a p value of <0.05.
Figure 14
Figure 14
Protein–protein interaction (PPI) analysis of FSTL1. (A) Descriptions of nodes and edges used in the PPI interaction map. (B) STRING interaction map showing protein–protein association between FSTL1 and 5, 10, and 15 proteins. (C) STRING interaction map showing protein–protein association between FSTL1 and 20 proteins (listed in Figure 15 with the confidence scores generated by STRING).
Figure 15
Figure 15
STRING interaction map showing protein–protein association between Fstl1 and 20 proteins.
Figure 16
Figure 16
Expression analysis of FSTL1 signature genes derived from the STRING analysis of the FSTL1 protein–protein interaction (PPI) network. (A) Heat map with unsupervised hierarchical cluster analysis of the FSTL1 driven PPI network genes in kidneys of 4 and 7 week old Col4a3-/- mice and wild-type mice (n = 8 per group). (BI) Graphical representation of mRNA levels for selected FSTL1 signature genes in 7 week old wild type versus 7 week old Col4a3-/- mice. Values are the mean ± SEM (black bars). p values were determined by Student’s t tests, and significance was defined as a p value < 0.05.
Figure 17
Figure 17
Unilateral ureteral obstruction (UUO) and Fstl1 expression. (A) Schematic diagram summarizing experimental workflow and collection of tissue from 7 week old C57B6 mice subjected to sham (n = 4) or UUO (n = 5) surgery. 7 days after surgery, mice were sacrificed, and kidney tissue was collected for analysis of mRNA levels. (B,C) Graphical representation of mRNA levels for selected genes implicated in kidney inflammation (Ccl2, Tnfa) in 7 week old wild type sham versus 7 week old UUO mice. Values are mean ± SEM (black bars). p values were determined by Student’s t tests, and significance was defined as a p value < 0.05. (DG) Graphical representation of mRNA levels for selected genes implicated in kidney fibrosis (Acta2, Tgfb1, Col1a1, Fn1) in 7 week old wild type sham versus 7 week old UUO mice. Values are mean ± SEM (black bars). p values were determined by Student’s t tests, and significance was a p value < 0.05.
Figure 18
Figure 18
Fstl1 Histology of sham and UUO mice. Periodic acid–Schiff (PAS) (left panels), Masson Trichrome (MTC) (middle panels), and alpha-Smooth Muscle Actin (SMA) (right panels) in sham-operated mice (upper panels) and mice subjected to UUO for 7 days (lower panels).
Figure 19
Figure 19
Fstl1 expression and localization in UUO. (AC) mRNA levels for Fstl1 and its putative receptors (Tlr4 and Dip2a) were determined by quantitative polymerase chain reaction in kidneys of C57B6 mice (sham n = 4, UUO n = 5). Values are the mean ± SEM (black bars). p values were determined by Student’s t test, and significance was defined as a p value of < 0.05. (D) Light microscopic images at three magnifications of RNASCOPE® Fstl1 localization in sham-operated mice (upper three panels) and mice subjected to UUO for 7 days (lower three panels).
Figure 20
Figure 20
Relationship of tubulointerstitial FSTL1 expression to clinical variables in the cohort of FSGS, IgAN, and MN. (A) FSTL1 mRNA levels in male subjects compared to female subjects. (BG) FSTL1 mRNA levels correlated against (B) age, (C) sitting systolic blood pressure, (D) sitting diastolic blood pressure, (E) estimated glomerular filtration rate (eGFR), (F) Urine Protein to Creatinine Ratio (UPCR), and (G) Body Mass Index (BMI). Pearson’s correlation coefficient (r) was determined, and two-tailed p values derived. Significance was determined as a p value of <0.05. Linear regression generated the line of best fit (solid lines) with 95% confidence intervals (dotted lines). Significance was determined as a p value of <0.05.
Figure 21
Figure 21
Forest Plot of End Point Analysis. The odds ratio (OR) with 95 percent confidence intervals for reaching the end point in the second, third, and fourth quartiles of baseline FSTL1 mRNA levels. The first quartile was the reference group. The OR was not adjusted for baseline clinical variables.
Figure 22
Figure 22
A Comparison of Baseline Laboratory Variables and Gene Expression Levels Between First and Fourth FSTL1 Quartiles. (A) eGFR. (B) Interstitial fibrosis percentage (IF). (C) tubular atrophy percentage (TA). (D) Collagen Type I Alpha 1 Chain (COL1A1) expression. (E) Actin Alpha 2, Smooth Muscle (ACTA2) expression. (F) Transforming growth factor beta (TGFB1) expression. (G) Caspase 3 (CASP3) expression. (H) Caspase 8 (CASP8) expression. (I) BCL2 Associated X, Apoptosis Regulator (BAX) expression. (J) Tumor Necrosis Factor (TNFA) expression. (K) C-C Motif Chemokine Ligand 2 (CCL2) expression. (L) Fibronectin 1 (FN1) expression. Values are the mean ± SEM (black bars). p values were determined by Student’s t tests, and significance was defined as a p value < 0.05.
Figure 23
Figure 23
Clinical FSTL1 expression in FSGS (red), IgAN (orange), and MN (purple). (A) eGFR correlated to FSTL1 mRNA levels in FSGS patients. (B) eGFR correlated to FSTL1 mRNA levels in IgAN patients. (C) eGFR correlated to FSTL1 mRNA levels in MN patients. (D) Interstitial fibrosis (IF) correlated to FSTL1 mRNA levels in FSGS patients. (E) Interstitial fibrosis (IF) correlated to FSTL1 mRNA levels in IgAN patients. (F) Interstitial fibrosis (IF) correlated to FSTL1 mRNA levels in MN patients. (G) Tubular atrophy (TA) correlated to FSTL1 mRNA levels in FSGS patients. (H) Tubular atrophy (TA) correlated to FSTL1 mRNA levels in IgAN patients. (I) Tubular atrophy (TA) correlated to FSTL1 mRNA levels in MN patients. Pearson’s correlation coefficient (r) was determined, and two-tailed p values derived. Significance was determined as a p value of <0.05. Linear regression generated the line of best fit (solid lines) with 95% confidence intervals (dotted lines).
Figure 24
Figure 24
Relationship of FSTL1 mRNA Levels to the Expression of Genes Implicated in Fibrosis in FSGS (red), IgAN (orange), and MN (purple). Table 1. expression correlated to FSTL1 mRNA levels in FSGS (A), in IgAN (B), and MN (C). COL1A1 expression correlated to FSTL1 mRNA levels in FSGS (D), in IgAN (E), and in MN (F). FN1 expression correlated to FSTL1 mRNA levels in FSGS (G), in IgAN (H), and MN (I). ACTA2 expression correlated to FSTL1 mRNA levels in FSGS (J), in IgAN (K), and MN (L). Pearson’s correlation coefficient (r) was determined, and two-tailed p values derived. Significance was determined as a p value of <0.05. Linear regression generated the line of best fit (solid lines) with 95% confidence intervals (dotted lines).
Figure 25
Figure 25
Relationship of FSTL1 mRNA Levels to the Expression of Genes Implicated in Inflammation in FSGS (red), IgAN (orange), and MN (purple). CCL2 expression correlated to FSTL1 mRNA levels in FSGS (A), in IgAN (B), and MN (C). TNFA expression correlated to FSTL1 mRNA levels in in FSGS (D), in IgAN (E), and MN (F). Pearson’s correlation coefficient (r) with two-tailed p values were calculated. Significance was determined as a p value of <0.05. Linear regression generated the line of best fit (solid lines) with 95% confidence intervals (dotted lines).
Figure 26
Figure 26
Relationship of FSTL1 mRNA levels to the Expression of Genes implicated in Apoptosis in FSGS (red), IgAN (orange), and MN (purple). BAX expression correlated to FSTL1 mRNA levels in FSGS (A), in IgAN (B), and MN (C). CASP3 expression correlated to FSTL1 mRNA levels in in FSGS (D), in IgAN (E), and MN (F). CASP8 expression correlated to FSTL1 mRNA levels in in FSGS (G), in IgAN (H), and MN (I). Pearson’s correlation coefficient (r) with two-tailed p values were calculated. Significance was determined as a p value of <0.05. Linear regression generated the line of best fit (solid lines) with 95% confidence intervals (dotted lines).

Similar articles

Cited by

References

    1. Saucedo A.L., Perales-Quintana M.M., Paniagua-Vega D., Sanchez-Martinez C., Cordero-Perez P., Minsky N.W. Chronic Kidney Disease and the Search for New Biomarkers for Early Diagnosis. Curr. Med. Chem. 2018;25:3719–3747. doi: 10.2174/0929867325666180307110908. - DOI - PubMed
    1. Prakoura N., Chatziantoniou C. Periostin and Discoidin Domain Receptor 1: New Biomarkers or Targets for Therapy of Renal Disease. Front. Med. 2017;4:52. doi: 10.3389/fmed.2017.00052. - DOI - PMC - PubMed
    1. Zhang M.-Z., Sasaki K., Li Y., Li Z., Pan Y., Jin G.-N., Wang Y., Niu A., Wang S., Fan X., et al. The Role of the EGF Receptor in Sex Differences in Kidney Injury. J. Am. Soc. Nephrol. 2019;30:1659–1673. doi: 10.1681/ASN.2018121244. - DOI - PMC - PubMed
    1. Escobar C., Aranda U., Palacios B., Capel M., Sicras A., Sicras A., Hormigo A., Alcázar R., Manito N., Botana M. Epidemiology, clinical profile, management, and two-year risk complications among patients with chronic kidney disease in Spain. Nefrologia. 2021 doi: 10.1016/j.nefro.2021.03.006. in press. - DOI - PubMed
    1. Bae E.H., Fang F., Williams V.R., Konvalinka A., Zhou X., Patel V.B., Song X., John R., Oudit G.Y., Pei Y., et al. Murine recombinant angiotensin-converting enzyme 2 attenuates kidney injury in experimental Alport syndrome. Kidney Int. 2017;91:1347–1361. doi: 10.1016/j.kint.2016.12.022. - DOI - PubMed

MeSH terms