Comparative Study
. 2021 Sep 2;22(17):9537.
doi: 10.3390/ijms22179537.

Oligomeric and Fibrillar Species of Aβ42 Diversely Affect Human Neural Stem Cells

Affiliations
Comparative Study

Oligomeric and Fibrillar Species of Aβ42 Diversely Affect Human Neural Stem Cells

Adela Bernabeu-Zornoza et al. Int J Mol Sci. .

Abstract

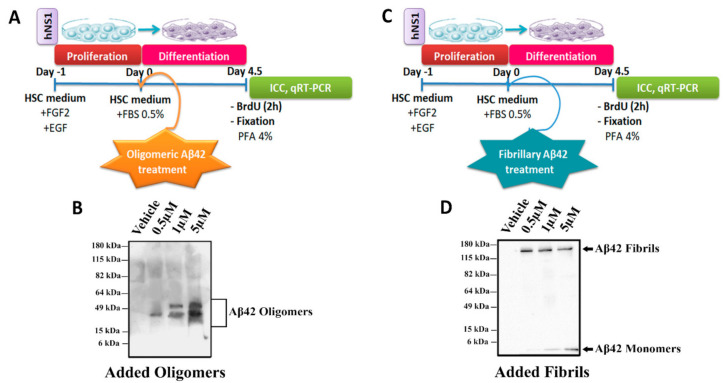
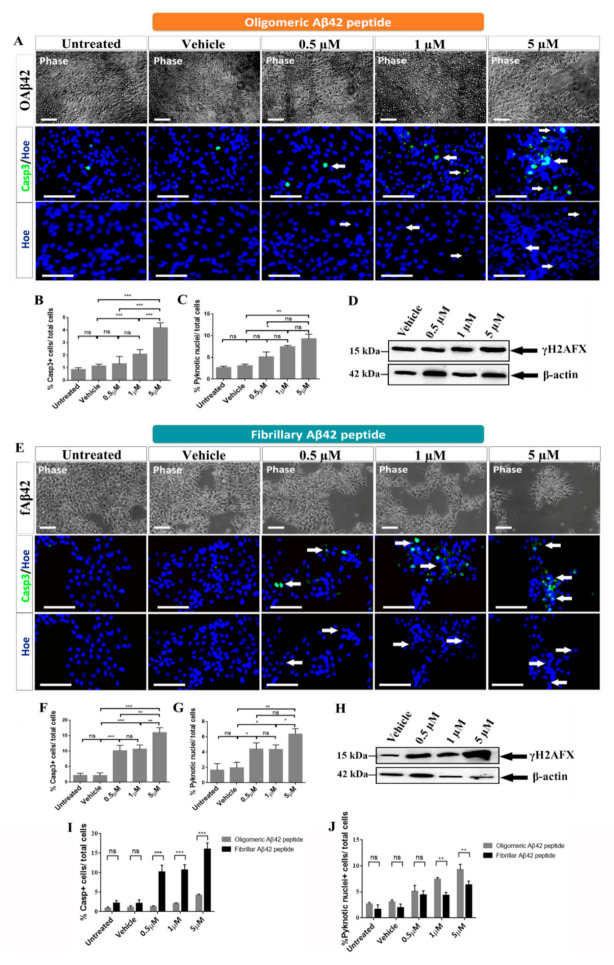
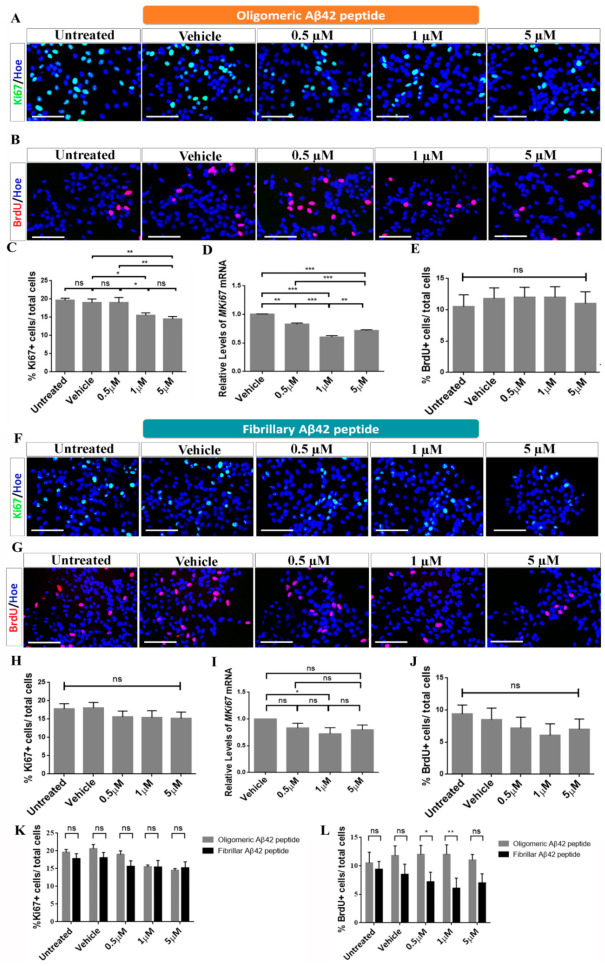
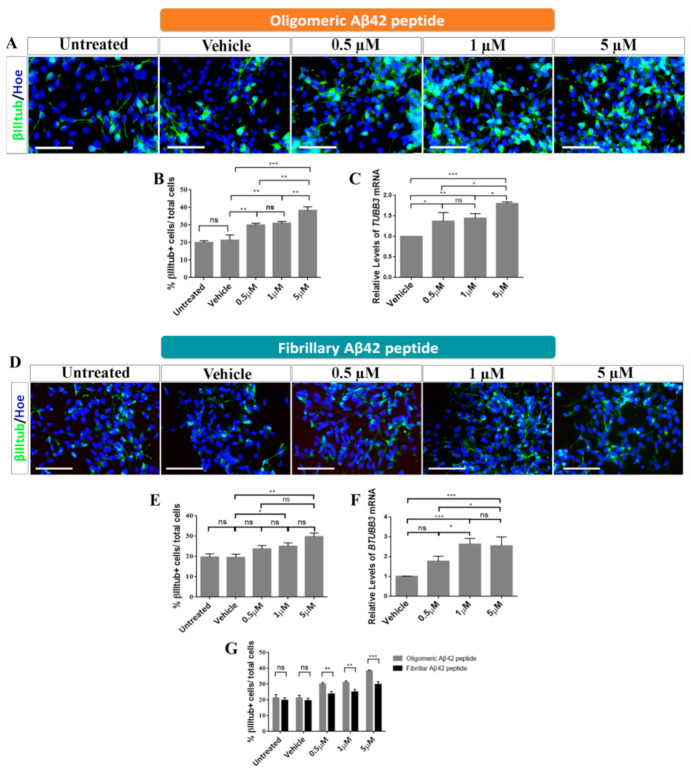
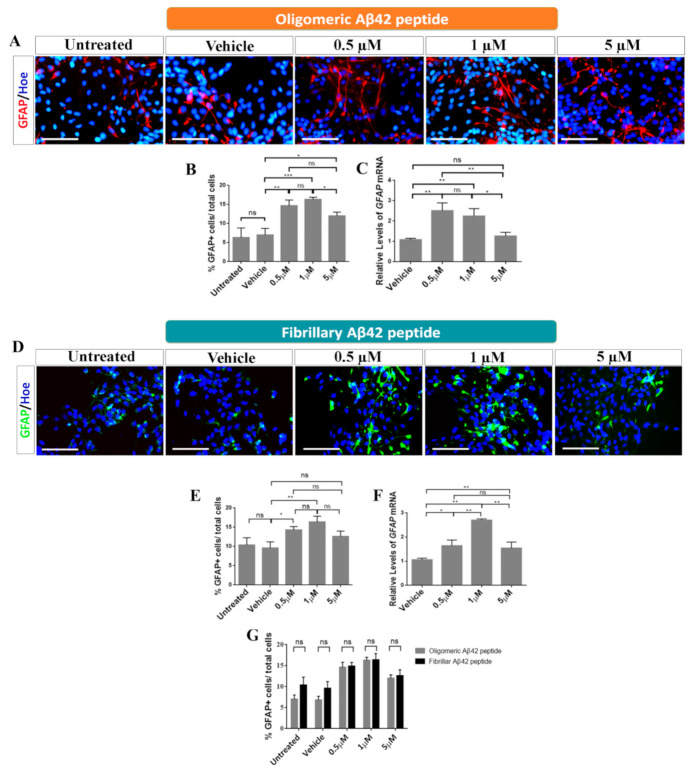
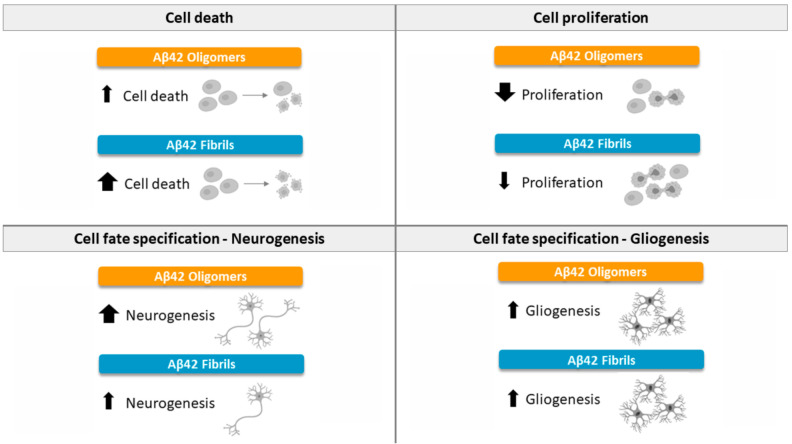
Amyloid-β 42 peptide (Aβ1-42 (Aβ42)) is well-known for its involvement in the development of Alzheimer's disease (AD). Aβ42 accumulates and aggregates in fibers that precipitate in the form of plaques in the brain causing toxicity; however, like other forms of Aβ peptide, the role of these peptides remains unclear. Here we analyze and compare the effects of oligomeric and fibrillary Aβ42 peptide on the biology (cell death, proliferative rate, and cell fate specification) of differentiating human neural stem cells (hNS1 cell line). By using the hNS1 cells we found that, at high concentrations, oligomeric and fibrillary Aβ42 peptides provoke apoptotic cellular death and damage of DNA in these cells, but Aβ42 fibrils have the strongest effect. The data also show that both oligomeric and fibrillar Aβ42 peptides decrease cellular proliferation but Aβ42 oligomers have the greatest effect. Finally, both, oligomers and fibrils favor gliogenesis and neurogenesis in hNS1 cells, although, in this case, the effect is more prominent in oligomers. All together the findings of this study may contribute to a better understanding of the molecular mechanisms involved in the pathology of AD and to the development of human neural stem cell-based therapies for AD treatment.

Keywords: Alzheimer’s; Aβ peptide; Aβ42; cell death; cell differentiation; fibrils; human NSCs; oligomers.


Conflict of interest statement

The authors confirm that this article content has no conflict of interest.

Figures

Figure 1
Figure 1
Schematic representation of the experiments and WB analysis. Schematic view of hNS1 cells’ differentiation protocol (See Materials and Methods section) for (A) Aβ42 oligomers and (C) Aβ42 fibrils. (B) Representative WB analysis of Aβ42 forms (using 4G8 antibody) present in extracellular medium used for oligomeric Aβ42 treatment. (D) Representative WB analysis of Aβ42 forms (using 4G8 antibody) present in extracellular medium used for fibrillary Aβ42 treatment.
Figure 2
Figure 2
Oligomeric and fibrillary Aβ42 increases cell death in differentiating hNS1 cells. (A) Representative phase-contrast images of hNS1 cultures treated with 0.5, 1, and 5 µM of oligomeric Aβ42 peptide (upper panels) and controls (untreated cells and vehicle (DMSO)-treated cells) for 4.5 days. Representative microphotographs of caspase 3 immunoreactivity after oligomeric Aβ42 treatment (middle panels, Casp3, green; see arrows). Representative microphotographs of pyknotic nuclei stained with Höechst are represented in blue (bottom panels, Hoe; see arrows). (B) Quantification of the percentage of caspase 3+ cells in response to the specified dose of oligomeric Aβ42 peptide. (C) Quantification of the percentage of pyknotic nuclei in the different experimental groups after oligomeric Aβ42 treatment. (D) Western blot analysis of double-strand DNA breaks (using γH2AX antibody; 15 kDa) in cellular extracts after oligomeric Aβ42 treatment. (E) Representative phase contrast images of hNS1 cultures treated with 0.5, 1, and 5 µM of fibrillary Aβ42 peptide (upper panels) and controls (untreated cells and vehicle (DMSO)-treated cells) for 4.5 days. Representative microphotographs of caspase 3 immunoreactivity after fibrillary Aβ42 treatment (middle panels, Casp3, green; see arrows). Representative microphotographs of pyknotic nuclei stained with Höechst are represented in blue (bottom panels, Hoe; see arrows). (F) Quantification of the percentage of Caspase 3+ cells in response to the specified dose of fibrillary Aβ42 peptide. (G) Quantification of the percentage of pyknotic nuclei in the different experimental groups after fibrillary Aβ42 treatment. (H) Western blot analysis of double-strand DNA breaks (using γH2AX antibody; 15 kDa) in cellular extracts after fibrillary Aβ42 treatment. (I) Percentage of caspase 3+/total cells comparing both added forms. (J) Percentage of pyknotic nuclei+/total cells comparing both added forms. Scale bar, 100 µM (A, E; upper panels) and 50 µM (A, E; middle and bottom panels). Data are represented as means ± SD of at least three different experiments (n = 3). Statistical significance of one-way ANOVA with post hoc Tukey test; * p < 0.05; ** p < 0.01; *** p < 0.001; ns = not significant vs. control groups.
Figure 3
Figure 3
Oligomeric and fibrillary Aβ42 affects cell cycle of differentiating hNS1 cells. (A) Representative images showing Ki67 immunoreactivity (green) after oligomeric Aβ42 treatment. (B) Microphotographs with immunoreactivity for BrdU (red) after oligomeric Aβ42 treatment. (C) Percentage of Ki67+ cells in the different experimental groups after oligomeric Aβ42 treatment. (D) Relative expression levels of MKi67 mRNA determined by qRT-PCR analysis after oligomeric Aβ42 treatment. (E) Percentage of BrdU+ cells in the different cellular groups after oligomeric Aβ42 treatment. (F) Representative images showing Ki67 immunoreactivity (green) after fibrillary Aβ42 treatment. (G) Microphotographs with immunoreactivity for BrdU (red) after fibrillary Aβ42 treatment. (H) Percentage of Ki67+ cells in the different experimental groups after fibrillary Aβ42 treatment. (I) Relative expression levels of MKi67 mRNA determined by qRT-PCR analysis after fibrillary Aβ42 treatment. (J) Percentage of BrdU+ cells in the different cellular groups after fibrillary Aβ42 treatment. (K) Percentage of Ki67+ cells/total cells comparing both added forms. (L) Percentage of BrdU+/total cells comparing both added forms. Nuclei were counterstained in blue with Höechst. Scale bar, 50 µM. Data are represented as means ± SD of at least three different experiments (n = 3). Statistical significance of one-way ANOVA with post hoc Tukey test; * p < 0.05; ** p < 0.01; *** p < 0.001; ns = not significant vs control groups.
Figure 4
Figure 4
Roles of oligomeric and fibrillary Aβ42 in neurogenesis. (A) Representative images showing immunoreactivity for β-III-tubulin (βIIItub; green) after oligomeric Aβ42 treatment. Scale bar, 50 µM. (B) Analysis of the percentage of β-III-tubulin+/total cells after oligomeric Aβ42 treatment. (C) Relative expression levels of TUBB3 mRNA by qRT-PCR after oligomeric Aβ42 treatment. (D) Representative images showing immunoreactivity for β-III-tubulin (βIIItub; green) after fibrillary Aβ42 treatment. Scale bar, 50 µM. (E) Analysis of the percentage of β-III-tubulin+/total cells after fibrillary Aβ42 treatment. (F) Relative expression levels of TUBB3 mRNA by qRT-PCR after fibrillary Aβ42 treatment. (G) Percentage of β-III-tubulin+/total cells comparing both added forms. Cell nuclei in A and D were counterstained by Höechst (blue). Data are represented as means ± SD of at least three different experiments (n = 3). Statistical significance of one-way ANOVA with post hoc Tukey test; * p < 0.05; ** p < 0.01; *** p < 0.001; ns = not significant.
Figure 5
Figure 5
Role of oligomeric and fibrillary Aβ42 in gliogenesis. (A) Immunoreactivity for GFAP (red) after oligomeric Aβ42 treatment. Scale bar, 50 µM. (B) Analysis of the percentage of GFAP+/total cells in the different groups tested after oligomeric Aβ42 treatment. (C) Relative expression levels of GFAP mRNA obtained by qRT-PCR after oligomeric Aβ42 treatment. (D) Immunoreactivity for GFAP (green) after fibrillary Aβ42 treatment. Scale bar, 50 µM. (E) Analysis of the percentage of GFAP+/total cells in the different groups tested after fibrillary Aβ42 treatment. (F) Relative expression levels of GFAP mRNA obtained by qRT-PCR after fibrillary Aβ42 treatment. (G) Percentage of GFAP+/total cells comparing both added forms. Cell nuclei in A and D were counterstained by Höechst (blue). Data are represented as means ± SD of at least three different experiments (n = 3). Statistical significance of one-way ANOVA with post hoc Tukey test; * p < 0.05; ** p < 0.01; *** p < 0.001; ns = not significant.
Figure 6
Figure 6
Summary of the effects of Aβ42 peptide (oligomeric and fibrillary) on cell death, proliferation, and differentiation of NSCs. Positive effects are indicated by upward arrows. Negative effects are indicated by downward arrows.

Similar articles

Cited by

References

    1. Shin W.S., Di J., Cao Q., Li B., Seidler P.M., Murray K.A., Bitan G., Jiang L. Amyloid β-protein oligomers promote the uptake of tau fibril seeds potentiating intracellular tau aggregation. Alzheimers Res. Ther. 2019;11:86. doi: 10.1186/s13195-019-0541-9. - DOI - PMC - PubMed
    1. Chow V.W., Mattson M.P., Wong P.C., Gleichmann M. An overview of APP processing enzymes and products. Neuromolecular Med. 2010;12:1–12. doi: 10.1007/s12017-009-8104-z. - DOI - PMC - PubMed
    1. Fontana I.C., Zimmer A.R., Rocha A.S., Gosmann G., Souza D.O., Lourenco M.V., Ferreira S.T., Zimmer E.R. Amyloid-β oligomers in cellular models of Alzheimer’s disease. J. Neurochem. 2020;155:348–369. doi: 10.1111/jnc.15030. - DOI - PubMed
    1. Forloni G., Balducci C. Alzheimer’s Disease, Oligomers, and Inflammation. J. Alzheimers Dis. 2018;62:1261–1276. doi: 10.3233/JAD-170819. - DOI - PMC - PubMed
    1. Ferreira S.T., Lourenco M.V., Oliveira M.M., De Felice F.G. Soluble amyloid-β oligomers as synaptotoxins leading to cognitive impairment in Alzheimer´s disease. Front. Cell Neurosci. 2015;9:191. doi: 10.3389/fncel.2015.00191. - DOI - PMC - PubMed

Publication types

MeSH terms

LinkOut - more resources