

Relationships of Gut Microbiota Composition, Short-Chain Fatty Acids and Polyamines with the Pathological Response to Neoadjuvant Radiochemotherapy in Colorectal Cancer Patients
- PMID: 34502456
- PMCID: PMC8430739
- DOI: 10.3390/ijms22179549
Relationships of Gut Microbiota Composition, Short-Chain Fatty Acids and Polyamines with the Pathological Response to Neoadjuvant Radiochemotherapy in Colorectal Cancer Patients
Abstract
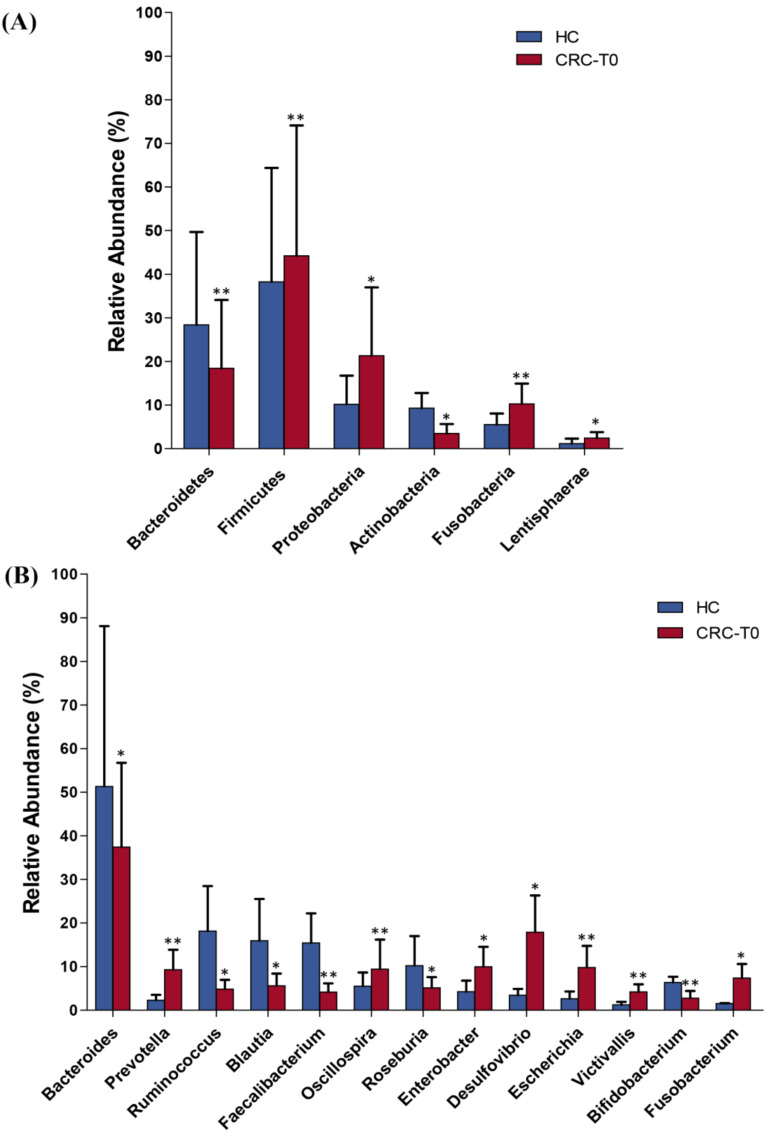
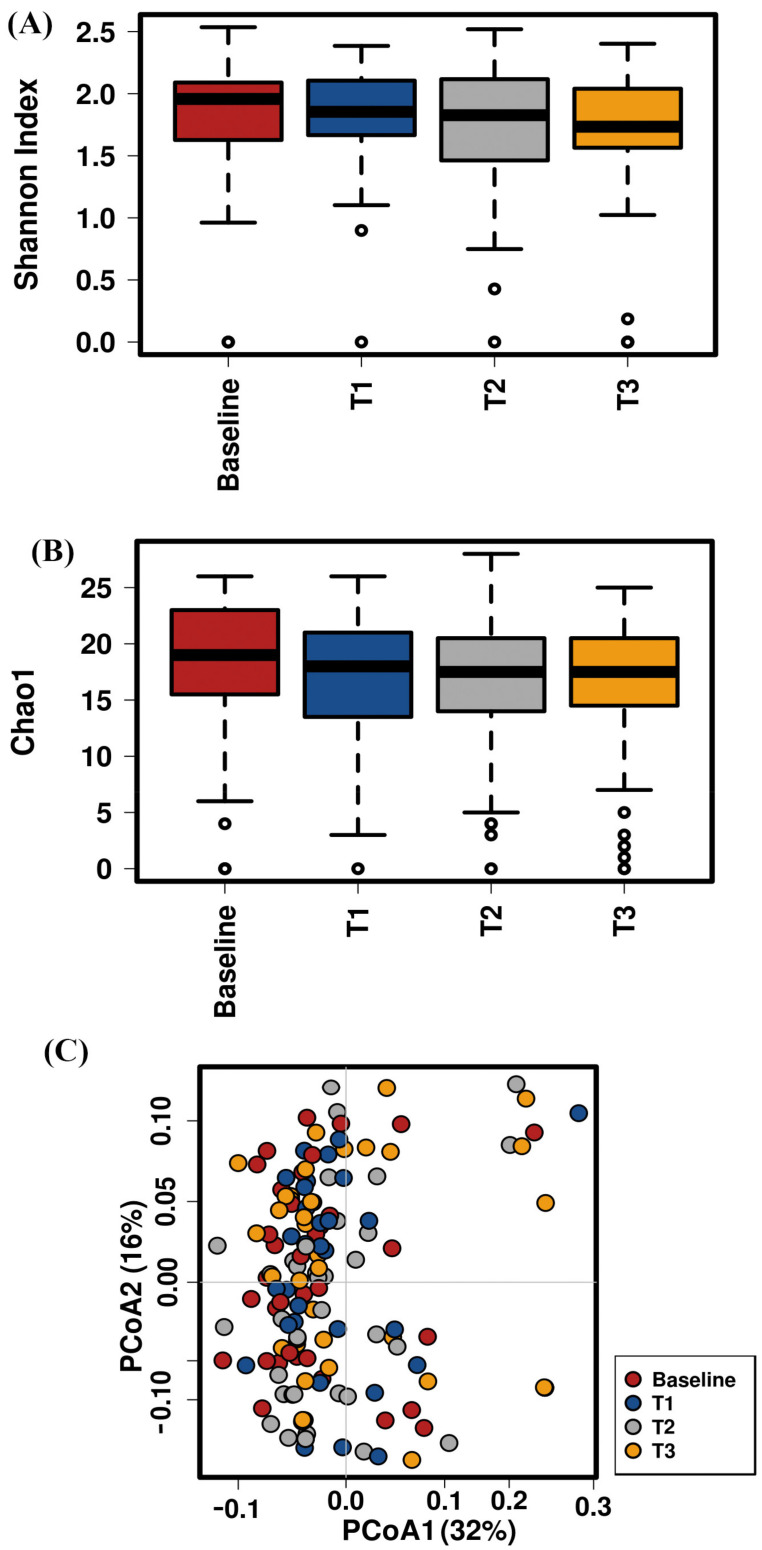
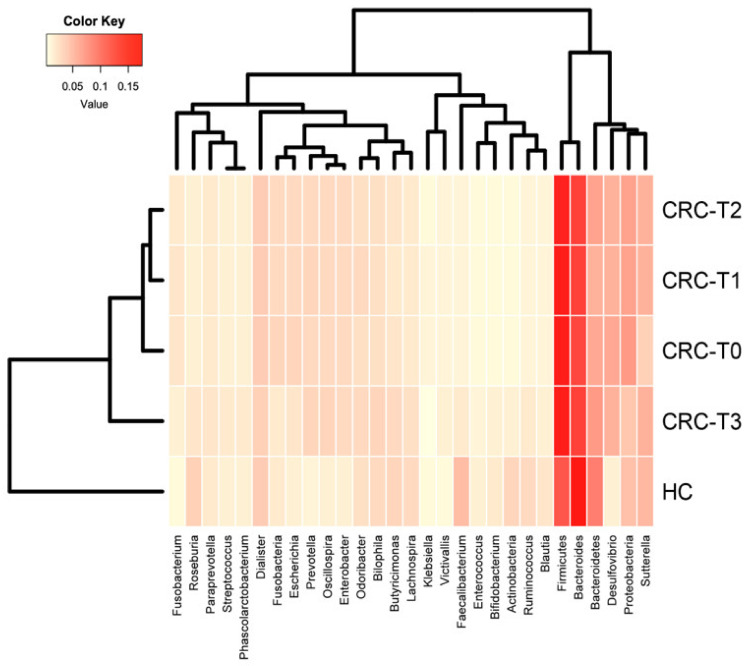
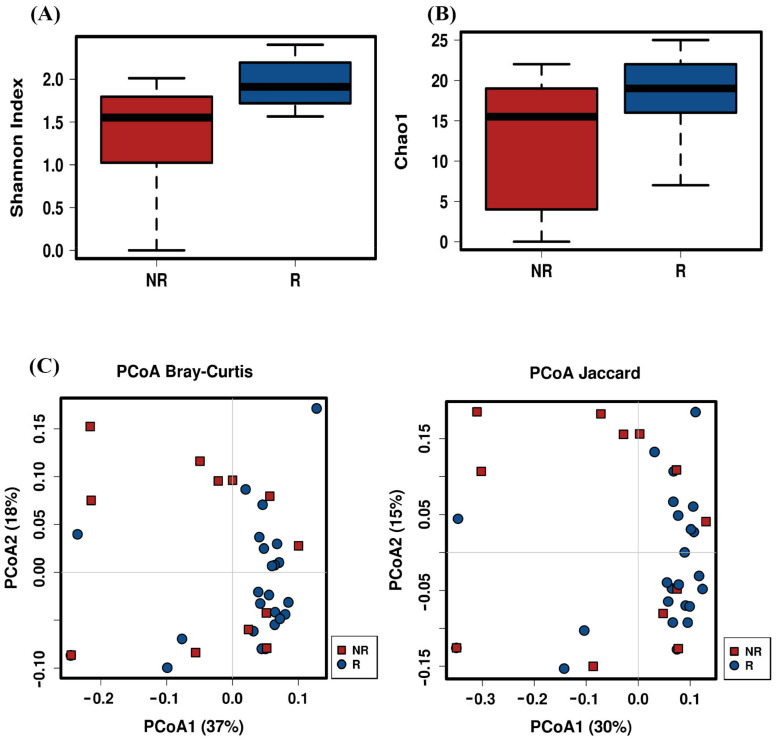
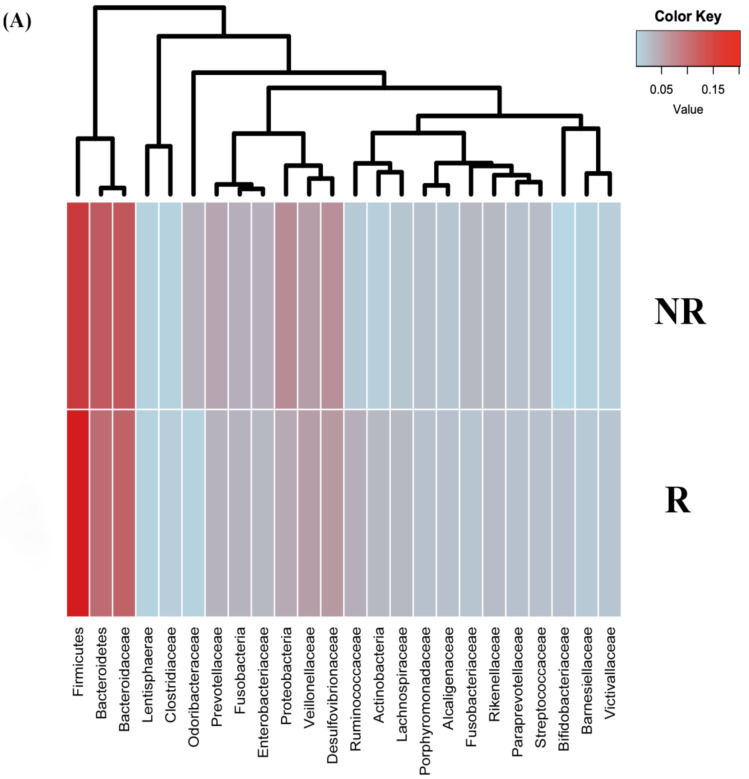
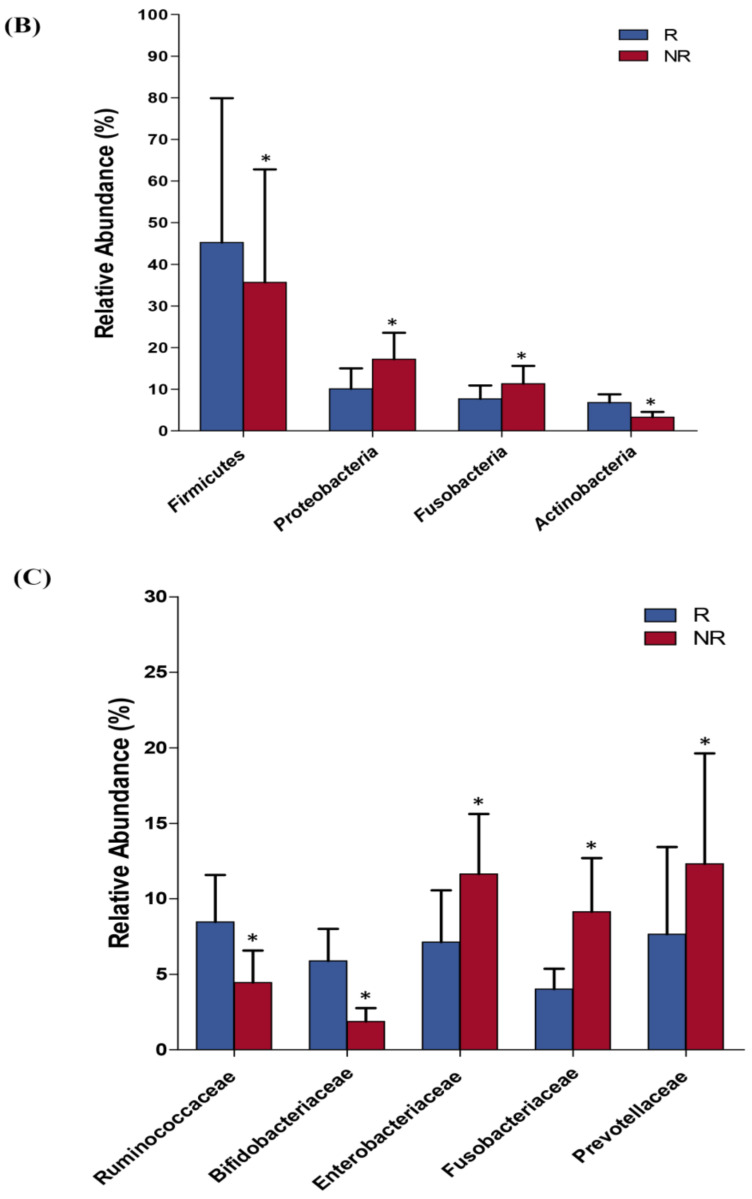
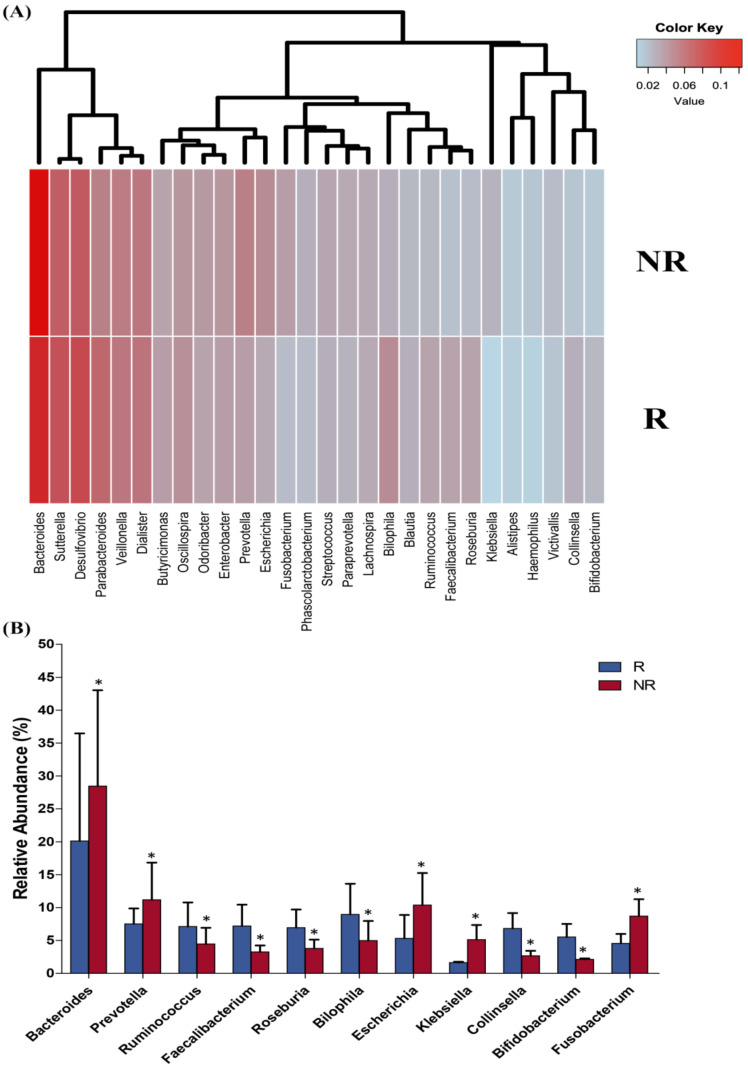
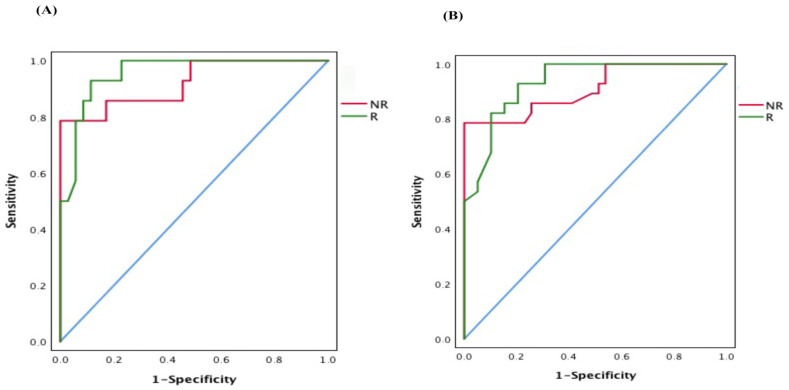
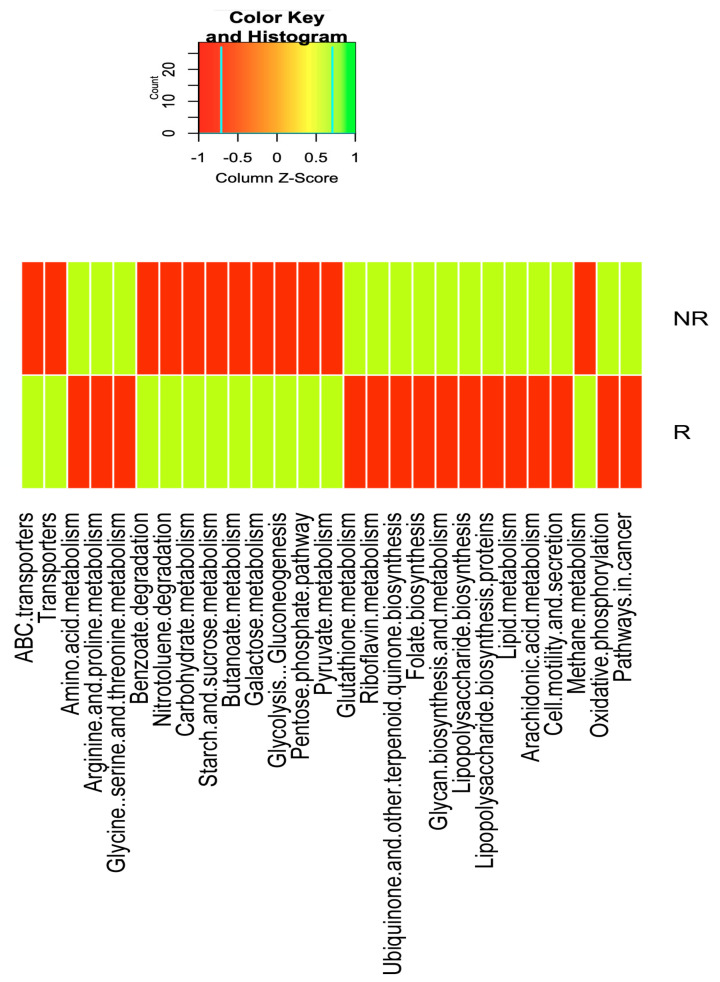
Emerging evidence has suggested that dysbiosis of the gut microbiota may influence the drug efficacy of colorectal cancer (CRC) patients during cancer treatment by modulating drug metabolism and the host immune response. Moreover, gut microbiota can produce metabolites that may influence tumor proliferation and therapy responsiveness. In this study we have investigated the potential contribution of the gut microbiota and microbial-derived metabolites such as short chain fatty acids and polyamines to neoadjuvant radiochemotherapy (RCT) outcome in CRC patients. First, we established a profile for healthy gut microbiota by comparing the microbial diversity and composition between CRC patients and healthy controls. Second, our metagenomic analysis revealed that the gut microbiota composition of CRC patients was relatively stable over treatment time with neoadjuvant RCT. Nevertheless, treated patients who achieved clinical benefits from RTC (responders, R) had significantly higher microbial diversity and richness compared to non-responder patients (NR). Importantly, the fecal microbiota of the R was enriched in butyrate-producing bacteria and had significantly higher levels of acetic, butyric, isobutyric, and hexanoic acids than NR. In addition, NR patients exhibited higher serum levels of spermine and acetyl polyamines (oncometabolites related to CRC) as well as zonulin (gut permeability marker), and their gut microbiota was abundant in pro-inflammatory species. Finally, we identified a baseline consortium of five bacterial species that could potentially predict CRC treatment outcome. Overall, our results suggest that the gut microbiota may have an important role in the response to cancer therapies in CRC patients.
Keywords: SCFAs; colorectal cancer; gut microbiota; gut permeability; radiochemotherapy; treatment outcome.
Conflict of interest statement
The authors declare no conflict of interests.
Figures
Similar articles
-
Evaluation and comparison of short chain fatty acids composition in gut diseases.World J Gastroenterol. 2019 Sep 28;25(36):5543-5558. doi: 10.3748/wjg.v25.i36.5543. World J Gastroenterol. 2019. PMID: 31576099 Free PMC article.
-
Pectin supplement significantly enhanced the anti-PD-1 efficacy in tumor-bearing mice humanized with gut microbiota from patients with colorectal cancer.Theranostics. 2021 Feb 19;11(9):4155-4170. doi: 10.7150/thno.54476. eCollection 2021. Theranostics. 2021. PMID: 33754054 Free PMC article.
-
Gut Microbiota-Mediated Inflammation and Gut Permeability in Patients with Obesity and Colorectal Cancer.Int J Mol Sci. 2020 Sep 16;21(18):6782. doi: 10.3390/ijms21186782. Int J Mol Sci. 2020. PMID: 32947866 Free PMC article.
-
Gut microbiota-derived short-chain fatty acids and colorectal cancer: Ready for clinical translation?Cancer Lett. 2022 Feb 1;526:225-235. doi: 10.1016/j.canlet.2021.11.027. Epub 2021 Nov 26. Cancer Lett. 2022. PMID: 34843863 Review.
-
Microbiota and beneficial metabolites in colorectal cancer.Adv Genet. 2024;112:367-409. doi: 10.1016/bs.adgen.2024.08.002. Epub 2024 Sep 26. Adv Genet. 2024. PMID: 39396841 Review.
Cited by
-
Gut microbiota-derived short-chain fatty acids regulate gastrointestinal tumor immunity: a novel therapeutic strategy?Front Immunol. 2023 Apr 14;14:1158200. doi: 10.3389/fimmu.2023.1158200. eCollection 2023. Front Immunol. 2023. PMID: 37122756 Free PMC article. Review.
-
Isobutyric acid enhances the anti-tumour effect of anti-PD-1 antibody.Sci Rep. 2024 May 17;14(1):11325. doi: 10.1038/s41598-024-59677-1. Sci Rep. 2024. PMID: 38760458 Free PMC article.
-
Dietary fibre supplementation enhances radiotherapy tumour control and alleviates intestinal radiation toxicity.Microbiome. 2024 May 14;12(1):89. doi: 10.1186/s40168-024-01804-1. Microbiome. 2024. PMID: 38745230 Free PMC article.
-
The role of gut microbiota and metabolites in cancer chemotherapy.J Adv Res. 2024 Oct;64:223-235. doi: 10.1016/j.jare.2023.11.027. Epub 2023 Nov 26. J Adv Res. 2024. PMID: 38013112 Free PMC article. Review.
-
Relationships between the Microbiome and Response to Neoadjuvant Chemoradiotherapy in Locally Advanced Rectal Cancer.Cancer Res Treat. 2025 Jul;57(3):840-851. doi: 10.4143/crt.2024.521. Epub 2024 Dec 16. Cancer Res Treat. 2025. PMID: 39701092 Free PMC article.
References
-
- Arnold D., Lueza B., Douillard J.Y., Peeters M., Lenz H.J., Venook A., Heinemann V., Van Cutsem E., Pignon J.P., Tabernero J., et al. Prognostic and predictive value of primary tumour side in patients with RAS wild-type metastatic colorectal cancer treated with chemotherapy and EGFR directed antibodies in six randomized trials. Ann. Oncol. 2017;28:1713–1729. doi: 10.1093/annonc/mdx175. - DOI - PMC - PubMed
MeSH terms
Substances
Grants and funding
- CPI13/00003/Miguel Servet Type II" program, ISCIII, Spain; co-funded by the Fondo Europeo de Desarrollo Regional-FEDER
- C-0030-2018/"Nicolas Monardes" research program of the Consejería de Salud, Junta de Andalucía, Spain
- CP19/00098/Miguel Servet Type I" program, ISCIII, Spain; co-funded by the Fondo Europeo de Desarrollo Regional-FEDER
- PE-0106-2019/Predoctoral grant from the Consejería de Salud y Familia, co-funded by the Fondo Europeo de Desarrollo Regional-FEDER, Andalucia, Spain
- FI19-00112/predoctoral grant PFIS-ISCIII, co-funded by the Fondo Europeo de Desarrollo Regional-FEDER, Madrid, Spain.
