. 2021 Sep 4;22(17):9599.
doi: 10.3390/ijms22179599.

Functional Characterization of the Stipa purpurea P5CS Gene under Drought Stress Conditions

Affiliations

Functional Characterization of the Stipa purpurea P5CS Gene under Drought Stress Conditions

Danni Yang et al. Int J Mol Sci. .

Abstract

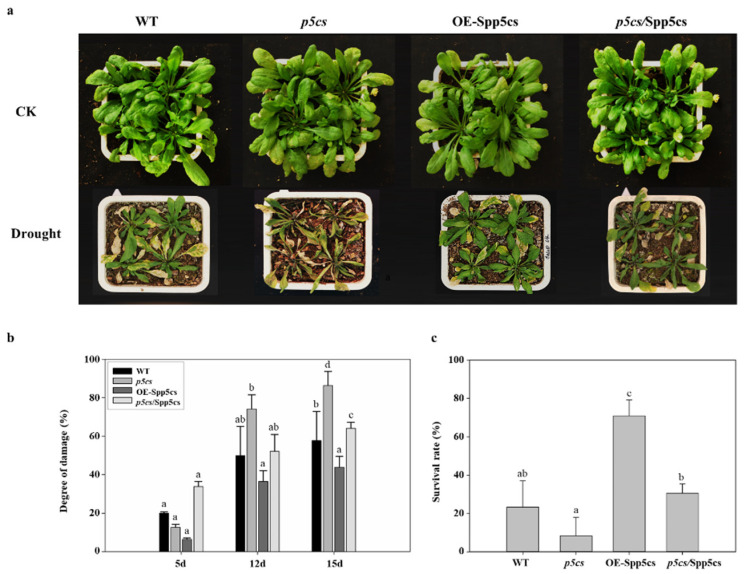
Free proline has multiple functions in plant cells, such as regulating osmotic potential and protecting both proteins and cell membranes. The expression of Δ1-Pyrroline-5-carboxylate synthase (P5CS), a key enzyme in the proline biosynthetic pathway, increases under drought, salt and cold stress conditions, causing plant cells to accumulate large amounts of proline. In this study, we cloned and identified the P5CS gene from Stipa purpurea, which has a full-length of 2196 bp and encodes 731 amino acids. A subcellular localization analysis indicated that SpP5CS localized to the cytoplasm. The ectopic overexpression of SpP5CS in Arabidopsis thaliana resulted in higher proline contents, longer roots, higher survival rates and less membrane damage under drought stress conditions compared with wild-type controls. SpP5CS-overexpressing A. thaliana was more resistant to drought stress than the wild type, whereas the deletion mutant sp5cs was less resistant to drought stress. Thus, SpP5CS may be a potential candidate target gene for increasing plant resistance to drought stress.

Keywords: P5CS; Stipa purpurea; drought tolerance; proline.


Conflict of interest statement

The authors declare no conflict of interest.

Figures

Figure 1
Figure 1
Sequences analysis of SpP5CS. (a) Multiple sequence alignment of SpP5CS and homologous proteins from other species. Legend shows the γ-glutamyl kinase (GK; 30–275 bp) and glutamic-γ-semialdehyde dehydrogenase (GSA DH; 299–600 bp) domains; (b) A phylogenetic tree constructed using SpP5CS and P5CS proteins from other plant species. BdP5CS2 (B. distachyon, XP_003564608.1), LpP5CS (L. perenne, AGQ04179.1), TaP5CS (T. aestivum:KAF7024610.1), AeP5CS2 (A. tauschii, XP_020198194.1), OsP5CS1 (O. sativa, O04226.2), OsP5CS2 (O. sativa, BAB64280.1), ObP5CS2 (O. brachyantha, XP_006645010.2), ZmP5CS1 (Z. mays, AQK99427.1), ZmP5CSB(Z. mays, AQK86404.1), ZmP5CSB-like (Z. mays, NP_001339256), SbP5CS1 (S. bicolor, ACU65226.1), SbP5CS2 (S. bicolor, ACU65227.1), AtP5CS1 (A. thaliana, P54887.1), AtP5CS2 (A. thaliana, P54888.1), HtP5CS1 (H. tuberosus, AHJ08569.1), HtP5CS2 (H. tuberosus,AHJ08570.1), LrP5CS1 (L. regale, KT972374), LrP5CS2 (L. regale, KT972375), LrP5CS3 (L. regale, KT972376), MtP5CS1 (M. truncatula, CAC82184.1), MtP5CS2 (M. truncatula, AET87351.1), MtP5CS3 (M. truncatula, AET35478.1), PvP5CS1 (P. vulgaris, ABY61079.1), PvP5CS2 (P. vulgaris, ABY89287.1), BnP5CS1 (B. napus, AF314811), BnP5CS2 (B. napus, AF314812) and SiP5CS2 (S. italica, XP_004970573.1).
Figure 2
Figure 2
qPCR analysis of the expression levels of SpP5CS under cold, salt, drought and soil drought stress conditions. The experiment has three biological replicates, and the error bar denotes the standard deviation. The data are analyzed by one-way ANOVA (Tukey’s test). Different letters indicate significant differences among the relative expression levels of the genes at p < 0.05.
Figure 3
Figure 3
RT-PCR identification of SpP5CS and the subcellular localization of the 35S:SpP5CS-GFP fusion protein. (a) The RT-PCR identification of lines 1-6 of OE-SpP5CS A. thaliana; (b) Subcellular localization of the 35S:SpP5CS-GFP fusion protein in the root tips and leaf mesophyll protoplasts of transgenic A. thaliana.
Figure 4
Figure 4
Root length analysis of WT, OE-SpP5CS, p5cs/SpP5CS-complemented and p5cs mutant A. thaliana seedlings in response to drought stress. (a) Growth of plants under drought stress conditions. Seeds were grown on the 1/2 MS medium and 1/2 MS medium supplemented with 5% PEG 6000 for 10 d; (b) Root lengths of WT, OE-SpP5CS, p5cs/SpP5CS-complemented and p5cs mutant plants grown under normal and drought stress conditions. Data were obtained from three independent experiments. Each column represents the mean ± SD, and the error bar denotes the standard deviation. Different letters indicate significant differences in the root length (one way ANOVA, Tukey’s test, p < 0.05).
Figure 5
Figure 5
Phenotypic and membrane damage analyses of WT, OE-SpP5CS, p5cs/SpP5CS-complemented and p5cs mutant A. thaliana plants. (a) Phenotypes of WT, OE-SpP5CS, p5cs/SpP5CS-complemented and p5cs mutant plants in response to 12 days of soil drought stress. CK is the control group under the condition of normal irrigation; (b) Comparison of the degree of membrane damage among WT, SpP5CS, p5cs/SpP5CS-complemented and p5cs mutant plants in response to soil drought stress; (c) Comparison of the survival rates among WT, SpP5CS, p5cs/SpP5CS-complemented and p5cs mutant plants after 12 days of soil drought stress. The soil drought treatment adopts continuous withholding water. The experiment has three biological and technical replicates. The data are expressed as the mean ± SD from three independent experiments. Different letters indicate significant differences in the degree of damage or survival rate (one-way ANOVA, Tukey’s test, p < 0.05).
Figure 6
Figure 6
Proline contents of WT, OE-SpP5CS, p5cs/SpP5CS-complemented and p5cs mutant plants after the soil drought treatment. The soil drought treatment adopts continuous withholding water. CK is the control group under the condition of normal irrigation. The experiment has three biological and technical replicates. Data are the mean values ± SD obtained from three independent experiments (error bars = SD, n = 15). Different letters indicate significant differences in the proline content (one-way ANOVA, Tukey’s test, p < 0.05).

References

    1. Geng G., Wu J., Wang Q., Lei T., He B., Li X., Mo X., Luo H., Zhou H., Liu D. Agricultural drought hazard analysis during 1980–2008: A global perspective. Int. J. Climatol. 2016;36:389–399. doi: 10.1002/joc.4356. - DOI
    1. Basu S., Ramegowda V., Kumar A., Pereira A. Plant adaptation to drought stress. F1000Research. 2016;5:1554. doi: 10.12688/f1000research.7678.1. - DOI - PMC - PubMed
    1. Hassan N., El-bastawisy Z., Ebeed H., Nemat Alla M.N. Role of defense enzymes, proteins, solutes and Δ1-pyrroline-5-carboxylate synthase in wheat tolerance to drought. Rend. Fis. Acc. Lincei. 2015;26:281–291. doi: 10.1007/s12210-015-0429-y. - DOI
    1. Verbruggen N., Hermans C. Proline accumulation in plants: A review. Amino Acids. 2008;35:753–759. doi: 10.1007/s00726-008-0061-6. - DOI - PubMed
    1. Ebeed H.T., Hassan N.M., Keshta M.M., Hassanin O.S. Comparative analysis of seed yield and biochemical attributes in different sunflower genotypes under different levels of irrigation and salinity. Egypt. J. Bot. 2019;59:339–355. doi: 10.21608/ejbo.2019.5043.1205. - DOI

MeSH terms

LinkOut - more resources