Review
. 2021 Aug 26;13(17):4295.
doi: 10.3390/cancers13174295.

Diagnostic and Prognostic Performance of Liquid Biopsy-Derived Exosomal MicroRNAs in Thyroid Cancer Patients: A Systematic Review and Meta-Analysis

Affiliations
Review

Diagnostic and Prognostic Performance of Liquid Biopsy-Derived Exosomal MicroRNAs in Thyroid Cancer Patients: A Systematic Review and Meta-Analysis

Eman A Toraih et al. Cancers (Basel). .

Abstract

Circulatory tumor-derived exosomal microRNAs (miRNAs) play key roles in cancer development/progression. We aimed to assess the diagnostic/prognostic value of circulating exosomal miRNA in thyroid cancer (TC). A search in PubMed, Scopus, Web of Science, and Science Direct up to 22 May 2021 was performed. The true/false positive (TP/FP) and true/false negative (TN/FN) rates were extracted from each eligible study to obtain the pooled sensitivity, specificity, positive/negative likelihood ratios (PLR/NLR), diagnostic odds ratio (DOR), and their 95% confidence intervals (95%CIs). The meta-analysis included 12 articles consisting of 1164 Asian patients and 540 controls. All miRNAs were quantified using qRT-PCR assays. The pooled sensitivity was 82% (95%CI = 77-86%), pooled specificity was 76% (95%CI = 71-80%), and pooled DOR was 13.6 (95%CI = 8.8-21.8). The best biomarkers with high sensitivity were miR-16-2-3p (94%), miR-223-5p (91%), miR-130a-3p (90%), and miR182-5p (94%). Similarly, they showed high specificity, in addition to miR-34c-5p. Six panels of two to four exosomal miRNAs showed higher diagnostic values with an area under the curve (AUC) ranging from 0.906 to 0.981. The best discriminative ability to differentiate between cancer and non-cancer individuals was observed for miR-146b-5p + miR-223-5p + miR-182-5p (AUC = 0.981, sensitivity = 93.8% (84.9-98.3), specificity = 92.9% (76.5-99.1)). In conclusion, the expression levels of exosomal miRNAs could predict TC.

Keywords: exosomal microRNAs; liquid biopsy; meta-analysis; miRNA; thyroid cancer.


Conflict of interest statement

The authors declare no conflict of interest.

Figures
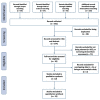
Figure 1
Figure 1
Flow chart describing search strategy. Workflow of study selection according to the PRISMA guidelines [22].
Figure 2
Figure 2
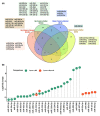
Deregulated exosomal miRNAs in thyroid cancer. (A) Venn diagram shows the intersection between aberrantly expressed miRNAs across studies with different comparisons [25,26,28,30,31,32,33,34,35]. The Venn diagram was plotted online (http://www.interactivenn.net/) (accessed on 15 July 2021) [36]. (B) The lollipop plot shows the fold change of deregulated miRNAs in datasets comparing cancer versus normal and cancer versus nodular goiter. Only miRNAs with reported expression level values are shown [30,32,33,35]. R package ‘ggplot2′ and ‘ggpubr’ were used.
Figure 3
Figure 3
Sensitivity and specificity of exosomal miRNAs stratified by type of comparison. Each row in the forest plot represented the miRNA result of a study/dataset. Estimate and confidence intervals are shown as box and bar. Pooled result of the subgroup analysis is shown separately in red (cancer versus normal) and green (cancer versus nodular goiter) diamonds. Heterogeneity was assessed using the Q test, and the magnitude of heterogeneity was quantified using I2. If I2 exceeded 50%, heterogeneity across studies was reported, and random-effects model results were considered; otherwise, a fixed-effects model was used. The final overall results are illustrated in the lower panel with grey diamonds. (A) Forest plot for the sensitivity of testing exosomal miRNAs. (B) Forest plot for the specificity of testing exosomal miRNAs. R package ‘meta’ was used.
Figure 4
Figure 4
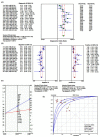
Effectiveness of exosomal miRNAs as a diagnostic test. All tested miRNAs were upregulated in cancer patients except miR-130a-3p, miR-29a, miR-34c-5p, miR-182, 5p, and miR-5010-3p. (A) Diagnostic odds ratio. It is defined as the odds of the test being positive if the subject has cancer relative to the odds of the test being positive if the subject does not have the disease (=PLR/NLR). The higher diagnostic odds ratios are indicative of better test performance. The DerSimonian–Laird pooling method was used [37]. (B) Negative likelihood ratio. It gives the odds of having a diagnosis in patients with a negative test. The change is in the form of a ratio, usually less than 1. The smaller the -LR, the more informative the test. (C) Positive likelihood ratio. It is the ratio of the probability that a positive test result is expected in a diseased individual to the probability that a positive result occurs in a healthy subject. It tells us how many times it is more likely to observe a positive test result in a diseased than in a healthy individual. The more the likelihood ratio for a positive test (+LR) is greater than 1, the more likely the disease is. (D) Fagan’s Bayesian nomogram for the 18 combined miRNA panel. Lines are then drawn from the prior probability on the left through the likelihood ratios in the center and extended to the posterior probabilities on the right. Pretest probability on the left vertical line, likelihood ratio in the middle vertical line. The predicted posttest probability is on the right vertical line. Pooled results showed a moderate shift in posttest probability. With the prior probability of 50%, the probability of the disease increases to 76% (95%CI = 74–78%) with positive test results and decreases the probability of having the disease to 20% (95%CI = 17–22%) in the presence of a negative test. (E) Summary ROC curve. It is created by plotting the true positive rate (sensitivity) against the false positive rate (1-specificity). Symmetric sROC curve fitted using Moses’ Model (weighted regression: inverse variance). Significant miRNA testing for cancer versus normal in red circles and for cancer versus nodular goiter in yellow circles. The position of the dots depends on their discriminatory ability; the more accurate the test is, the closer the curve to the upper left-hand corner of the ROC plot. The middle blue line indicates the estimated sROC curve, surrounded by two other lines for the 95% confidence region for the summary estimate. Q* is the point of the curve in which sensitivity equals specificity. Meta-DiSc v1.4 was used for meta-analysis (https://meta-disc.software.informer.com/1.4/) (accessed on 8 June 2021) [38].
Figure 5
Figure 5
Comparison of the diagnostic accuracy of various miRNA-based panels. Area under the curve (AUC) and 95% confidence interval (CI) of the receiver operator characteristic curve analysis for each panel are plotted [30,32,35]. The threshold for optimum diagnostic accuracy was set at 0.75. Subgroup analysis for exosomal miRNA expression was carried out based on the type of comparison. (A) Cancer compared to normal subjects; (B) cancer compared to nodular goiter.
Figure 6
Figure 6
Univariate and multivariate analyses of the prognostic factors for exosomal miRNAs. (A) for the lymph node metastasis; (B) for the overall survival. Data are shown as relative risk and 95% confidence interval for univariate and multivariate analyses [21,28].
Figure 7
Figure 7
Functional enrichment analysis. (A) KEGG pathway enrichment. Top enriched pathways are represented in a scatter plot. The vertical axis represents the pathname, and the horizontal axis represents the q-value. The color of the point represents the size of the q-value. The number of differential genes included in each pathway is expressed by the size of the point. (B) The vertical axis represents the gene ontology term, and the horizontal axis represents the number of gene targets (hits) for 3′UTR, CDS, and 5′UTR in that GO. The top significantly enriched terms with q values < 0.05 were considered. Data source: MirWalk 3.0 (http://mirwalk.umm.uni-heidelberg.de/) (accessed on 12 June 2021), using the following filter: 0.95, Targetscan, miRDB, and miRTarbase.

References

    1. Siegel R.L., Miller K.D., Jemal A. Cancer statistics, 2018. CA Cancer J. Clin. 2018;68:7–30. doi: 10.3322/caac.21442. - DOI - PubMed
    1. Siegel R.L., Miller K.D., Jemal A. Cancer statistics, 2017. CA Cancer J. Clin. 2017;67:7–30. doi: 10.3322/caac.21387. - DOI - PubMed
    1. Yoon R.G., Baek J.H., Lee J.H., Choi Y.J., Hong M.J., Song D.E., Kim J.K., Yoon J.H., Kim W.B. Diagnosis of Thyroid Follicular Neoplasm: Fine-Needle Aspiration Versus Core-Needle Biopsy. Thyroid. 2014;24:1612–1617. doi: 10.1089/thy.2014.0140. - DOI - PubMed
    1. Guille J.T., Opoku-Boateng A., Thibeault S.L., Chen H. Evaluation and Management of the Pediatric Thyroid Nodule. Oncologist. 2014;20:19–27. doi: 10.1634/theoncologist.2014-0115. - DOI - PMC - PubMed
    1. Papini E., Guglielmi R., Bianchini A., Crescenzi A., Taccogna S., Nardi F., Panunzi C., Rinaldi R., Toscano V., Pacella C.M. Risk of Malignancy in Nonpalpable Thyroid Nodules: Predictive Value of Ultrasound and Color-Doppler Features. J. Clin. Endocrinol. Metab. 2002;87:1941–1946. doi: 10.1210/jcem.87.5.8504. - DOI - PubMed

LinkOut - more resources