

Prevalence and physical characteristics of locomotive syndrome stages as classified by the new criteria 2020 in older Japanese people: results from the Nagahama study
- PMID: 34503459
- PMCID: PMC8428127
- DOI: 10.1186/s12877-021-02440-2
Prevalence and physical characteristics of locomotive syndrome stages as classified by the new criteria 2020 in older Japanese people: results from the Nagahama study
Abstract
Background: The Japanese Orthopaedic Association (JOA) proposed the concept of locomotive syndrome (LS) in 2007 for detecting high-risk individuals with mobility limitation. In 2020, the JOA revised the clinical decision limits and introduced LS stage 3, which carried the highest-risk for LS compared to the conventional stages, 1 and 2. The purpose of this study was to characterize the prevalence, comorbidities, and physical characteristics in each LS stage, as per the LS criteria 2020.
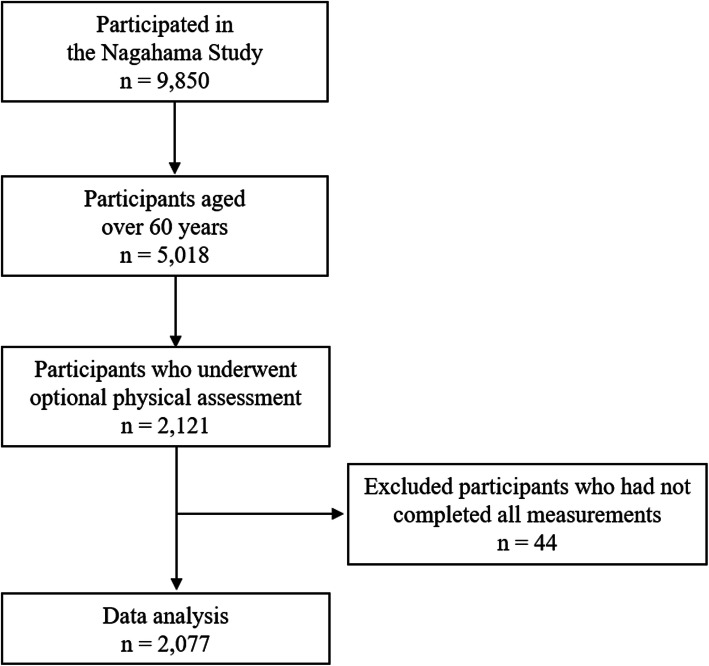
Methods: We analyzed 2077 participants (64.9% women; mean age, 68.3 ± 5.4 years) from the Nagahama Study aged ≥60 years. Participants were classified into 4 groups, non-LS and LS stages 1, 2, and 3, based on a 25-question Geriatric Locomotive Function Scale. The prevalence of comorbidities (sarcopenia, osteoporosis, diabetes mellitus, low back pain [LBP], and knee pain) were investigated. Physical characteristics were measured based on the physical performance tests including gait speed, five-times chair-stand, single-leg stand, and short physical performance battery; muscle strength tests including grip, knee extension, hip flexion, and abduction; and body-composition analysis including muscle quantity and quality. Differences in the prevalence of comorbidities between LS stages were tested using the chi-square test. The general linear model was performed for univariate and multivariate analyses with post-hoc test to compare the differences in physical characteristics among the LS stages.
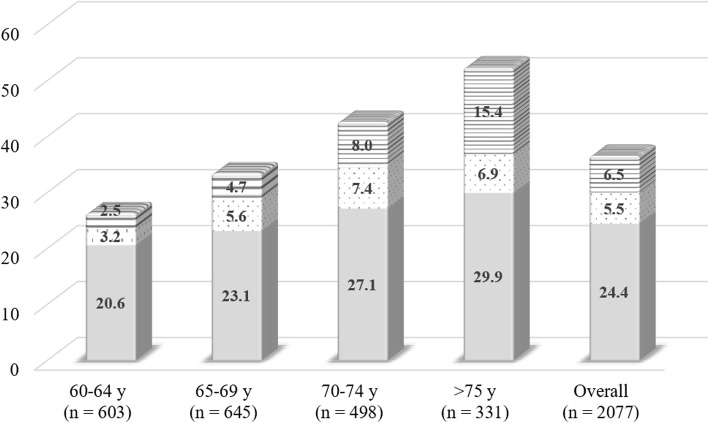
Results: The prevalence of LS increased with age, and the mean prevalence of LS stages 1, 2, and 3 were 24.4, 5.5, and 6.5%, respectively. The prevalence of comorbidities, including sarcopenia, osteoporosis, LBP, and knee pain, increased with worsening LS stage. Physical performance tests were significantly different between LS stages 2 and 3; and muscle strength differed significantly between LS stages 1 and 2. Additionally, in terms of body composition analysis, muscle quality but not muscle quantity showed significant differences among all the LS stages.
Conclusions: Our findings suggest that muscle strengthening and dynamic training, including balance training in LS stage 1 and 2, respectively, were needed for preventing the LS progression. Individuals with LS stage 3 should perform dynamic training and muscle strengthening exercises while receiving treatment for comorbidities.
Keywords: Locomotive syndrome; Physical performance; Prevalence; The 25-question geriatric locomotive function scale.
© 2021. The Author(s).
Conflict of interest statement
The authors declare that they have no competing interests.
Figures

Similar articles
-
Physical performance tests are useful for evaluating and monitoring the severity of locomotive syndrome.J Orthop Sci. 2012 Nov;17(6):782-8. doi: 10.1007/s00776-012-0283-z. Epub 2012 Sep 8. J Orthop Sci. 2012. PMID: 22961424
-
Spinal sagittal balance substantially influences locomotive syndrome and physical performance in community-living middle-aged and elderly women.J Orthop Sci. 2016 Mar;21(2):216-21. doi: 10.1016/j.jos.2015.12.016. Epub 2016 Jan 21. J Orthop Sci. 2016. PMID: 26806334
-
Low back pain significantly influences locomotive syndrome in older people: Evaluation using the 3-stage categories.J Orthop Sci. 2023 May;28(3):662-668. doi: 10.1016/j.jos.2022.03.004. Epub 2022 Mar 31. J Orthop Sci. 2023. PMID: 35370042
-
Clinical characteristics of locomotive syndrome categorised by the 25-question Geriatric Locomotive Function Scale: a systematic review.BMJ Open. 2023 May 16;13(5):e068645. doi: 10.1136/bmjopen-2022-068645. BMJ Open. 2023. PMID: 37192799 Free PMC article.
-
Epidemiology of the locomotive syndrome: The research on osteoarthritis/osteoporosis against disability study 2005-2015.Mod Rheumatol. 2017 Jan;27(1):1-7. doi: 10.1080/14397595.2016.1226471. Mod Rheumatol. 2017. PMID: 27538793 Review.
Cited by
-
Locomotive Syndrome and Lumbar Spine Disease: A Systematic Review.J Clin Med. 2022 Feb 27;11(5):1304. doi: 10.3390/jcm11051304. J Clin Med. 2022. PMID: 35268395 Free PMC article. Review.
-
Laurel Attenuates Dexamethasone-Induced Skeletal Muscle Atrophy In Vitro and in a Rat Model.Nutrients. 2022 May 12;14(10):2029. doi: 10.3390/nu14102029. Nutrients. 2022. PMID: 35631169 Free PMC article.
-
Locomotive Syndrome Digital Therapeutics Provided via a Smartphone App: Protocol for a Single-Group Trial.JMIR Res Protoc. 2025 Apr 17;14:e70163. doi: 10.2196/70163. JMIR Res Protoc. 2025. PMID: 40246298 Free PMC article.
-
Survey of Awareness of Terminology Related to Functional Impairment and Muscle Health among Rehabilitation Healthcare Staff.Ann Geriatr Med Res. 2024 Jun;28(2):231-233. doi: 10.4235/agmr.24.0029. Epub 2024 Apr 8. Ann Geriatr Med Res. 2024. PMID: 38584430 Free PMC article. No abstract available.
-
Evaluation of Sit-to-Stand Movement in Older Adults with Locomotive Syndrome Using the Nintendo Wii Balance Board.Sensors (Basel). 2023 Mar 23;23(7):3368. doi: 10.3390/s23073368. Sensors (Basel). 2023. PMID: 37050428 Free PMC article.
References
-
- Freedman VA, Crimmins E, Schoeni RF, Spillman BC, Aykan H, Kramarow E, Land K, Lubitz J, Manton K, Martin LG, Shinberg D, Waidmann T. Resolving inconsistencies in trends in old-age disability: report from a technical working group. Demography. 2004;41(3):417–441. doi: 10.1353/dem.2004.0022. - DOI - PubMed
-
- Yoshimura N, Muraki S, Iidaka T, Oka H, Horii C, Kawaguchi H, Akune T, Nakamura K, Tanaka S. Prevalence and co-existence of locomotive syndrome, sarcopenia, and frailty: the third survey of research on osteoarthritis/osteoporosis against disability (ROAD) study. J Bone Miner Metab. 2019;37(6):1058–1066. doi: 10.1007/s00774-019-01012-0. - DOI - PubMed
Publication types
MeSH terms
LinkOut - more resources
Full Text Sources
Miscellaneous
