

Genome-wide analysis of blood lipid metabolites in over 5000 South Asians reveals biological insights at cardiometabolic disease loci
- PMID: 34503513
- PMCID: PMC8431908
- DOI: 10.1186/s12916-021-02087-1
Genome-wide analysis of blood lipid metabolites in over 5000 South Asians reveals biological insights at cardiometabolic disease loci
Abstract
Background: Genetic, lifestyle, and environmental factors can lead to perturbations in circulating lipid levels and increase the risk of cardiovascular and metabolic diseases. However, how changes in individual lipid species contribute to disease risk is often unclear. Moreover, little is known about the role of lipids on cardiovascular disease in Pakistan, a population historically underrepresented in cardiovascular studies.
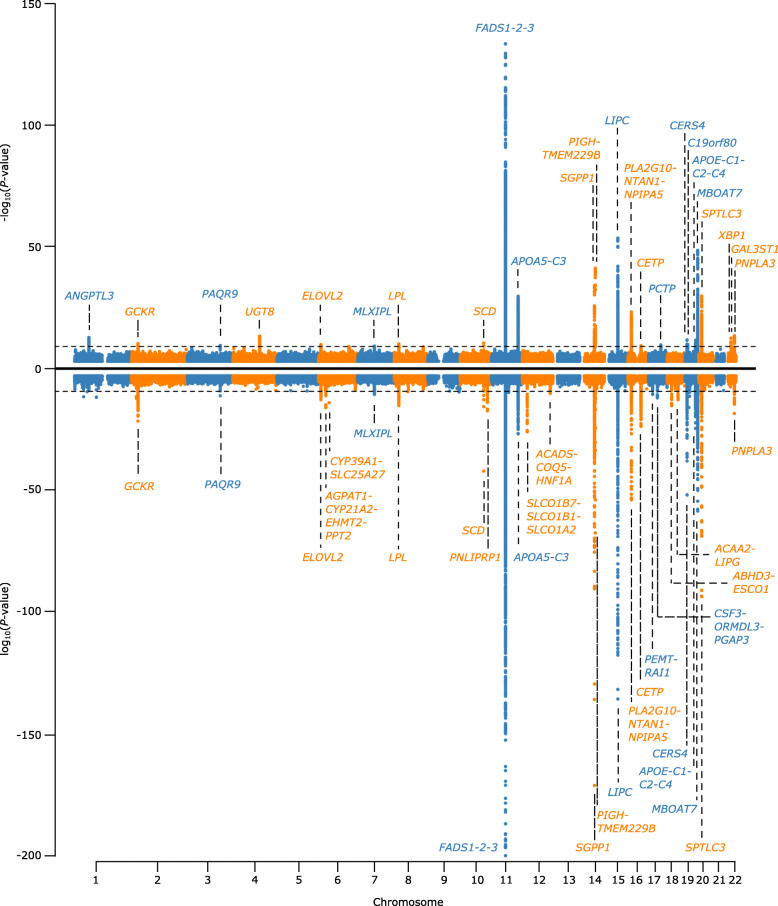
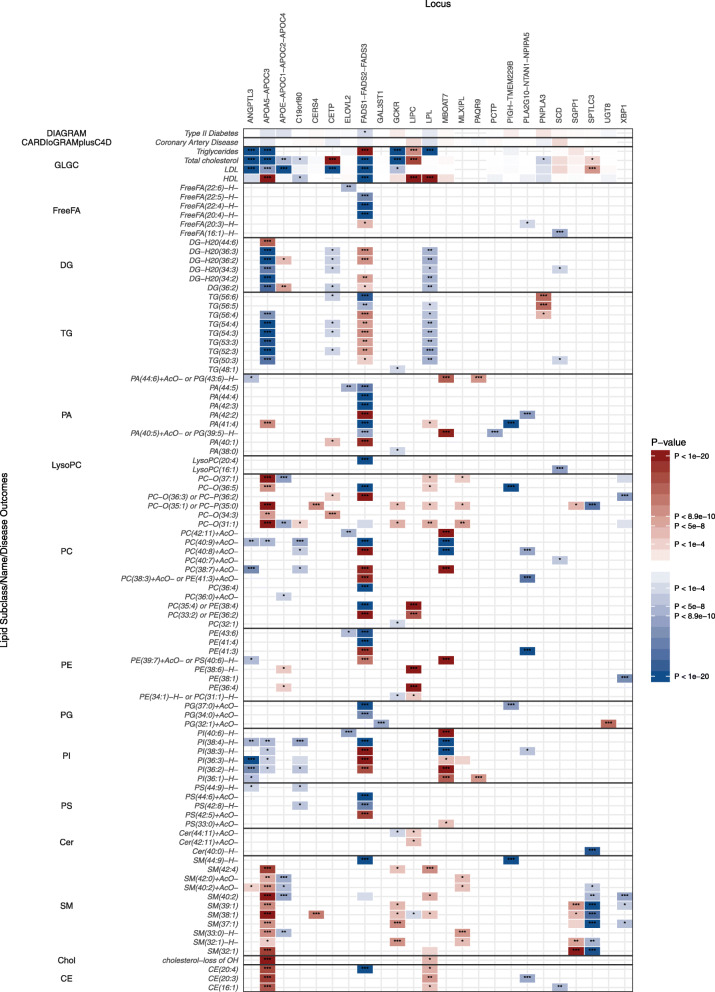
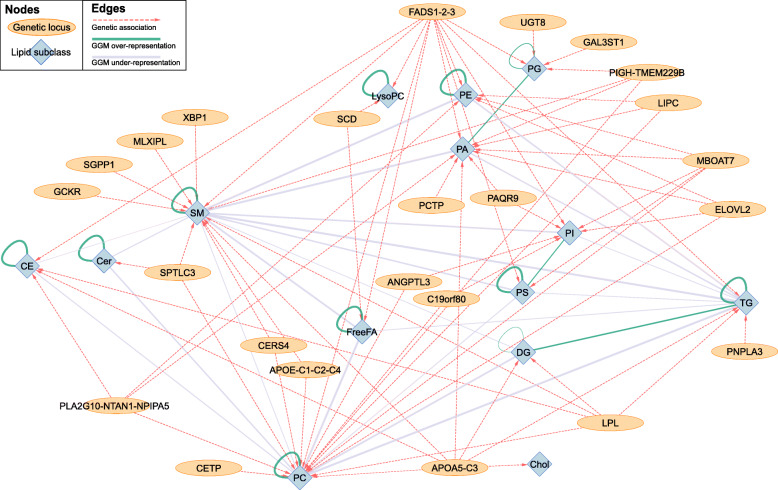
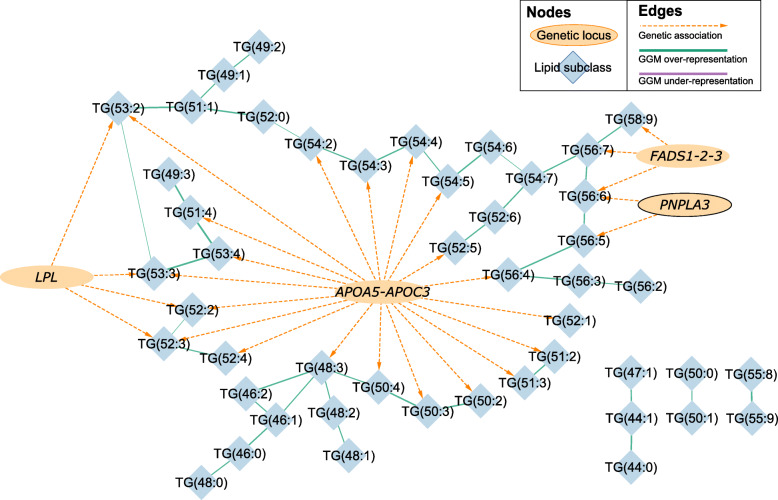
Methods: We characterised the genetic architecture of the human blood lipidome in 5662 hospital controls from the Pakistan Risk of Myocardial Infarction Study (PROMIS) and 13,814 healthy British blood donors from the INTERVAL study. We applied a candidate causal gene prioritisation tool to link the genetic variants associated with each lipid to the most likely causal genes, and Gaussian Graphical Modelling network analysis to identify and illustrate relationships between lipids and genetic loci.
Results: We identified 253 genetic associations with 181 lipids measured using direct infusion high-resolution mass spectrometry in PROMIS, and 502 genetic associations with 244 lipids in INTERVAL. Our analyses revealed new biological insights at genetic loci associated with cardiometabolic diseases, including novel lipid associations at the LPL, MBOAT7, LIPC, APOE-C1-C2-C4, SGPP1, and SPTLC3 loci.
Conclusions: Our findings, generated using a distinctive lipidomics platform in an understudied South Asian population, strengthen and expand the knowledge base of the genetic determinants of lipids and their association with cardiometabolic disease-related loci.
Keywords: Gaussian Graphical Modelling; Genetics; Lipidomics; Network analysis; South Asian.
© 2021. The Author(s).
Conflict of interest statement
E.B.F. and D.Z. are employees and shareholders of Pfizer, Inc. J.D. has received research funding from the British Heart Foundation, the National Institute for Health Research Cambridge Comprehensive Biomedical Research Centre, the Bupa Foundation, diaDexus, the European Research Council, the European Union, the Evelyn Trust, the Fogarty International Centre, GlaxoSmithKline, Merck, the National Heart, Lung, and Blood Institute, the National Institute for Health Research [Senior Investigator Award], the National Institute of Neurological Disorders and Stroke, NHS Blood and Transplant, Novartis, Pfizer, the UK Medical Research Council, and the Wellcome Trust. J.L.G. has received funding from Agilent, Waters, GlaxoSmithKline, Medimmune, Unilever, AstraZeneca, the Medical Research Council, the Biotechnology and Biological Sciences Research Council, the National Institutes of Health, the British Heart Foundation, and the Wellcome Trust. D.Sa. has received funding from Pfizer, Regeneron Pharmaceuticals, Genentech, and Eli Lilly. All other authors declare no competing interests.
Figures
References
-
- Jha P, McDevitt MT, Gupta R, Quiros PM, Williams EG, Gariani K, Sleiman MB, Diserens L, Jochem A, Ulbrich A, Coon JJ, Auwerx J, Pagliarini DJ. Systems analyses reveal physiological roles and genetic regulators of liver lipid species. Cell Syst. 2018;6(6):722–733. doi: 10.1016/J.CELS.2018.05.016. - DOI - PMC - PubMed
-
- Saleheen D, Zaidi M, Rasheed A, Ahmad U, Hakeem A, Murtaza M, Kayani W, Faruqui A, Kundi A, Zaman KS, Yaqoob Z, Cheema LA, Samad A, Rasheed SZ, Mallick NH, Azhar M, Jooma R, Gardezi AR, Memon N, Ghaffar A, Fazal-ur-Rehman, Khan N, Shah N, Shah AA, Samuel M, Hanif F, Yameen M, Naz S, Sultana A, Nazir A, Raza S, Shazad M, Nasim S, Javed MA, Ali SS, Jafree M, Nisar MI, Daood MS, Hussain A, Sarwar N, Kamal A, Deloukas P, Ishaq M, Frossard P, Danesh J. The Pakistan Risk of Myocardial Infarction Study: a resource for the study of genetic, lifestyle and other determinants of myocardial infarction in South Asia. Eur J Epidemiol. 2009;24(6):329–338. doi: 10.1007/s10654-009-9334-y. - DOI - PMC - PubMed
Publication types
MeSH terms
Substances
Grants and funding
- RG/13/13/30194/BHF_/British Heart Foundation/United Kingdom
- SP/09/002/British Heart Foundation (GB)
- G0800783/MRC_/Medical Research Council/United Kingdom
- MC_UP_A090_1006/MRC_/Medical Research Council/United Kingdom
- MR/L003120/1/MRC_/Medical Research Council/United Kingdom
- MR/L003120/1/Medical Research Council (GB)
- RG/13/13/30194/British Heart Foundation (GB)
- 105602/Z/14/Z/WT_/Wellcome Trust/United Kingdom
- WT_/Wellcome Trust/United Kingdom
- G0800270/MRC_/Medical Research Council/United Kingdom
- RG/18/13/33946/BHF_/British Heart Foundation/United Kingdom
- SP/09/002/BHF_/British Heart Foundation/United Kingdom
- MC_PC_13030/MRC_/Medical Research Council/United Kingdom
LinkOut - more resources
Full Text Sources
Medical
Miscellaneous
