

Single-nuclei chromatin profiling of ventral midbrain reveals cell identity transcription factors and cell-type-specific gene regulatory variation
- PMID: 34503558
- PMCID: PMC8427957
- DOI: 10.1186/s13072-021-00418-3
Single-nuclei chromatin profiling of ventral midbrain reveals cell identity transcription factors and cell-type-specific gene regulatory variation
Abstract
Background: Cell types in ventral midbrain are involved in diseases with variable genetic susceptibility, such as Parkinson's disease and schizophrenia. Many genetic variants affect regulatory regions and alter gene expression in a cell-type-specific manner depending on the chromatin structure and accessibility.
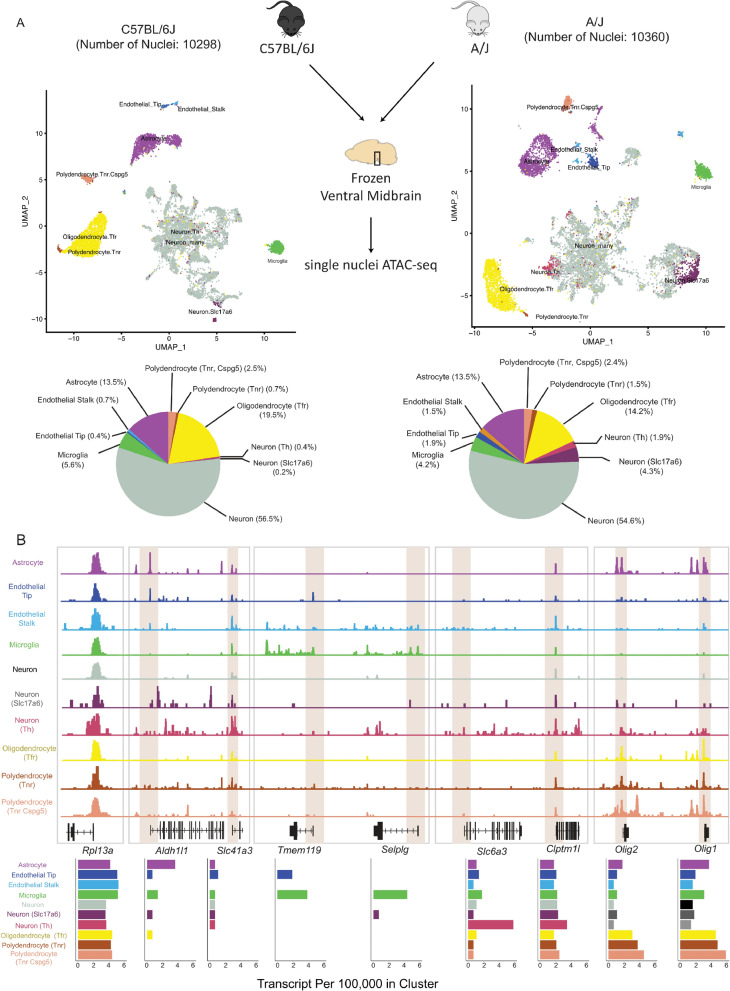
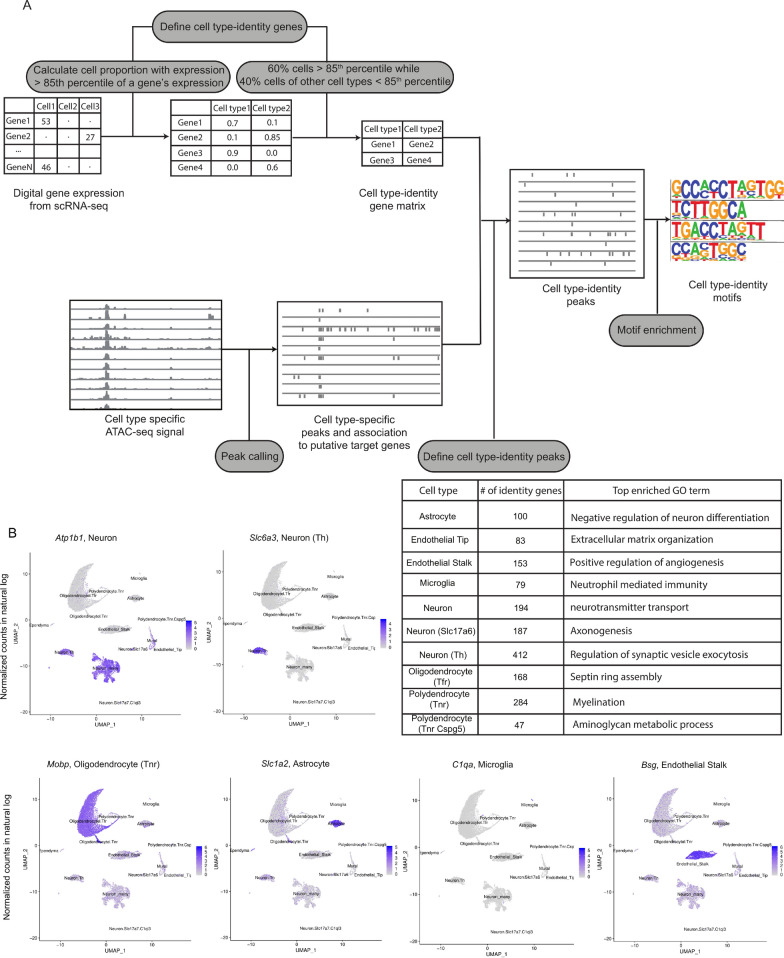
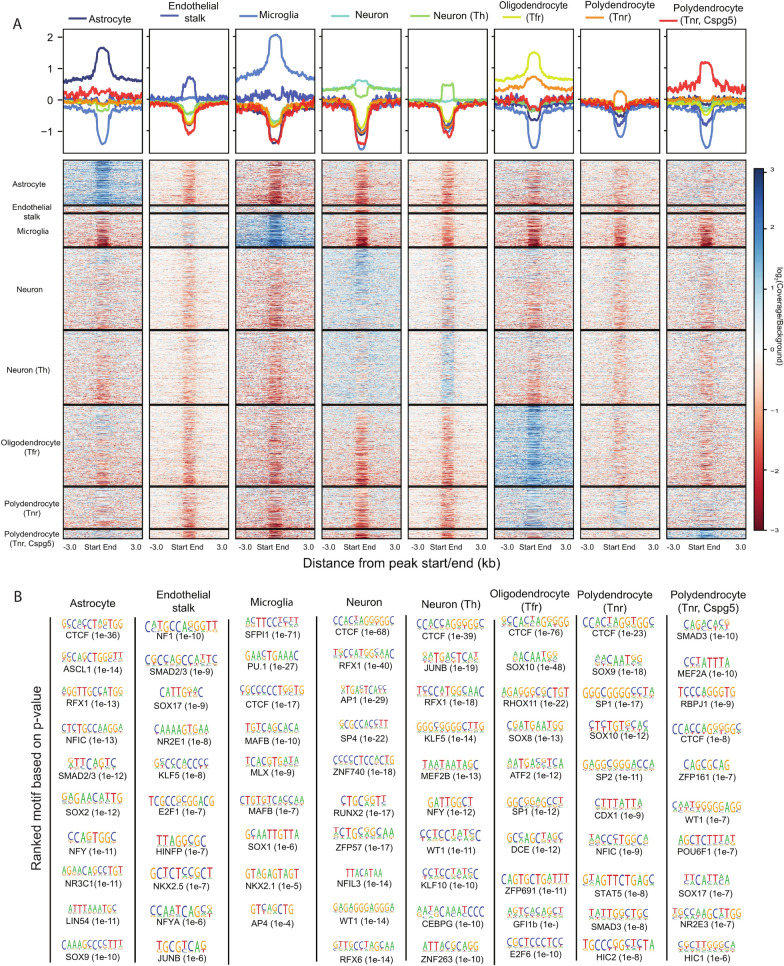
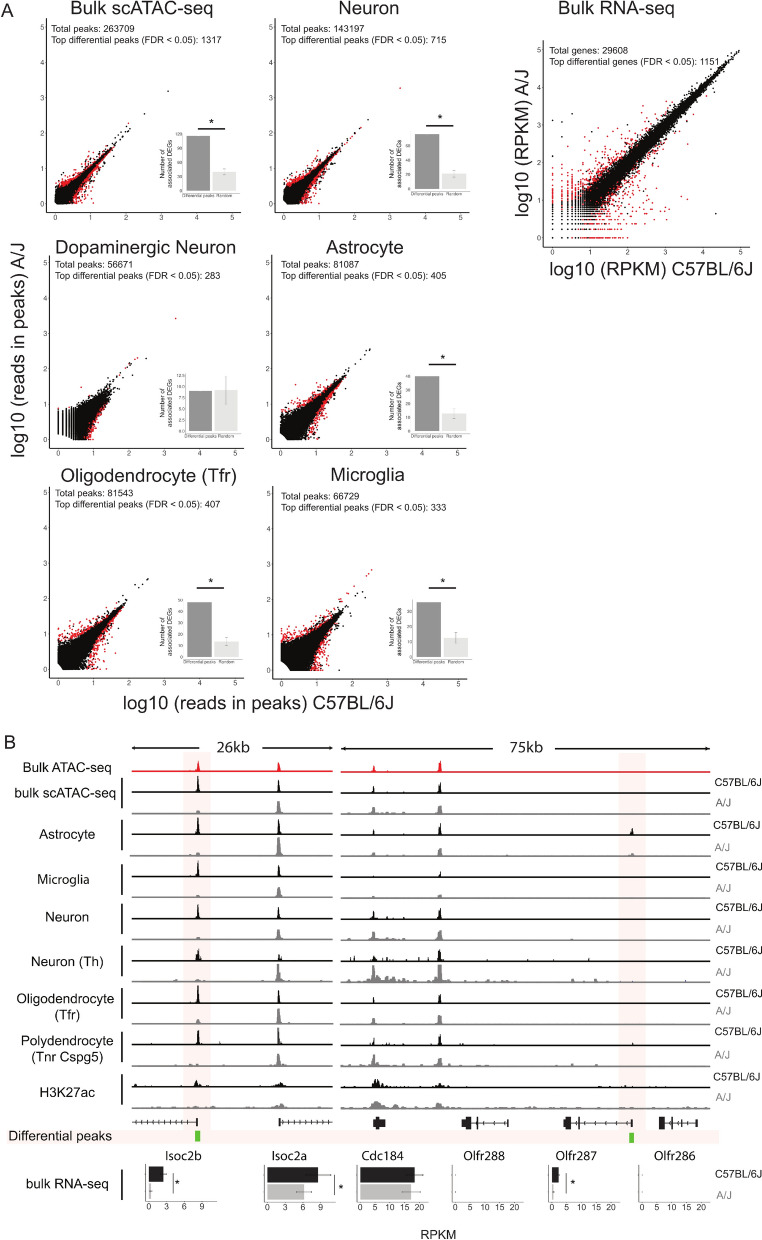
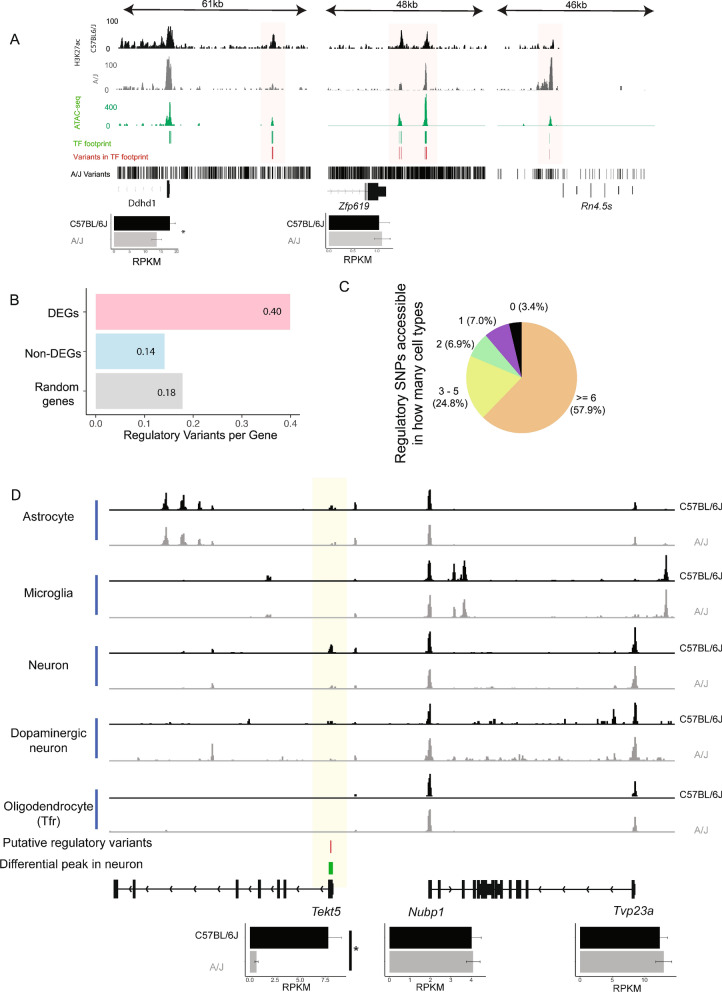
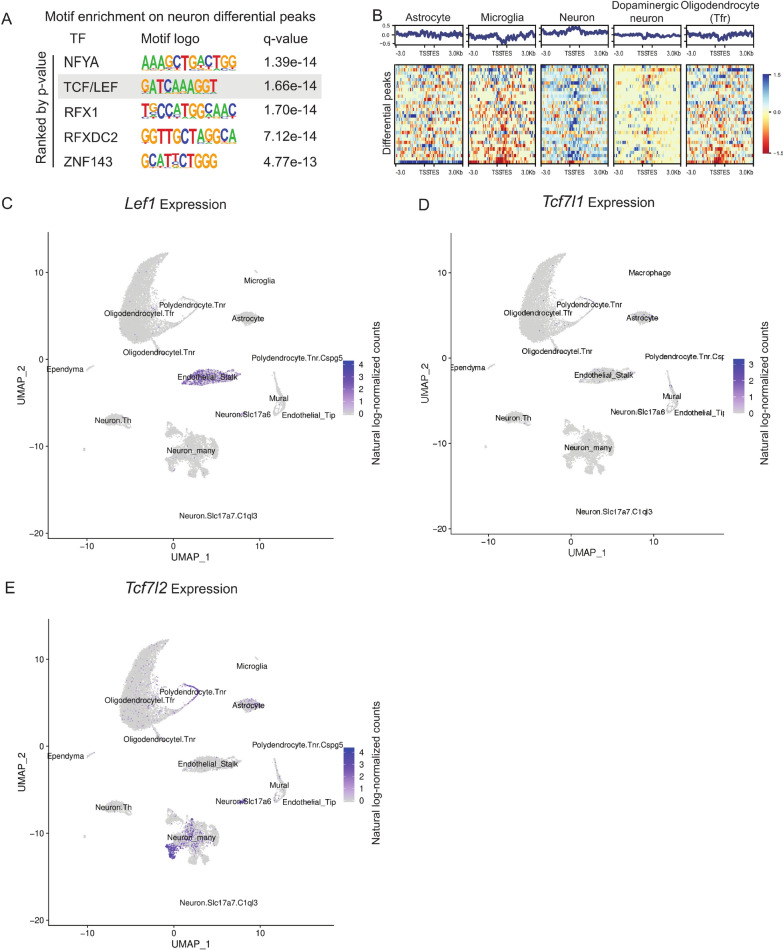
Results: We report 20,658 single-nuclei chromatin accessibility profiles of ventral midbrain from two genetically and phenotypically distinct mouse strains. We distinguish ten cell types based on chromatin profiles and analysis of accessible regions controlling cell identity genes highlights cell-type-specific key transcription factors. Regulatory variation segregating the mouse strains manifests more on transcriptome than chromatin level. However, cell-type-level data reveals changes not captured at tissue level. To discover the scope and cell-type specificity of cis-acting variation in midbrain gene expression, we identify putative regulatory variants and show them to be enriched at differentially expressed loci. Finally, we find TCF7L2 to mediate trans-acting variation selectively in midbrain neurons.
Conclusions: Our data set provides an extensive resource to study gene regulation in mesencephalon and provides insights into control of cell identity in the midbrain and identifies cell-type-specific regulatory variation possibly underlying phenotypic and behavioural differences between mouse strains.
Keywords: Cell-type identity; Genetic variation; Midbrain; Mouse strains; Single-nuclei ATAC-seq; Wnt signalling.
© 2021. The Author(s).
Conflict of interest statement
The authors declare that they have no competing interests.
Figures
Similar articles
-
Pituitary Tumor Transforming Gene 1 Orchestrates Gene Regulatory Variation in Mouse Ventral Midbrain During Aging.Front Genet. 2020 Sep 23;11:566734. doi: 10.3389/fgene.2020.566734. eCollection 2020. Front Genet. 2020. PMID: 33173537 Free PMC article.
-
Global analysis of primary mesenchyme cell cis-regulatory modules by chromatin accessibility profiling.BMC Genomics. 2018 Mar 20;19(1):206. doi: 10.1186/s12864-018-4542-z. BMC Genomics. 2018. PMID: 29558892 Free PMC article.
-
Transcriptomic and Chromatin Landscape Analysis Reveals That Involvement of Pituitary Level Transcription Factors Modulate Incubation Behaviors of Magang Geese.Genes (Basel). 2023 Mar 28;14(4):815. doi: 10.3390/genes14040815. Genes (Basel). 2023. PMID: 37107573 Free PMC article.
-
Interrogating the Accessible Chromatin Landscape of Eukaryote Genomes Using ATAC-seq.Methods Mol Biol. 2021;2243:183-226. doi: 10.1007/978-1-0716-1103-6_10. Methods Mol Biol. 2021. PMID: 33606259 Review.
-
Single-cell analysis of cis-regulatory elements.Curr Opin Plant Biol. 2022 Feb;65:102094. doi: 10.1016/j.pbi.2021.102094. Epub 2021 Aug 12. Curr Opin Plant Biol. 2022. PMID: 34390932 Review.
Cited by
-
Normal and Pathological NRF2 Signalling in the Central Nervous System.Antioxidants (Basel). 2022 Jul 22;11(8):1426. doi: 10.3390/antiox11081426. Antioxidants (Basel). 2022. PMID: 35892629 Free PMC article. Review.
-
Iterative assay for transposase-accessible chromatin by sequencing to isolate functionally relevant neuronal subtypes.Sci Adv. 2024 Mar 29;10(13):eadi4393. doi: 10.1126/sciadv.adi4393. Epub 2024 Mar 27. Sci Adv. 2024. PMID: 38536919 Free PMC article.
-
Allostery: Allosteric Cancer Drivers and Innovative Allosteric Drugs.J Mol Biol. 2022 Sep 15;434(17):167569. doi: 10.1016/j.jmb.2022.167569. Epub 2022 Apr 1. J Mol Biol. 2022. PMID: 35378118 Free PMC article. Review.
-
Allostery, and how to define and measure signal transduction.Biophys Chem. 2022 Apr;283:106766. doi: 10.1016/j.bpc.2022.106766. Epub 2022 Jan 29. Biophys Chem. 2022. PMID: 35121384 Free PMC article. Review.
References
-
- Nalls MA, Blauwendraat C, Vallerga CL, Heilbron K, Bandres-Ciga S, Chang D, et al. Identification of novel risk loci, causal insights, and heritable risk for Parkinson’s disease: a meta-analysis of genome-wide association studies. Lancet Neurol. 2019;18(12):1091–1102. doi: 10.1016/S1474-4422(19)30320-5. - DOI - PMC - PubMed
Publication types
MeSH terms
Substances
LinkOut - more resources
Full Text Sources
