. 2021 Sep 9;9(1):150.
doi: 10.1186/s40478-021-01251-1.

Effects of microglial depletion and TREM2 deficiency on Aβ plaque burden and neuritic plaque tau pathology in 5XFAD mice

Affiliations

Effects of microglial depletion and TREM2 deficiency on Aβ plaque burden and neuritic plaque tau pathology in 5XFAD mice

Argyro Thalia Delizannis et al. Acta Neuropathol Commun. .

Abstract

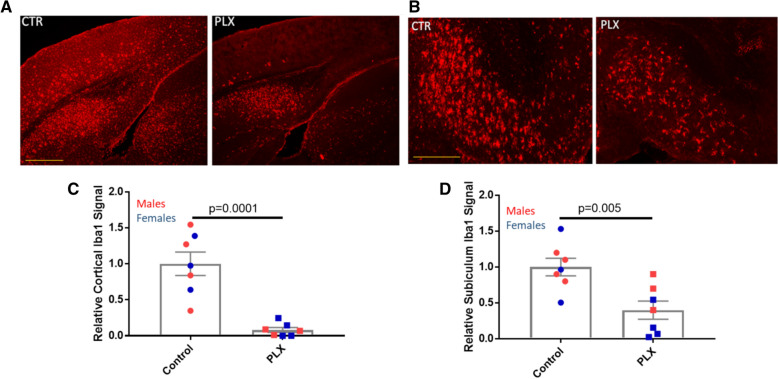
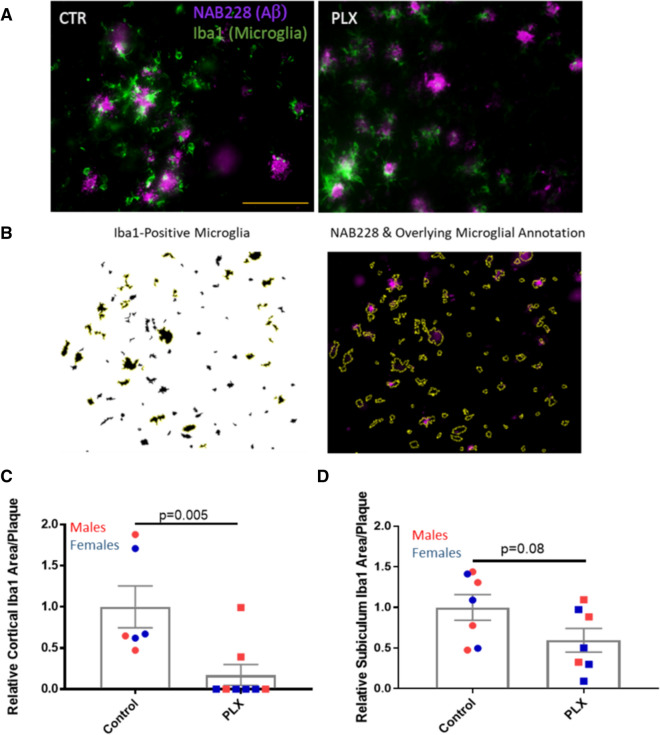
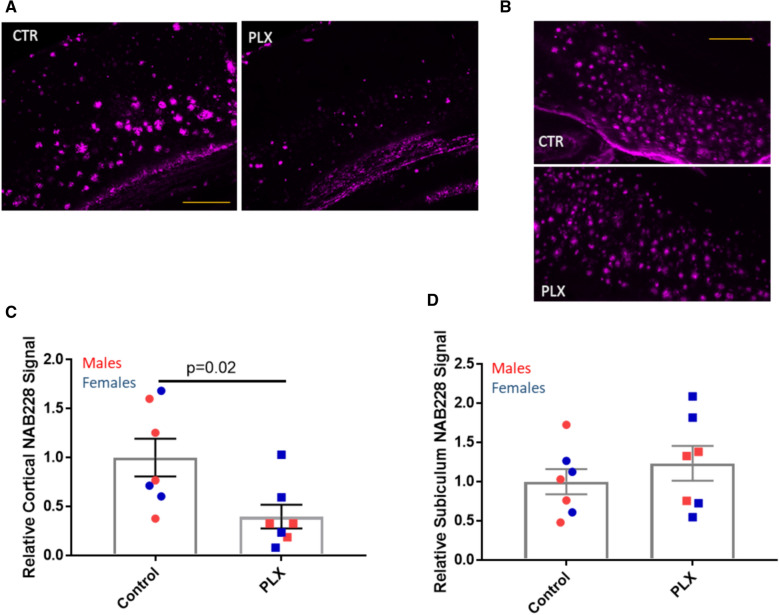
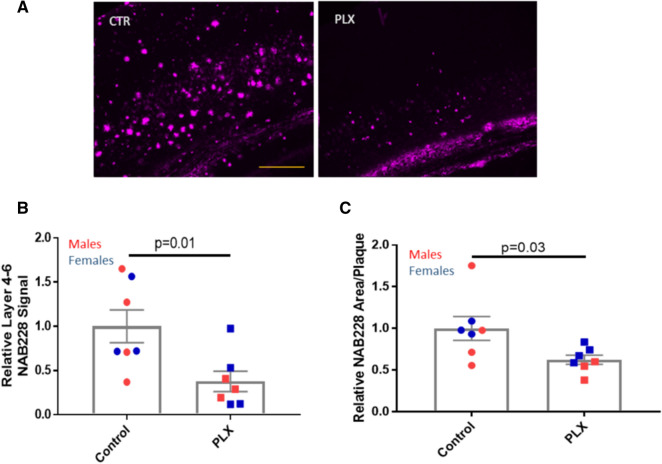
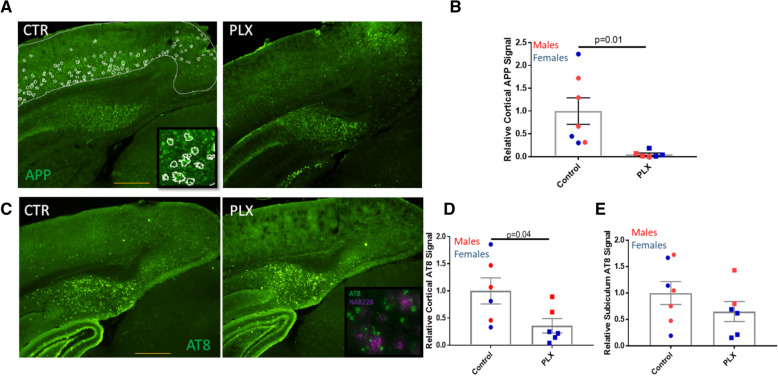
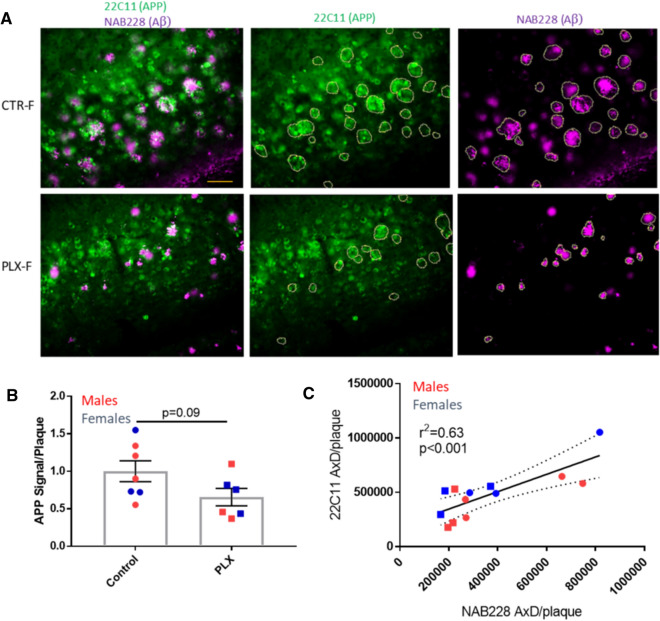
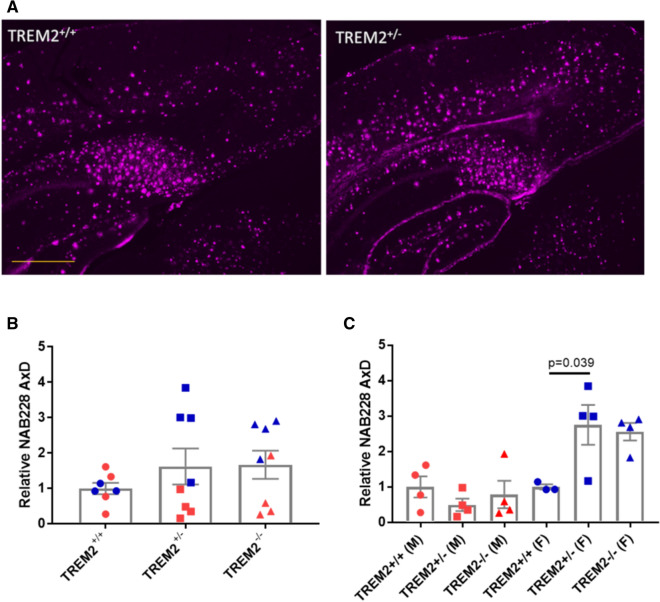
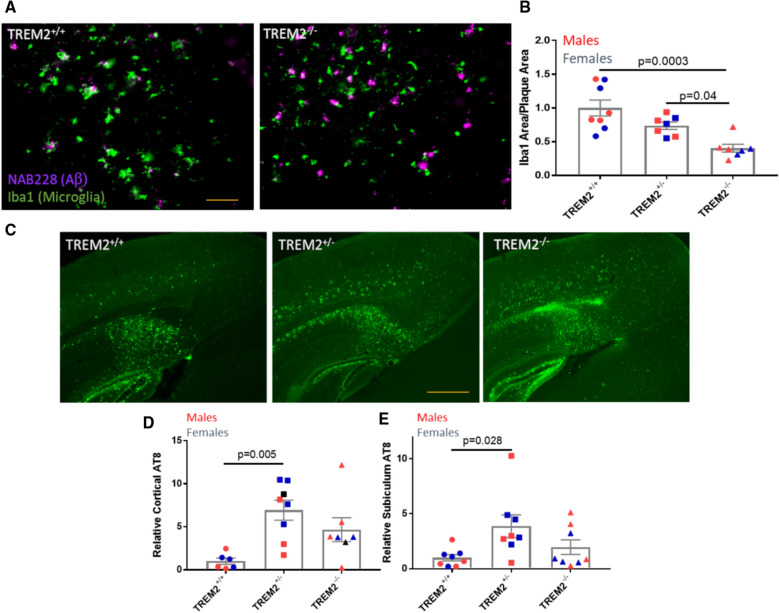
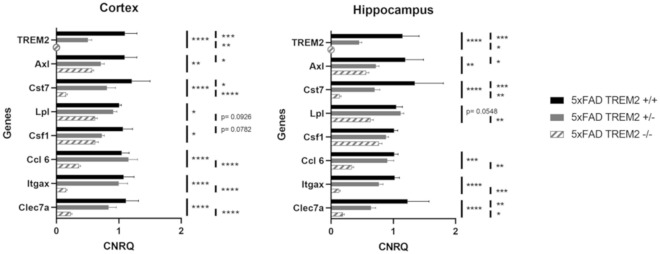
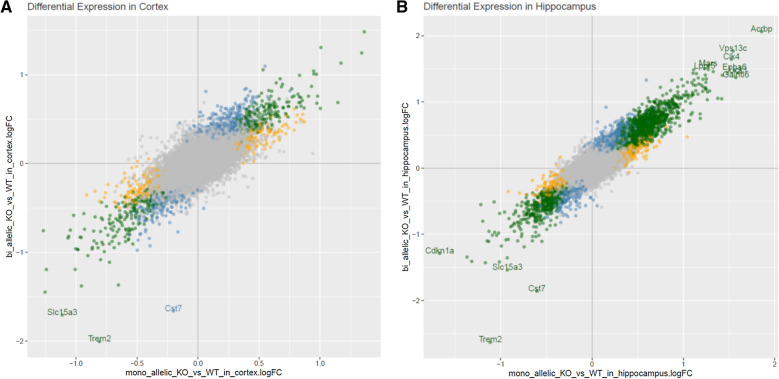
Dystrophic neuronal processes harboring neuritic plaque (NP) tau pathology are found in association with Aβ plaques in Alzheimer's disease (AD) brain. Microglia are also in proximity to these plaques and microglial gene variants are known risk factors in AD, including loss-of-function variants of TREM2. We have further investigated the role of Aβ plaque-associated microglia in 5XFAD mice in which NP tau pathology forms after intracerebral injection of AD brain-derived pathologic tau (AD-tau), focusing on the consequences of reduced TREM2 expression and microglial depletion after treatment with the colony-stimulating factor 1 (CSFR1) inhibitor, PLX3397. Young 5XFAD mice treated with PLX3397 had a large reduction of brain microglia, including cortical plaque-associated microglia, with a significant reduction of Aβ plaque burden in the cortex. A corresponding decrease in cortical APP-positive dystrophic processes and NP tau pathology were observed after intracerebral AD-tau injection in the PLX3397-treated 5XFAD mice. Consistent with prior reports, 5XFAD × TREM2-/- mice showed a significant reduction of plaque-associated microglial, whereas 5XFAD × TREM2+/- mice had significantly more plaque-associated microglia than 5XFAD × TREM2-/- mice. Nonetheless, AD-tau injected 5XFAD × TREM2+/- mice showed greatly increased AT8-positive NP tau relative to 5XFAD × TREM2+/+ mice. Expression profiling revealed that 5XFAD × TREM2+/- mice had a disease-associated microglial (DAM) gene expression profile in the brain that was generally intermediate between 5XFAD × TREM2+/+ and 5XFAD × TREM2-/- mice. Microarray analysis revealed significant differences in cortical and hippocampal gene expression between AD-tau injected 5XFAD × TREM2+/- and 5XFAD × TREM2-/- mice, including pathways linked to microglial function. These data suggest there is not a simple correlation between the extent of microglia plaque interaction and plaque-associated neuritic damage. Moreover, the differences in gene expression and microglial phenotype between TREM2+/- and TREM2-/- mice suggest that the former may better model the single copy TREM2 variants associated with AD risk.

Keywords: Alzheimer’s; Microglia; Pathology; Plaques; Tau.


Conflict of interest statement

Certain of the authors are employees of Janssen Pharmaceutica, NV, who provided funding for these studies.

Figures

Fig. 1
Fig. 1
PLX3397 treatment caused significant reduction in brain microglia in AD-tau-injected 5XFAD mice. Iba1-positive microglia were greatly reduced in the cortex of PLX3397-treated 5XFAD mice (PLX) (a), as well as in the subiculum (b), relative to control mice (CTR), with quantification as shown in c and d, respectively. Scale bars represent 0.4 mm in A and 0.2 mm in B
Fig. 2
Fig. 2
PLX3397 treatment led to a reduction of plaque-associated microglia in AD-tau-injected 5XFAD mice. a Plaque-associated microglia were reduced in the cortex of PLX3397-treated (PLX) compared to control (CTR) AD-tau-injected 5XFAD mice. b Example image of Iba1-positive microglia after thresholding (left), and subsequent overlaying of the thresholded image onto Aβ-stained plaques to identify plaque-associated microglia (right). Only the Iba1 signal that was plaque-associated was quantified, resulting in mean Iba1 area per plaque. Quantification of plaque-associated Iba1 area in the cortex (c) and subiculum (d). Scale bar represents 50 µm
Fig. 3
Fig. 3
PLX3397 treatment reduced Aβ plaques in the cortex, but not subiculum. Representative images of NAB228-positive Aβ plaques in control (CTR) and PLX337-treated (PLX) AD-tau-injected 5XFAD mice are shown for (a) the cortex and (b) the subiculum, with quantification shown in (c) and (d), respectively. Scale bars represent 0.4 mm
Fig. 4
Fig. 4
PLX3397 treatment reduced Aβ plaques and plaque size in layers 4–6 of the cortex. a Representative images of NAB228-positive Aβ IF in cortical layers 4–6 of control (CTR) and PLX3397-treated (PLX) AD-tau-injected 5XFAD mice. Quantification of total Aβ plaque signal in cortical layers 4–6 (b) and area per plaque in layers 4–6 (c). Scale bar represents 0.4 mm
Fig. 5
Fig. 5
AD-tau-injected 5XFAD mice treated with PLX3397 had greatly reduced APP-positive dystrophic processes and AT8-positive NP tau. a Representative 22C11-positive APP IF images of a control (CTR) and PLX3397-treated (PLX) AD-tau-injected 5XFAD mouse, showing the annotation of the cortical region and selection of APP-positive dystrophic processes with exclusion of APP-positive neuronal soma (see insert). b Quantification of cortical APP-positive dystrophic processes. One female PLX3397-treated mouse was excluded from the analysis because useable brain sections were unavailable. c Representative images of AT8-positive tau in control (CTR) and PLX3397-treated (PLX) AD-tau-injected 5XFAD mice, with quantification of d cortical and e subiculum NP tau pathology. The inset in C is a dual-stained image from the subiculum showing that AT8 (green) staining is found in processes that are closely associated with Aβ plaques (NAB228; violet). Scale bars represent 0.4 mm
Fig. 6
Fig. 6
PLX3397 treatment of AD-tau-injected 5XFAD mice led to a trend toward less APP accumulation in plaque-associated processes. a Representative cortical images of NAB228 (Aβ) and 22C11 (APP) IF from control (CTR) and PLX3397-treated (PLX) female 5XFAD mice, with annotation of Aβ plaque-associated APP within the focal plane that were then quantified. b Quantification of Aβ plaque-associated APP signal per plaque. One PLX3397-treated female mouse was excluded from the analysis because brain sections were unavailable at all bregma levels. c Correlation between the mean integrated APP and Aβ signal per plaque for each study mouse shown in B. Circles = controls; Squares = PLX3397-treated. Dashed line represents the 95% confidence limits. Scale bar represents 50 µm
Fig. 7
Fig. 7
Aβ plaque burden was differentially affected by TREM2 genotype in male and female AD-tau-injected 5XFAD mice. a Representative image of cortical and subiculum NAB228-positive Aβ plaques in female 5XFAD × TREM2+/+ and 5XFAD × TREM2+/− mice. b Quantification of cortical Aβ plaque burden in AD-tau-injected 5XFAD mice as a function of TREM2 genotype. c Cortical Aβ plaque burden graphed by sex for each TREM2 genotype. Scale bar represents 0.4 mm
Fig. 8
Fig. 8
AD-tau-injected 5XFAD × TREM2+/− mice had greater Aβ plaque-associated microglia than 5XFAD × TREM2−/− mice but comparable AT8-positive NP tau pathology a Representative images of cortical Aβ plaque-associated microglia in 5XFAD × TREM2+/+ and 5XFAD × TREM2−/− mice. b Quantification of cortical Aβ plaque-associated microglia area per plaque as a function of TREM2 genotype. c Representative images of AT8-positive NP tau pathology in the cortex and subiculum of female 5XFAD mice with differing TREM2 genotype. Quantification of d cortical and e subiculum AT8 NP tau pathology as a function of TREM2 genotype. Scale bars represent 50 µM in A and 0.4 mm in B
Fig. 9
Fig. 9
Reduced TREM2 expression led to reduced mRNA expression of DAM stage 2 markers in AD-tau-injected 5XFAD mice. qPCR analysis of DAM stage 2 genes in cortex and hippocampus samples of AD-tau-injected 5XFAD × TREM2+/+, 5XFAD × TREM2+/− and 5XFAD × TREM2−/− mice. Data from male (n = 3) and female (n = 3, except n = 1 for 5XFAD × TREM2+/+) mice were pooled, and samples of left and right hemisphere from each mouse were used as individual data points (data by sex and hemisphere can be found in Additional file 1: Fig. S6). TREM2 was below the threshold of detection in the 5XFAD × TREM2−/− mice and thus expression is shown as zero. *p < 0.05, **p < 0.01, ***p < 0.001, ****p < 0.0001
Fig. 10
Fig. 10
Comparison of the magnitude of differential gene expression between AD-tau injected 5XFAD × TREM2+/+ (WT) mice and 5XFAD × TREM2−/− (bi-allelic KO) or 5XFAD × TREM2+/− (mono-allelic KO) mice in the cortex (a) and hippocampus (b). Genes with an absolute logFC > 1.5 are annotated. Grey = non-significant difference; Yellow = Significant difference between TREM+/+ and TREM2+/−; Blue = Significant difference between TREM+/+ and TREM2−/−; Green = Significant in both previous comparisons

Similar articles

Cited by

References

    1. Arriagada PV, Growdon JH, Hedleywhyte ET, Hyman BT. Neurofibrillary tangles but not senile plaques parallel duration and severity of Alzheimers disease. Neurology. 1992;42:631–639. doi: 10.1212/WNL.42.3.631. - DOI - PubMed
    1. Atagi Y, Liu CC, Painter MM, Chen XF, Verbeeck C, Zheng H, Li, Rademakers R, Kang SS, Xu H, Younkin S, Das P, Fryer JD, Bu G. Apolipoprotein E is a ligand for triggering receptor expressed on myeloid cells 2 (TREM2) J Biol Chem. 2015;290:26043–26050. doi: 10.1074/jbc.M115.679043. - DOI - PMC - PubMed
    1. Ball M, Braak H, Coleman P, Dickson D, Duyckaerts C, Gambetti P, Hansen L, Hyman B, Jellinger K, Markesbery W, Perl D, Powers J, Price J, Trojanowski JQ, Wisniewski H, Phelps C, Khachaturian Z. Consensus recommendations for the postmortem diagnosis of Alzheimer's disease. Neurobiol Aging. 1997;18:S1–S2. doi: 10.1016/S0197-4580(97)00052-3. - DOI - PubMed
    1. Braak H, Braak E. Neuropathological staging of alzheimer-related changes. Acta Neuropathol. 1991;82:239–259. doi: 10.1007/BF00308809. - DOI - PubMed
    1. Braak H, Thal DR, Ghebremedhin E, Del Tredici K. Stages of the pathologic process in Alzheimer disease: age categories from 1 to 100 years. J Neuropathol Exp Neurol. 2011;70:960–969. doi: 10.1097/NEN.0b013e318232a379. - DOI - PubMed

Publication types