. 2021 Sep 14;118(37):e2024893118.
doi: 10.1073/pnas.2024893118.

Cytokine receptor cluster size impacts its endocytosis and signaling

Affiliations

Cytokine receptor cluster size impacts its endocytosis and signaling

Laura Salavessa et al. Proc Natl Acad Sci U S A. .

Abstract

The interleukin-2 receptor (IL-2R) is a cytokine receptor essential for immunity that transduces proliferative signals regulated by its uptake and degradation. IL-2R is a well-known marker of clathrin-independent endocytosis (CIE), a process devoid of any coat protein, raising the question of how the CIE vesicle is generated. Here, we investigated the impact of IL-2Rγ clustering in its endocytosis. Combining total internal reflection fluorescence (TIRF) live imaging of a CRISPR-edited T cell line endogenously expressing IL-2Rγ tagged with green fluorescent protein (GFP), with multichannel imaging, single-molecule tracking, and quantitative analysis, we were able to decipher IL-2Rγ stoichiometry at the plasma membrane in real time. We identified three distinct IL-2Rγ cluster populations. IL-2Rγ is secreted to the cell surface as a preassembled small cluster of three molecules maximum, rapidly diffusing at the plasma membrane. A medium-sized cluster composed of four to six molecules is key for IL-2R internalization and is promoted by interleukin 2 (IL-2) binding, while larger clusters (more than six molecules) are static and inefficiently internalized. Moreover, we identified membrane cholesterol and the branched actin cytoskeleton as key regulators of IL-2Rγ clustering and IL-2-induced signaling. Both cholesterol depletion and Arp2/3 inhibition lead to the assembly of large IL-2Rγ clusters, arising from the stochastic interaction of receptor molecules in close correlation with their enhanced lateral diffusion at the membrane, thus resulting in a default in IL-2R endocytosis. Despite similar clustering outcomes, while cholesterol depletion leads to a sustained IL-2-dependent signaling, Arp2/3 inhibition prevents signal initiation. Taken together, our results reveal the importance of cytokine receptor clustering for CIE initiation and signal transduction.

Keywords: clathrin-independent endocytosis; clustering; signaling; single molecule; stoichiometry.


Conflict of interest statement

The authors declare no competing interest.

Figures

Fig. 1.
Fig. 1.
GFP-IL-2Rγ is clustered at the cell surface in distinct subpopulations. (A) Schematic representation of the endocytic track detection and the single-molecule calibration technique used to determine the stoichiometry of GFP-IL-2Rγ at the cell surface. (A, i) Live Kit225 edited cells are imaged by TIRF microscopy. (A, ii) GFP-IL-2Rγ putative endocytic tracks are automatically detected, and their fluorescence intensity along time is obtained using the eTrack plugin. (A, iii) A calibration step is performed by imaging purified eGFP at high frequency and determining the fluorescence intensity corresponding to one molecule of eGFP. Finally, the mean of several eGFP bleaching steps is used to calculate the number of GFP-IL-2Rγ molecules per track. (B) Violin plots (Left) and histograms (Right) of the number of GFP-IL-2Rγ molecules per spot at steady state in control and BFA-treated cells, IL-2 starved (−IL-2) or IL-2 stimulated (+IL-2). Histograms represent the distribution of the number of GFP-IL-2Rγ molecules per spot in each condition (mean ± SD; −IL-2, n = 2,805 spots; +IL-2, n = 3,027 spots; BFA −IL-2, n = 3,012 spots; BFA +IL-2, n = 3,596 spots; data obtained from three independent experiments). (C) Distribution of GFP-IL-2Rγ track’s lifetimes fitted with a mixture model comprising one exponential distribution (Exp; red line) and three Gaussians with the following means (± SD): G1 (blue line), 29.1 ± 4.8 s; G2 (green line), 43.9 ± 9.8 s; G3 (yellow line), 149.6 ± 0.6 s. The red dotted line corresponds to the total distribution. (D) Representative images of the modified FRAP experiment (Upper, scale bars: 5 μm) and histograms of the duration of GFP-IL-2Rγ tracks reappearing at the surface of control or BFA-treated cells after photobleaching (Lower). Cells were imaged by TIRF microscopy and photobleached with 100% laser power for 30 s. Following 2 min of recovery, live-imaging movies were acquired normally (1% laser power, 1 frame/s). Data are from two independent experiments, with a total of 535 tracks in control cells and 120 tracks in cells treated with BFA. (E) Distribution of the duration of GFP-IL-2Rγ tracks (noncolocalizing) and GFP-IL-2Rγ/IL-2Rβ colocalizing tracks, represented as a relative frequency of total GFP-IL-2Rγ tracks (mean ± SD; GFP-IL-2Rγ, n = 629 tracks; GFP-IL-2Rγ +IL-2Rβ, n = 229 tracks; data from two independent experiments). (F) Violin plot representing the number of GFP-IL-2Rγ per track, according to their lifetimes. Short-lived tracks have durations of 1 to 25 s (n = 2,419 tracks), long-lived tracks have durations of 30 to 80 s (n = 1,695 tracks), and static tracks have durations of 140 to 150 s (n = 40 tracks).
Fig. 2.
Fig. 2.
Endocytic GFP-IL-2Rγ is composed of medium-sized clusters. (A) Representative images of small, medium, and large GFP-IL-2Rγ clusters along time, together with their respective fluorescence intensity profiles. (B) Proportion of GFP-IL-2Rγ tracks with cluster sizes of three or fewer molecules, four to six molecules, or more than six molecules, represented as a percentage of total GFP-IL-2Rγ tracks (mean ± SEM; −IL-2, n = 3,774 tracks; +IL-2, n = 2,716 tracks; BFA −IL-2, n = 2,689 tracks; BFA +IL-2, n = 4,242 tracks; data from four independent experiments). (C) Duration of GFP-IL-2Rγ tracks from each cluster group, per condition (mean ± SEM in seconds; −IL-2: fewer than or equal to three molecules, n = 2,898 tracks; four to six molecules, n = 841 tracks; more than six molecules, n = 35 tracks; +IL-2: fewer than or equal to three molecules, n = 1,602 tracks; four to six molecules, n = 1,015 tracks; more than six molecules, n = 99 tracks; BFA −IL-2, fewer than or equal to three molecules, n = 1,236 tracks; four to six molecules, n = 1,329 tracks; more than six molecules, n = 124 tracks; BFA +IL-2: fewer than or equal to three molecules, n = 1,375 tracks; four to six molecules, n = 2512 tracks; more than six molecules, n = 355 tracks; data from four independent experiments). ANOVA (Krustal–Wallis) with Dunn’s multiple comparisons. ns, nonsignificant. *P ≤ 0.05; ***P ≤ 0.001. (D) Colocalization of GFP-IL-2Rγ (in green) with EndoA or with Dyn2 (in magenta). Insets show time-lapse frames of interaction and not the full-length GFP-IL-2Rγ tracks. Relative frequency of GFP-IL-2Rγ tracks and distribution of their number of molecules, colocalizing with either EndoA (magenta bars) or Dyn2 (green bars; GFP-IL-2Rγ/EndoA, n = 94 colocalizing tracks; GFP-IL-2Rγ/Dyn2, n = 92 colocalizing tracks). For clarity purposes, images in A and D were processed (background subtraction: 100 pixels; Gaussian blur filter: radius 1). (Scale bars: 5 μm; Insets, 1 μm.)
Fig. 3.
Fig. 3.
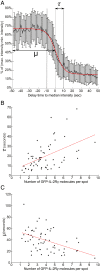
Quantitative analysis of disappearing clusters by fluorescence decay fitting. (A) Fluorescence intensity of individual GFP-IL-2Rγ clusters (n = 62) is normalized and fitted with a sigmoid function. The parameters μ and τ are dynamic parameters of the model that correspond, respectively, to the halftime and the time constant of disappearance (Materials and Methods). The black curve corresponds to the median intensity of normalized traces (± SD). The red solid line corresponds to the sigmoid function with median parameters high=67%,low=16%,μ=51s,andτ=11.5s. For each individual fluorescence trace, the time origin (t = 0) is aligned with the half-disappearance time [i.e., intensity(t=0)=low+high2]. (B) Disappearance time constant τ as a function of the cluster size. The red line represents the linear regression (ρ=0.51,pvalue=2.2×10⁵). (C) Halftime of disappearance μ as a function of the cluster size. The red line represents the linear regression (ρ=0.45,Pvalue=2.2×10⁴).
Fig. 4.
Fig. 4.
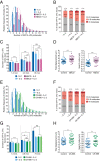
Membrane cholesterol and the actin cytoskeleton regulate GFP-IL-2Rγ clustering and diffusion. (A) Distribution of the number of GFP-IL-2Rγ molecules per track in control and MβCD-treated cells, IL-2 starved (−IL-2) or IL-2 stimulated (+IL-2). Histograms represent relative frequency of tracks, and dashed lines connecting the bars show the overall distribution of GFP-IL-2Rγ molecules per track in each condition. (B) Proportion of GFP-IL-2Rγ tracks with cluster sizes of three or fewer, four to six, or more than six molecules, represented as a percentage of total GFP-IL-2Rγ tracks (mean ± SEM). Data in A and B were obtained from three independent experiments (−IL-2, n = 7,035 tracks; +IL-2, n = 6,892 tracks; MβCD −IL-2, n = 3,162 tracks; MβCD +IL-2, n = 2,741 tracks). (C) Duration of GFP-IL-2Rγ tracks from each cluster group per condition (mean ± SEM in seconds; −IL-2: fewer than or equal to three molecules, n = 1,416 tracks; four to six molecules, n = 564 tracks; more than six molecules, n = 12 tracks; +IL-2: fewer than or equal to three molecules, n = 1,489 tracks; four to six molecules, n = 858 tracks; more than six molecules, n = 100 tracks; MβCD −IL-2: fewer than or equal to three molecules, n = 1,305 tracks; four to six molecules, n = 1,490 tracks; more than six molecules, n = 367 tracks; MβCD +IL-2, fewer than or equal to three molecules, n = 1,319 tracks; four to six molecules, n = 1,277 tracks; more than six molecules, n = 145 tracks; data from four independent experiments). (D) Total displacement of GFP-IL-2Rγ tracks (Left) and search radius of that displacement (Right) in control and MβCD-treated cells. Each dot represents one cell, and means (± SEM) are shown in micrometers. Control, n = 31 cells. MβCD, n = 34 cells. Data were obtained from three independent experiments. (E) Distribution of the number of GFP-IL-2Rγ molecules per track in control and CK-666–treated cells, IL-2 starved (−IL-2) or IL-2 stimulated (+IL-2). (F) Proportion of GFP-IL-2Rγ tracks with cluster sizes fewer than or equal to three, four to six, or more than six molecules represented as a percentage of total GFP-IL-2Rγ tracks (mean ± SEM). Data in E and F were obtained from seven independent experiments for control and from three independent experiments for CK-666 (−IL-2: n = 4,969 tracks; +IL-2: n = 4,089 tracks; CK-666 −IL-2: n = 4,126 tracks; CK-666 +IL-2, n = 3,392 tracks). (G) Duration of GFP-IL-2Rγ tracks from each cluster group per condition (mean ± SEM in seconds; −IL-2: fewer than or equal to three molecules, n = 3,986 tracks; four to six molecules, n = 1,864 tracks; more than six molecules, n = 53 tracks; +IL-2, fewer than or equal to three molecules, n = 2,644 tracks; four to six molecules, n = 2,181 tracks; more than six molecules, n = 274 tracks; CK-666 −IL-2: fewer than or equal to three molecules, n = 1,337 tracks; four to six molecules, n = 1,778 tracks; more than six molecules, n = 342 tracks; CK-666 +IL-2: fewer than or equal to three molecules, n = 1,245 tracks; four to six molecules, n = 1,503 tracks; more than six molecules, n = 155 tracks. Data are from three and seven independent experiments for control and CK-666, respectively. (H) Total displacement of GFP-IL-2Rγ tracks (Left) and search radius of that displacement (Right) in control and CK-666–treated cells. Each dot represents one cell, and means (± SEM) are shown in micrometers. Control, n = 32 cells. CK-666, n = 34 cells. Data are obtained from three independent experiments. Statistics in C and G were performed by ANOVA (Krustal–Wallis) with Dunn’s multiple comparisons within each cluster group and in D and H by a two-tailed unpaired t test. ns, nonsignificant. *P ≤ 0.05; **P ≤ 0.01; ***P ≤ 0.001.
Fig. 5.
Fig. 5.
Membrane cholesterol depletion and Arp2/3 inhibition preclude IL-2R from endocytic pits. (A) Representative TEM pictures of IL-2Rβ labeled by a specific antibody and protein A coupled to 10-nm gold beads at the surface of control or MβCD-treated Kit225 GFP-IL-2Rγ cells in the absence (−IL-2) or presence (+IL-2) of IL-2. IL-2Rβ can be seen in flat PM regions or in endocytic pits. Magnifications of labeled IL-2Rβ (dashed white squares) are shown below. Scale bars are shown. (B) Quantification of labeled IL-2Rβ at the PM of control or MβCD-treated cells (±IL-2), according to its association with endocytic pits or flat membrane. Results are expressed as a percentage of total beads found at the PM. (C) Representative TEM pictures of IL-2Rβ, labeled as in A, at the surface of control or CK-666–treated Kit225 GFP-IL-2Rγ cells in the absence (−IL-2) or presence (+IL-2) of IL-2. Magnifications of labeled IL-2Rβ (dashed white squares) are shown below. Scale bars are shown. (D) Quantification of labeled IL-2Rβ, according to its PM association, at the PM of control or CK-666–treated cells (±IL-2). Results are expressed as a percentage of total beads found at the PM.
Fig. 6.
Fig. 6.
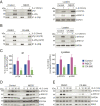
Cholesterol and actin differently impact IL-2–dependent signal transduction. (A) Lysates of Kit225 GFP-IL-2Rγ control or MβCD-treated cells, stimulated or not with IL-2 for 30 min at 37 °C, were immunoprecipitated (IP) with an antibody against IL-2Rβ (Left). Western blots were probed with antibodies against phosphotyrosine (pTyr; 4G10), IL-2Rγ (AF-284), and IL-2Rβ (C-20). The respective lysates are shown (Right) and were immunoblotted with antibodies against phospho-STAT5A (p-STAT5A), phospho-ERK1/2 (p-ERK1/2), and glyceraldehyde-3-phosphate dehydrogenase (GAPDH). (B) Lysates of Kit225 GFP-IL-2Rγ control or CK-666–treated cells, stimulated or not with IL-2 for 30 min at 37 °C, were immunoprecipitated with an antibody against IL-2Rβ (Left). Western blots were probed as in A for both IP and lysates. (C) Quantifications of A and B. IP quantifications (Left) are represented as a percentage of the control, normalized to the amount of IL-2Rβ that was immunoprecipitated. Quantifications of lysates (Right) are shown as a percentage of the control, normalized to the respective levels of GAPDH (mean ± SEM from four independent experiments for MβCD and three independent experiments for CK-666). (D) Lysates from Kit225 GFP-IL-2Rγ cells nontreated (control) or treated with MβCD and stimulated or not with IL-2 for 0, 5, 10, 30, and 60 min at 37 °C. Proteins were detected by western blot using antibodies against p-STAT5A, p-ERK1/2, GAPDH, STAT5A, and ERK2. (E) Lysates from Kit225 GFP-IL-2Rγ control or CK-666–treated cells stimulated or not with IL-2 for 0, 5, 10, 30, and 60 min at 37 °C. Samples were immunoblotted as in D. DMSO, dimethyl sulfoxide.
Fig. 7.
Fig. 7.
Model for IL-2Rγ clustering. (A) At steady state, IL-2Rγ is present at the PM as small clusters (with up to three molecules) representing newly secreted and/or abortive endocytic events, medium clusters (four to six molecules) that are endocytic competent, and large clusters (with more than six molecules) that are stalled. (B) Stimulation with IL-2 promotes clustering of IL-2Rγ, the formation of endocytic competent clusters (medium clusters), and initiation of the signaling cascade by oligomerization of IL-2Rβ and IL-2Rγ. (C) Lipid raft disruption leads to the enhanced lateral diffusion of receptor molecules and their stochastic interaction within the structured compartments defined by the actin cytoskeleton meshwork. This promotes the assembly of large clusters, inhibiting IL-2R endocytosis while inducing robust signaling events arising from the interaction of IL-2Rβ and IL-2Rγ. (D) Disruption of the actin cytoskeleton promotes assembly of large IL-2Rγ clusters due to the increased lateral diffusion of free diffusing and lipid raft–bound receptors, leading to a defect in endocytosis. In this case, the absence of oligomerization between the β- and γ-chains of the receptor prevents the initiation of the IL-2–mediated signaling cascade.

References

    1. Stachowiak J. C., et al. ., Membrane bending by protein-protein crowding. Nat. Cell Biol. 14, 944–949 (2012). - PubMed
    1. Kaksonen M., Roux A., Mechanisms of clathrin-mediated endocytosis. Nat. Rev. Mol. Cell Biol. 19, 313–326 (2018). - PubMed
    1. Liu A. P., Aguet F., Danuser G., Schmid S. L., Local clustering of transferrin receptors promotes clathrin-coated pit initiation. J. Cell Biol. 191, 1381–1393 (2010). - PMC - PubMed
    1. Stachowiak J. C., Brodsky F. M., Miller E. A., A cost-benefit analysis of the physical mechanisms of membrane curvature. Nat. Cell Biol. 15, 1019–1027 (2013). - PMC - PubMed
    1. Busch D. J., et al. ., Intrinsically disordered proteins drive membrane curvature. Nat. Commun. 6, 7875 (2015). - PMC - PubMed

Publication types