. 2021 Nov 2;97(18):e1823-e1834.
doi: 10.1212/WNL.0000000000012775. Epub 2021 Sep 9.

Predicting Symptom Onset in Sporadic Alzheimer Disease With Amyloid PET

Affiliations

Predicting Symptom Onset in Sporadic Alzheimer Disease With Amyloid PET

Suzanne E Schindler et al. Neurology. .

Abstract

Background and objectives: To predict when cognitively normal individuals with brain amyloidosis will develop symptoms of Alzheimer disease (AD).

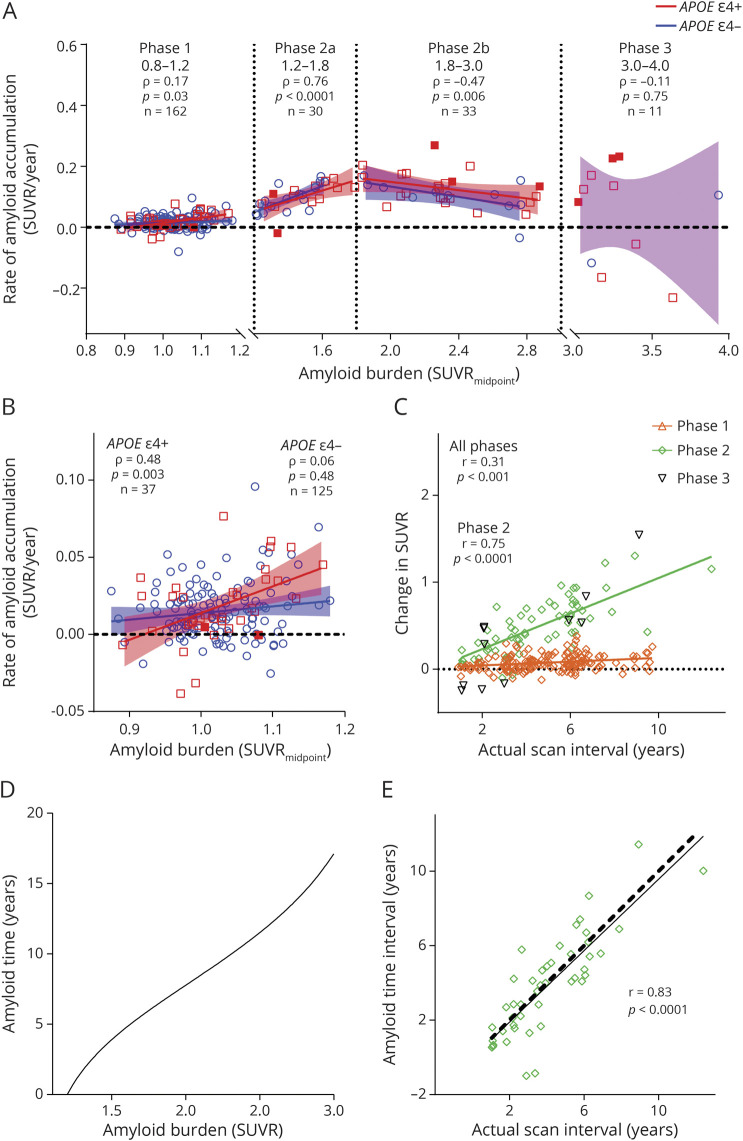
Methods: Brain amyloid burden was measured by amyloid PET with Pittsburgh compound B. The mean cortical standardized uptake value ratio (SUVR) was transformed into a timescale with the use of longitudinal data.

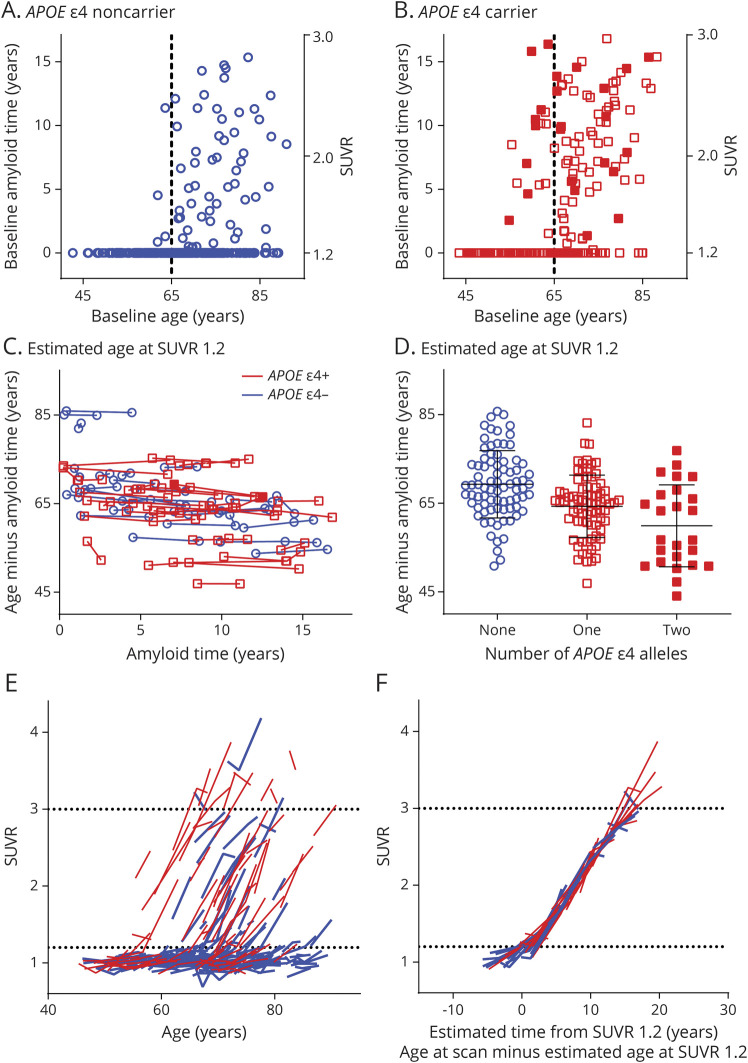
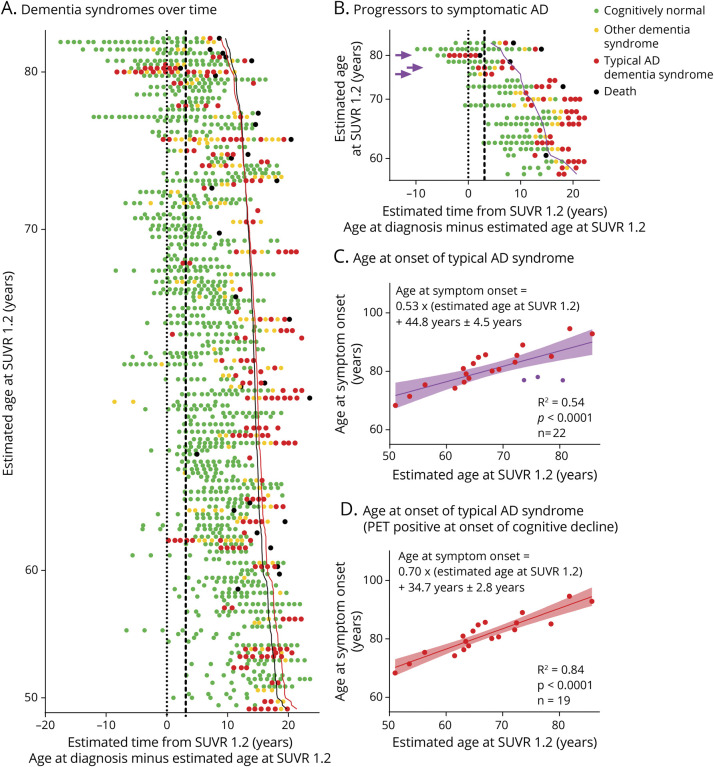
Results: Amyloid accumulation was evaluated in 236 individuals who underwent >1 amyloid PET scan. The average age was 66.5 ± 9.2 years, and 12 individuals (5%) had cognitive impairment at their baseline amyloid PET scan. A tipping point in amyloid accumulation was identified at a low level of amyloid burden (SUVR 1.2), after which nearly all individuals accumulated amyloid at a relatively consistent rate until reaching a high level of amyloid burden (SUVR 3.0). The average time between levels of amyloid burden was used to estimate the age at which an individual reached SUVR 1.2. Longitudinal clinical diagnoses for 180 individuals were aligned by the estimated age at SUVR 1.2. In the 22 individuals who progressed from cognitively normal to a typical AD dementia syndrome, the estimated age at which an individual reached SUVR 1.2 predicted the age at symptom onset (R 2 = 0.54, p < 0.0001, root mean square error [RMSE] 4.5 years); the model was more accurate after exclusion of 3 likely misdiagnoses (R 2 = 0.84, p < 0.0001, RMSE 2.8 years).

Conclusion: The age at symptom onset in sporadic AD is strongly correlated with the age at which an individual reaches a tipping point in amyloid accumulation.


Figures

Figure 1
Figure 1. Transformation of Amyloid PET Mean Cortical SUVR Into Amyloid Time
Rate of amyloid accumulation for each individual was determined by linear regression and anchored at the estimated standardized uptake value ratio (SUVR) halfway through the follow-up period (SUVRmidpoint) (A). Note that the y-axis represents rate of change, not total amyloid burden. Solid red squares represent APOE ε4 homozygotes (ε4/ε4); red open squares represent ε4 heterozygotes (ε4/ε2 or ε4/ε3); and blue circles represent APOE ε4 noncarriers. Rate of change for each individual was correlated (Spearman) with SUVRmidpoint over phases denoted by vertical dotted lines. Solid lines indicate the linear regression of amyloid accumulation as a function of amyloid burden for APOE ε4 carriers (red) and noncarriers (blue). At SUVR ≤1.2, the rate of amyloid accumulation was correlated (Spearman) with amyloid burden in APOE ε4 carriers but not noncarriers (B). One point with a low rate was omitted for improved data visualization. Change in amyloid burden (last SUVR minus first SUVR) was linearly correlated (Pearson) with the time between scans (last scan date minus first scan date) (C). For individuals with an SUVRmidpoint between SUVR 1.2 and 3.0, the estimated years between 2 SUVR values was calculated by integrating the reciprocal of the modeled rate of amyloid accumulation (D). Amyloid time was defined as the estimated years from SUVR 1.2. A cross-validation approach showed that for individuals with at least 2 scans between SUVR 1.2 and 3.0, the amyloid time interval (based on the last SUVR minus the first SUVR) was highly correlated (Pearson) with actual time interval by dates (E). Solid line represents the linear regression between the amyloid time interval and actual time interval. Dashed black line represents a perfect correlation.
Figure 2
Figure 2. Estimating the Age at Which an Individual Reached SUVR 1.2
Amyloid time at the baseline amyloid PET scan was plotted as a function of an individual's age at the time of the scan in APOE ε4 noncarriers (A) and carriers (B). Solid red squares represent APOE ε4 homozygotes (ε4/ε4);, red open squares represent ε4 heterozygotes (ε4/ε2 or ε4/ε3); and blue circles represent APOE ε4 noncarriers. Individuals with a standardized uptake value ratio (SUVR) ≤1.2 were assigned an amyloid time of 0 for visualization. Dashed vertical lines represent age 65 years. Age at which an individual reached SUVR 1.2 was estimated by subtracting amyloid time (if > 0) from age and was consistent across multiple scans (C). Estimated age at which an individual reached SUVR 1.2 was averaged across all scans from the individual and was plotted as a function of APOE ε4 genotype. Horizontal lines represent the mean and SD for each group (D). Trajectories of SUVR as a function of age were plotted for individuals with longitudinal amyloid PET (E). Red lines represent APOE ε4 carriers; blue lines represent noncarriers. Subtracting the estimated age at SUVR 1.2 from the age at each scan aligned SUVR trajectories across the cohort (F). Horizontal dotted lines represent SUVR 1.2 and 3.0 (E and F).
Figure 3
Figure 3. Visualizing Dementia Syndromes Over Time and Estimating Age at Symptom Onset
At each clinical assessment, clinicians who were blinded to biomarker status and the results of prior clinical assessments formulated the Clinical Dementia Rating (CDR) score; individuals with a CDR of ≥0.5 were considered to have a dementia syndrome, and the probable etiology of the dementia syndrome was diagnosed from clinical features. Diagnoses from 1,384 assessments on 180 individuals were plotted by the estimated years from standardized uptake value ratio (SUVR) 1.2 (A). Each row of points corresponds to 1 individual. Each point represents 1 clinical assessment, and the color of the point denotes the dementia syndrome category: green, cognitively normal; yellow, other dementia syndrome (uncertain, atypical, or suspected non–Alzheimer disease [AD] dementia); and red, typical AD dementia syndrome. Black points represent the date of death if applicable. Individuals were arranged vertically in order of estimated age at SUVR 1.2. Dotted vertical line represents SUVR 1.2; dashed vertical line represents SUVR 1.42, the established cutoff for amyloid PET positivity. Solid black line represents the estimated time from SUVR 1.2 when 50% of individuals would have a typical AD dementia syndrome based on a logistic regression of the dementia syndrome category at the baseline clinical assessment (eTable 2, links.lww.com/WNL/B540). Solid red line represents the estimated time of symptom onset as predicted by the model in (D). Twenty-two individuals who were cognitively normal at their baseline clinical assessment and had a typical AD dementia syndrome at their last clinical assessment were defined as progressors to symptomatic AD (B). Purple line represents the predicted age at which the progressors were first diagnosed with typical AD dementia syndrome on the basis of the estimated age at which individuals reached SUVR 1.2 (C). Omitting 3 individuals (purple arrowheads in B, purple points in C) who were amyloid PET negative at the onset of cognitive decline improved prediction of the age at symptom onset (D).

References

    1. Bateman RJ, Xiong C, Benzinger TL, et al. . Clinical and biomarker changes in dominantly inherited Alzheimer's disease. N Engl J Med. 2012;367(9):795-804. - PMC - PubMed
    1. Villemagne VL, Burnham S, Bourgeat P, et al. . Amyloid beta deposition, neurodegeneration, and cognitive decline in sporadic Alzheimer's disease: a prospective cohort study. Lancet Neurol. 2013;12(4):357-367. - PubMed
    1. Harper JD, Lansbury PT Jr. Models of amyloid seeding in Alzheimer's disease and scrapie: mechanistic truths and physiological consequences of the time-dependent solubility of amyloid proteins. Annu Rev Biochem. 1997;66:385-407. - PubMed
    1. Morel B, Conejero-Lara F. Early mechanisms of amyloid fibril nucleation in model and disease-related proteins. Biochim Biophys Acta Proteins Proteom. 2019;1867(11):140264. - PubMed
    1. Srivastava AK, Pittman JM, Zerweck J, et al. . β-Amyloid aggregation and heterogeneous nucleation. Protein Sci. 2019;28(9):1567-1581. - PMC - PubMed

Publication types