Multicenter Study

Accelerated functional brain aging in pre-clinical familial Alzheimer's disease

Julie Gonneaud et al. Nat Commun. .

Abstract

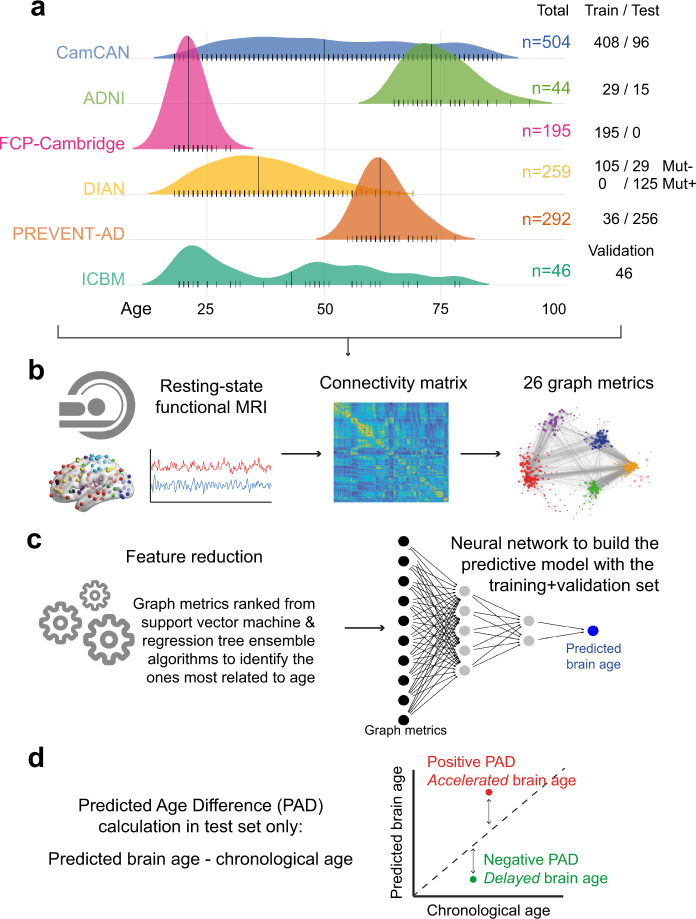
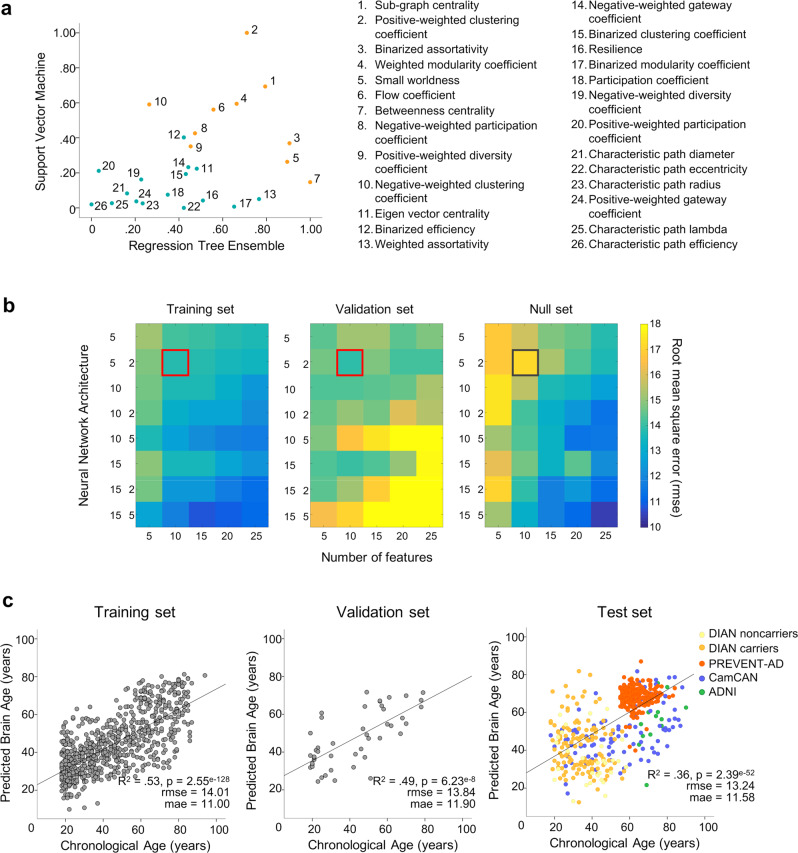
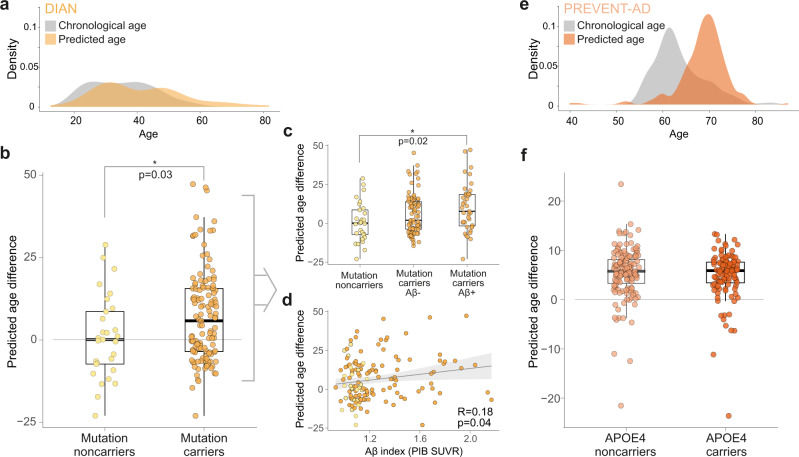
Resting state functional connectivity (rs-fMRI) is impaired early in persons who subsequently develop Alzheimer's disease (AD) dementia. This impairment may be leveraged to aid investigation of the pre-clinical phase of AD. We developed a model that predicts brain age from resting state (rs)-fMRI data, and assessed whether genetic determinants of AD, as well as beta-amyloid (Aβ) pathology, can accelerate brain aging. Using data from 1340 cognitively unimpaired participants between 18-94 years of age from multiple sites, we showed that topological properties of graphs constructed from rs-fMRI can predict chronological age across the lifespan. Application of our predictive model to the context of pre-clinical AD revealed that the pre-symptomatic phase of autosomal dominant AD includes acceleration of functional brain aging. This association was stronger in individuals having significant Aβ pathology.


Conflict of interest statement

The authors declare no competing interests.

Figures

Fig. 1
Fig. 1. Methodology overview.
a Multiple cohorts covering the lifespan were included in the study. They were separated into a training and validation set, both used to develop the predictive brain age model, and a test set in which our model was applied. b All participants underwent resting state functional magnetic resonance imaging that was processed with a uniform pipeline. Functional connectivity matrices were generated from the Power atlas, from which graph metrics were calculated. Graph metrics were the input in our brain age model, and thus all possible metrics were of interest. c The first step toward building the model was to rank the different graph metrics from the most to least related to aging in our training set, to determine an order of importance to our model inputs using both support vector machine and regression tree ensemble algorithms. Neural networks were then tested to identify the best brain age model. Different architectures were tested, and the model applied in the training set that best generalized to the validation set was chosen as the final model (see Fig. 2). d The model was applied to the left-out test set and our measure of interest was the predicted age difference (PAD). Mut−: mutation non-carriers, Mut+: mutation carriers, MRI: magnetic resonance imaging, PAD: predicted age difference.
Fig. 2
Fig. 2. Features ranking and neural networks performance.
a Scatter plots of SVM model weights (y-axis) and ensemble tree feature importance (x-axis). Model weights are absolute value, and normalized such that 1 indicates highest importance. Numbers next to data points indicate their rank (i.e., 1 = highest average rank between both SVM and ensemble models; orange dots correspond to the top 10 features, blue dots represent lower-ranked features). b Root mean square error of different neural network models with inputs sorted according to rank for the training set (left), and the validation set (middle). Values were averaged over 3 iterations of the models. Neural networks trained with randomly-ranked inputs served as our null models (right). The x-axis indicates the number of inputs into the model (number of graph metrics) while the y-axis indicates the network architecture. For example, 5 means 1 hidden layer with 5 units, 5 2 means 2 hidden layers, the first one with 5 units and the second with 2 units. Darker (blue) colors indicate higher accuracy, while lighter (yellow) colors indicate lower accuracy. The red square identifying the model that provides the better generalizability in the validation set (lowest rmse) contains 2 hidden layers of 5 and 2 units, and uses the 10 highest-ranked graph metrics as input. The same neural network trained on randomly-ranked inputs (null model, gray square) provides lower accuracy. c Brain age model performance across datasets. Correlations between chronological age (x-axis) and age predicted by the neural network (y-axis) are represented for the training (n = 773), validation (n = 46) and test (n = 521) sets. Statistical values (c) were obtained from Pearson’s correlations (two-sided test, with no adjustment). Source data are provided as a Source data file. SVM: support vector machine, rmse: root mean square error, mae: mean absolute error.
Fig. 3
Fig. 3. Predicted age difference in DIAN and PREVENT-AD.
Density plot of chronological age vs predicted age in the test set participants in DIAN (n = 154) (a). Brain age is overestimated in autosomal dominant mutation carriers (n = 125) compared to non-carriers (n = 29) (b). The overestimation in mutation carriers is in part due to Aβ, with a difference between mutation noncarriers (n = 29) and Aβ+ mutation carriers (n = 39) only (Aβ− mutation carriers [n = 75] did not differ from the other groups) (c), and an association between Aβ load and predicted age difference across the whole cohort (n = 154) (d). Light (yellow) colors represent DIAN mutation non-carriers and darker (orange) colors represent DIAN mutation carriers. Density plot of chronological age vs predicted age in the test set participants in PREVENT-AD (n = 256) (e). In individuals at risk of sporadic Alzheimer’s disease, brain age is overestimated irrespectively of APOE ε4 genotype (f). Light (salmon) colors represent PREVENT-AD APOE ε4 non-carriers (n = 147) and darker (dark orange) colors represent PREVENT-AD APOE ε4 carriers (n = 108). For b, c and f the interquartile range (25th Percentile, Median and 75th Percentile), the whiskers (lines indicating variability outside the upper and lower quartiles minimum value) and the individual dots are presented. For d, shaded (gray) area represents confidence intervals (95%). Statistical values were obtained from general linear models (b, c, f) or partial Pearson’s correlations (d), controlling for chronological age, without further adjustment (two-sided tests). Aβ: beta-amyloid, Aβ−: amyloid-negative, Aβ+: amyloid-positive; APOE4: apolipoprotein E4, PIB: Pittsburgh compound B, SUVR: standardized uptake value ratio. Source data are provided as a Source data file.

References

    1. Jagust W. Vulnerable neural systems and the borderland of brain aging and neurodegeneration. Neuron. 2013;77:219–234. doi: 10.1016/j.neuron.2013.01.002. - DOI - PMC - PubMed
    1. Cole JH, Franke K. Predicting age using neuroimaging: innovative brain ageing biomarkers. Trends Neurosci. 2017;40:681–690. doi: 10.1016/j.tins.2017.10.001. - DOI - PubMed
    1. Franke K, Ziegler G, Klöppel S, Gaser C, Alzheimer’s Disease Neuroimaging Initiative. Estimating the age of healthy subjects from T1-weighted MRI scans using kernel methods: exploring the influence of various parameters. Neuroimage. 2010;50:883–892. doi: 10.1016/j.neuroimage.2010.01.005. - DOI - PubMed
    1. Mwangi B, Hasan KM, Soares JC. Prediction of individual subject’s age across the human lifespan using diffusion tensor imaging: a machine learning approach. Neuroimage. 2013;75:58–67. doi: 10.1016/j.neuroimage.2013.02.055. - DOI - PubMed
    1. Zhai, J. & Li, K. Predicting brain age based on spatial and temporal features of human brain functional networks. Front. Hum. Neurosci.13, 62 (2019). - PMC - PubMed

Publication types

MeSH terms

Substances