. 2021 Sep 9;7(1):79.
doi: 10.1038/s41531-021-00221-7.

A transcriptome-wide association study identifies susceptibility genes for Parkinson's disease

Affiliations

A transcriptome-wide association study identifies susceptibility genes for Parkinson's disease

Shi Yao et al. NPJ Parkinsons Dis. .

Abstract

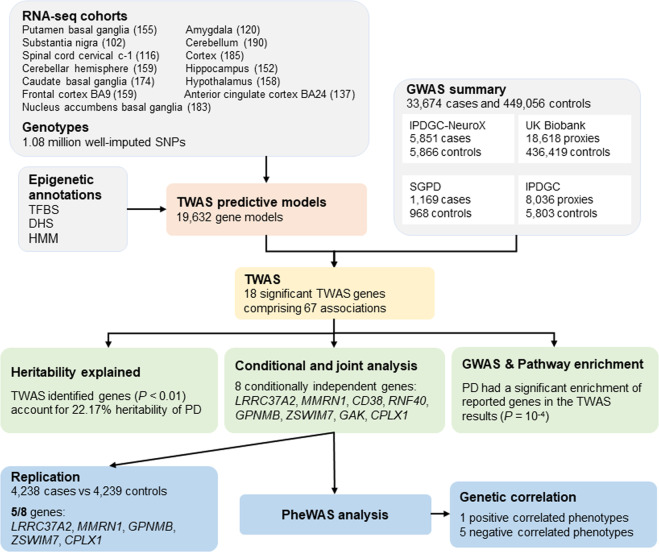
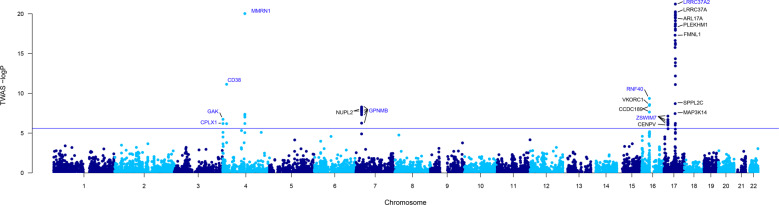
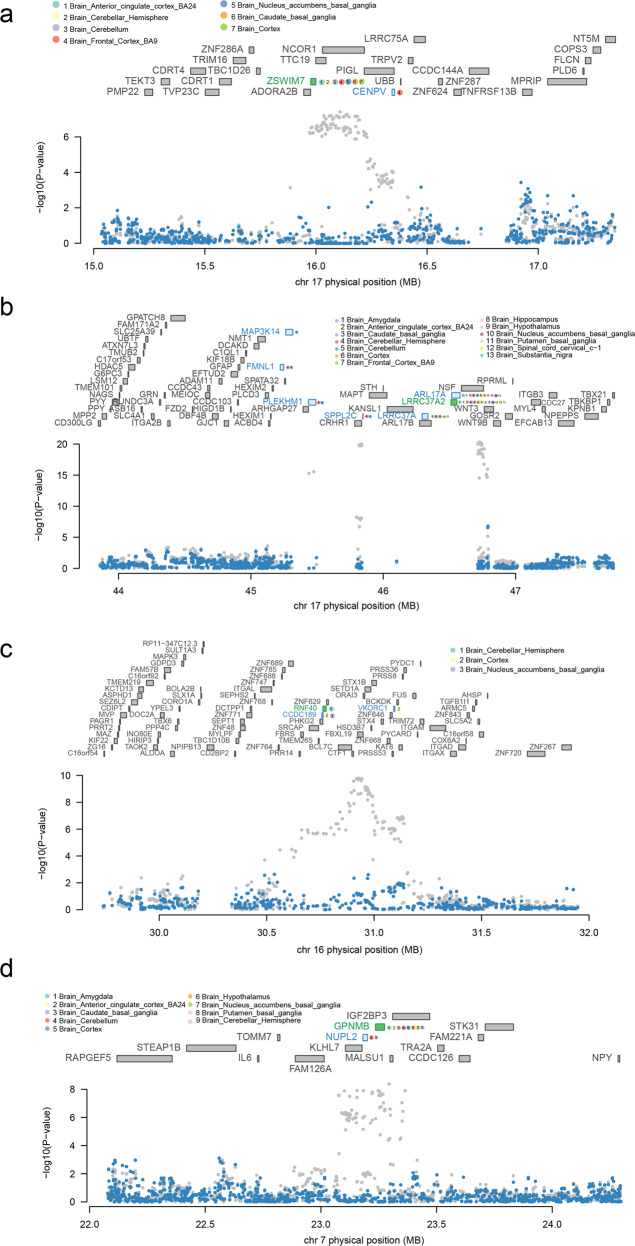
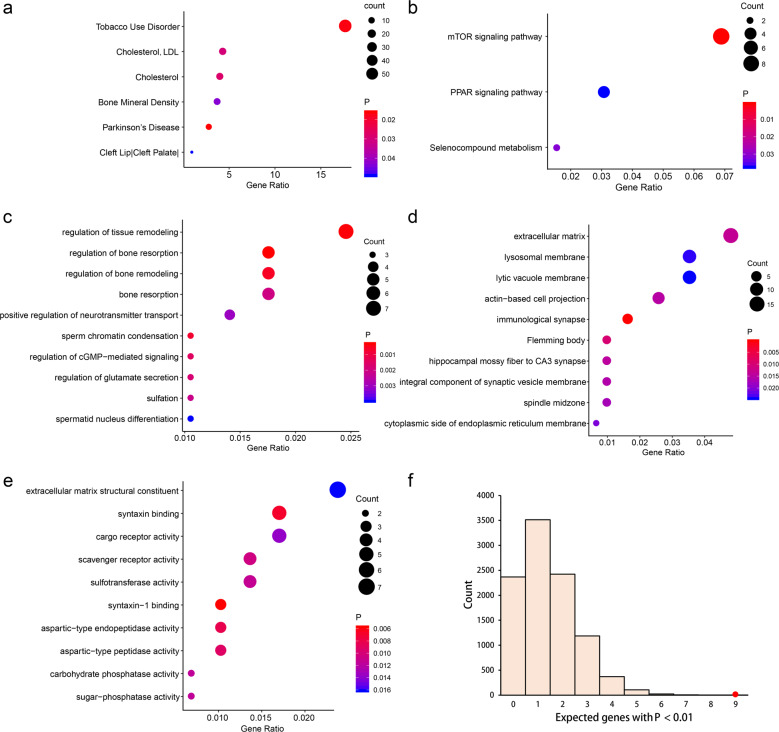
Genome-wide association study (GWAS) has seen great strides in revealing initial insights into the genetic architecture of Parkinson's disease (PD). Since GWAS signals often reside in non-coding regions, relatively few of the associations have implicated specific biological mechanisms. Here, we aimed to integrate the GWAS results with large-scale expression quantitative trait loci (eQTL) in 13 brain tissues to identify candidate causal genes for PD. We conducted a transcriptome-wide association study (TWAS) for PD using the summary statistics of over 480,000 individuals from the most recent PD GWAS. We identified 18 genes significantly associated with PD after Bonferroni corrections. The most significant gene, LRRC37A2, was associated with PD in all 13 brain tissues, such as in the hypothalamus (P = 6.12 × 10⁻²²) and nucleus accumbens basal ganglia (P = 5.62 × 10⁻²¹). We also identified eight conditionally independent genes, including four new genes at known PD loci: CD38, LRRC37A2, RNF40, and ZSWIM7. Through conditional analyses, we demonstrated that several of the GWAS significant signals on PD could be driven by genetically regulated gene expression. The most significant TWAS gene LRRC37A2 accounts for 0.855 of the GWAS signal at its loci, and ZSWIM7 accounts for all the GWAS signals at its loci. We further identified several phenotypes previously associated with PD by querying the single nucleotide polymorphisms (SNPs) in the final model of the identified genes in phenome databases. In conclusion, we prioritized genes that are likely to affect PD by using a TWAS approach and identified phenotypes associated with PD.


Conflict of interest statement

The authors declare no competing interests.

Figures

Fig. 1
Fig. 1. The workflow of the study.
GWAS, genome-wide association study; TFBS, transcription factor binding site; DHS, DNase I hypersensitive sites; HMM, chromatin state segmentation by hidden Markov model; TWAS, transcriptome-wide association study; PD, Parkinson’s disease; PheWAS, phenome-wide association study.
Fig. 2
Fig. 2. Manhattan plot of the TWAS results for PD.
The blue line represents the Bonferroni-corrected significant thresholds, P = 2.55 × 10−6. Conditionally independent genes are listed in blue letters.
Fig. 3
Fig. 3. Regional association of TWAS hits.
a Chromosome 17 regional association plot (part 1). b Chromosome 17 regional association plot (part 2). c Chromosome 16 regional association plot. d Chromosome 7 regional association plot. The marginally associated TWAS genes are shown in blue, and the conditionally significant genes are shown in green. The bottom panel shows a regional Manhattan plot of the GWAS data before (gray) and after (blue) conditioning on the green genes’ predicted expression.
Fig. 4
Fig. 4. Pathway enrichment results of TWAS-identified genes.
a GAD disease enrichment analyses of TWAS genes. b KEGG pathway enrichment analyses of TWAS genes. ce Top ten GO terms enriched in TWAS genes, including biological processes (c), cellular component (d), and molecular function (e). f GWAS Catalog enrichment analyses of TWAS genes. The histogram shows the expected number of genes with P < 0.01 based on 10,000 random permutations. The large red point shows the observed number of previously known PD genes that fall below this threshold.
Fig. 5
Fig. 5. Genetic correlation between PD and phenotypes associated with top PD eQTLs.
*P < 0.05/122, **P < 0.01/122, error bars indicate standard error of the genetic correlations.

References

    1. Dauer W, Przedborski S. Parkinson’s disease: mechanisms and models. Neuron. 2003;39:889–909. doi: 10.1016/S0896-6273(03)00568-3. - DOI - PubMed
    1. Ascherio A, Schwarzschild MA. The epidemiology of Parkinson’s disease: risk factors and prevention. Lancet Neurol. 2016;15:1257–1272. doi: 10.1016/S1474-4422(16)30230-7. - DOI - PubMed
    1. Do CB, et al. Web-based genome-wide association study identifies two novel loci and a substantial genetic component for Parkinson’s disease. PLoS Genet. 2011;7:e1002141. doi: 10.1371/journal.pgen.1002141. - DOI - PMC - PubMed
    1. Hamza TH, Payami H. The heritability of risk and age at onset of Parkinson’s disease after accounting for known genetic risk factors. J. Hum. Genet. 2010;55:241–243. doi: 10.1038/jhg.2010.13. - DOI - PMC - PubMed
    1. Nalls MA, et al. Identification of novel risk loci, causal insights, and heritable risk for Parkinson’s disease: a meta-analysis of genome-wide association studies. Lancet Neurol. 2019;18:1091–1102. doi: 10.1016/S1474-4422(19)30320-5. - DOI - PMC - PubMed