. 2021 Sep 9;11(1):17935.
doi: 10.1038/s41598-021-95497-3.

Chemogenetic modulation of histaminergic neurons in the tuberomamillary nucleus alters territorial aggression and wakefulness

Affiliations

Chemogenetic modulation of histaminergic neurons in the tuberomamillary nucleus alters territorial aggression and wakefulness

Fumito Naganuma et al. Sci Rep. .

Abstract

Designer receptor activated by designer drugs (DREADDs) techniques are widely used to modulate the activities of specific neuronal populations during behavioural tasks. However, DREADDs-induced modulation of histaminergic neurons in the tuberomamillary nucleus (HATMN neurons) has produced inconsistent effects on the sleep-wake cycle, possibly due to the use of Hdc-Cre mice driving Cre recombinase and DREADDs activity outside the targeted region. Moreover, previous DREADDs studies have not examined locomotor activity and aggressive behaviours, which are also regulated by brain histamine levels. In the present study, we investigated the effects of HATMN activation and inhibition on the locomotor activity, aggressive behaviours and sleep-wake cycle of Hdc-Cre mice with minimal non-target expression of Cre-recombinase. Chemoactivation of HATMN moderately enhanced locomotor activity in a novel open field. Activation of HATMN neurons significantly enhanced aggressive behaviour in the resident-intruder test. Wakefulness was increased and non-rapid eye movement (NREM) sleep decreased for an hour by HATMN chemoactivation. Conversely HATMN chemoinhibition decreased wakefulness and increased NREM sleep for 6 h. These changes in wakefulness induced by HATMN modulation were related to the maintenance of vigilance state. These results indicate the influences of HATMN neurons on exploratory activity, territorial aggression, and wake maintenance.


Conflict of interest statement

The authors declare no competing interests.

Figures

Figure 1
Figure 1
Specific expression of Hdc-hM3Dq/Hdc-hM4Di in the TMN and confirmation of neuronal activation or inhibition by CNO. (A) A representative hypothalamic section from an Hdc-Cre mouse injected with AAV-hM3Dq. CNO injection induced c-Fos expression (black nuclei) in mCherry-expressing HATMN neurons (brown) (A′). (B) Representative section from an Hdc-Cre mouse injected with AAV-hM4Di. c-Fos expression (black) was substantially lower in mCherry-positive neurons (brown) after CNO injection (B′). Scale bar = 200 μm. 3 V, third ventricle; E1-2 and E4-5, neuronal clusters of HATMN. Arrows: mCherry-positive/c-Fos-negative neurons, Black arrow heads: mCherry-positive/c-Fos-positive neurons, White arrow heads: mCherry-negative/c-Fos-positive neurons. These coronal brain sections were located − 2.18 mm anterior–posterior from bregma.
Figure 2
Figure 2
Enhanced locomotor activity in the open field (OF) by chemogenetic HATMN neuron activation depended on environmental novelty. Locomotor parameters were compared in the OF among Hdc-hM3Dq mice (n = 6, AD, IL) and Hdc-hM4Di mice (n = 5, EH, MP) for 30 min after CNO or SA injection by two-way RM ANOVA with main factors trial number (AH: novel OF in trial 1, IP: non-novel OF in trial 2) and drug treatment (CNO or SA), followed by Sidak's post hoc tests. (A) Total movement distance of Hdc-hM3Dq mice after CNO or SA injection during trial 1 (time: F = 7.48, P < 0.0001, drug: F = 5.77, P = 0.037, trial × drug interaction: F = 1.70, P = 0.15). (B) Average speed of Hdc-hM3Dq mice after CNO or SA injection during trial 1 (time: F = 7.48, P < 0.0001; drug: F = 5.77, P = 0.037; interaction: F = 1.70, P = 0.15). (C) Total movement time of Hdc-hM3Dq mice after CNO or SA injection during trial 1 (time: F = 8.77, P < 0.0001; drug: F = 2.91, P = 0.12; interaction: F = 1.46, P = 0.22). (D) Time spent in the central area by Hdc-hM3Dq mice after CNO or SA injection during trial 1 (time: F = 1.27, P = 0.29; drug: F = 1.02, P = 0.34; interaction: F = 0.77, P = 0.58). (E) Total movement distance of Hdc-hM4Di mice after CNO or SA injection during trial 1 (time: F = 9.92, P < 0.0001; drug: F = 0.46, P = 0.52; interaction: F = 1.80, P = 0.14). (F) Average speed of Hdc-hM4Di mice after CNO or SA injection during trial 1 (time: F = 9.96, P < 0.0001; drug: F = 0.46, P = 0.52; interaction: F = 1.80, P = 0.13). (G) Total movement time of Hdc-hM4Di mice after CNO or SA injection during trial 1 (time: F = 10.54, P < 0.0001; drug: F = 0.84, P = 0.39; interaction: F = 1.52, P = 0.21). (H) Time spent in the central area by Hdc-hM4Di mice after CNO or SA injection during trial 1 (time: F = 1.94, P = 0.11; drug: F = 0.0017, P = 0.97; interaction: F = 0.87, P = 0.51). (I) Total movement distance of Hdc-hM3Dq mice after CNO or SA injection during trial 2 (time: F = 3.44, P = 0.0096; drug: F = 5.05, P = 0.048; interaction: F = 0.31, P = 0.90). (J) Average speed of Hdc-hM3Dq mice after CNO or SA injection during trial 2 (time: F = 3.44, P = 0.0096; drug: F = 5.05, P = 0.048; interaction F = 0.31, P = 0.90). (K) Total movement time of Hdc-hM3Dq mice after CNO or SA injection during trial 2 (time: F = 2.05, P = 0.88; drug: F = 3.43, P = 0.094; interaction: F = 0.51, P = 0.77). L, Time spent in the centre area by Hdc-hM3Dq mice after CNO or SA injection during trial 2 (time: F = 2.22, P = 0.070; drug: F = 0.20, P = 0.67; interaction: F = 1.15, P = 0.35). (M) Total movement distance of Hdc-hM4Di mice after CNO or SA injection during trial 2 (time: F = 7.38, P < 0.0001; drug: F = 0.26, P = 0.62; interaction: F = 0.63, P = 0.68). (N) Average speed of Hdc-hM4Di mice after CNO or SA injection during trial 2 (time: F = 7.38, P < 0.0001, drug: F = 0.26, P = 0.62, interaction: F = 0.63, P = 0.68). (O) Total movement time of Hdc-hM4Di mice after CNO or SA injection during trial 2 (time: F = 5.98, P = 0.0003; drug: F = 0.12, P = 0.74; interaction: F = 1.27, P = 0.30). (P) Time spent in the centre area by Hdc-hM4Di mice after CNO or SA injection during trial 2 (time: F = 1.06, P = 0.40; drug: F = 0.54, P = 0.49; interaction: F = 3.45, P = 0.011). Data presented as mean ± S.E. P < 0.05 by two-way RM ANOVA for ‘time’ and ‘drug’, *P < 0.05 by post hoc Sidak’s multiple comparisons test.
Figure 3
Figure 3
Chemogenetic activation of HATMN neurons enhanced aggression in the resident‒intruder test. The parameters of aggressive behaviours were compared b Hdc-hM3Dq mice (A, B, D, E, G and H) and Hdc-hM4Di mice (A, C, D, F, G and I) for 10 min after CNO or SA injection. (A, D, G) The combined results of trials 1 and 2, compared by Mann–Whitney U test (n = 8 or 10). (B, E, H) (n = 4), or (C, F, I) (n = 5) indicate results from each trial in Hdc-hM3Dq or Hdc-hM4Di mice, respectively. The results were compared by two-way RM ANOVA with main factors trial number (1 or 2) and drug treatment (CNO of SA), followed by Sidak’s post hoc tests. (A) Total number of aggressive behaviours (P = 0.027 by Mann–Whitney U test). (B) Total cumulative duration of aggressive behaviours (P = 0.013 by Mann–Whitney U test). (C) Total latency to first aggressive behaviour (no significant differences by Mann–Whitney U test). (D) Number of aggressive behaviours of Hdc-hM3Dq mice after CNO or SA injection in each trial (trial: F = 0.74, P = 0.42; drug: F = 7.51, P = 0.034; trial × drug interaction: F = 2.12, P = 0.20). (E) Cumulative duration of aggressive behaviours of Hdc-hM3Dq mice after CNO or SA injection in each trial (trial: F = 1.58, P = 0.26; drug: F = 16.68, P = 0.0065; interaction: F = 3.06, P = 0.13). (F) Latency to first aggressive behaviour of Hdc-hM3Dq mice after CNO or SA injection in each trial (n = 4; trial: F = 0.028, P = 0.87; drug: F = 3.89, P = 0.096; interaction: F = 2.58, P = 0.16). (G) Number of aggressive behaviours of Hdc-hM4Di mice after CNO or SA injection in each trial (trial: F = 0.059, P = 0.81; drug: F = 0.027, P = 0.87; interaction: F = 2.00, P = 0.12). (H) Cumulative duration of aggressive behaviours of Hdc-hM4Di mice after CNO or SA injection in each trial (trial: F = 0.0079, P = 0.93; drug: F = 0.011, P = 0.92; interaction: F = 1.50, P = 0.26). (I) Latency to first aggressive behaviour of Hdc-hM4Di mice after CNO or SA injection in each trial (n = 5; trial: F = 0.78, P = 0.40; drug: F = 1.12, P = 0.32; interaction: F = 2.44, P = 0.16). Data are presented as mean ± S.E.M. (horizontal bars and error bars) with superimposed individual data points (closed circles). P < 0.05 by two-way RM ANOVA with main factors ‘time’ and ‘drug’, *P < 0.05 by post hoc Sidak’s multiple comparisons test. §P < 0.05. by Mann–Whitney U test.
Figure 4
Figure 4
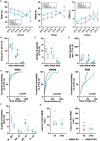
Chemogenetic activation of HATMN neurons increased wakefulness and decreased NREM sleep during light periods. Hdc-hM3Dq mice (n = 7) were injected with CNO or SA at the indicated times and wake and sleep phases monitored by EEG/EMG. (A) Relative mean hourly wake, NREM sleep and REM sleep times (%) after CNO or SA injection at ZT3 (wake-time: F = 4.34, P = 0.0019; drug: F = 1.24, P = 0.29; time × drug interaction: F = 1.28, P = 0.29; NREM-time: F = 3.06, P = 0.016; drug: F = 1.31, P = 0.28; interaction: F = 1.46, P = 0.22; REM-time: F = 8.21, P < 0.0001; drug: F = 0.44, P = 0.52; interaction: F = 0.23, P = 0.95,; all by two-way RM ANOVA with main factors time and drug, followed by Sidak’s post hoc test). (B) Mean wake, NREM sleep and REM sleep times during ZT3-4 after CNO or SA injection at ZT3 (wake P = 0.0070 and NREM P = 0.0087 by Mann–Whitney U test). (C) Number of wake or sleep phase episodes during ZT3-4 after CNO or SA injection at ZT3 (no significant differences by Mann–Whitney U test). (D) Mean duration of sleep–wake state after CNO or SA injection at ZT3 (no significant differences by Mann–Whitney U test). (E) Vigilance state bout duration after CNO or SA injection at ZT3. Cumulative probability plots depict the relative distribution of the bout durations in each state during ZT3-4 (Wake P = 0.030, NREM P = 0.23 and REM P = 0.86 by Kolmogorov–Smirnov test). F, Frequencies of specific sleep–wake state transitions after CNO or SA injection at ZT3 (wake → NREM P = 0.30, NREM → REM P = 0.69, NREM → wake P = 0.36 and REM → wake P = 0.32 by Mann–Whitney U test). (G) Latency to the first NREM and REM sleep episode after CNO or SA injection at ZT3 (NREM P = 0.018 by Mann–Whitney U test). Data are presented as mean ± S.E.M. (horizontal bars and error bars) of n = 7 mice with (BD, F, G) or without (A) superimposed individual data points (close circles). P < 0.05 by two-way RM ANOVA with main factors ‘time’ and ‘drug’; *P < 0.05 by post hoc Sidak’s multiple comparisons test; §P < 0.05, §§P < 0.01 by Mann–Whitney U test.
Figure 5
Figure 5
Chemogenetic inhibition of HATMN neurons decreased wakefulness and increased NREM sleep during dark periods. Hdc-hM4Di mice (n = 6) were injected with CNO or SA at the indicated time and wake and sleep phases monitored by EEG/EMG. (A) Hourly mean wake, NREM sleep and REM sleep durations after CNO or SA injection at ZT12 (wake-time: F = 5.99, P = 0.0002; drug: F = 10.02, P = 0.010; time × drug interaction: F = 2.81, P = 0.026; NREM-time: F = 5.65, P = 0.0003; drug: F = 10.39, P = 0.0091; interaction: F = 2.28, P = 0.061; REM-time: F = 3.18, P = 0.014; drug: F = 1.26, P = 0.29; interaction: F = 2.32, P = 0.057; all analyses by two-way RM ANOVA with main factors time and drug, followed by Sidak’s post hoc test). (B) Mean wake, NREM sleep and REM sleep durations during ZT12–13 after CNO or SA injection at ZT12 (wake P = 0.015 and NREM P = 0.013 by Mann–Whitney U test) (C) Number of episodes during ZT12-13 after CNO or SA injection at ZT12 (no significant differences by Mann–Whitney U test). (D) Mean duration of sleep–wake state after CNO or SA injection at ZT12 (no significant differences by Mann–Whitney U test). (E) Vigilance state bout duration after CNO or SA injection at ZT12. Cumulative probability plots depict the relative distribution of the bout durations in each state during ZT12-13 (Wake P = 0.99, NREM P = 0.032 and REM P = 0.58 by Kolmogorov–Smirnov test). (F) Sleep–wake state transitions after CNO or SA injection at ZT12 (wake → NREM P = 0.29, NREM → REM P = 0.93, NREM → wake P = 0.22 and REM → wake P = 0.93 by Mann–Whitney U test). (G) Latency to first NREM and REM sleep episodes after CNO or SA injection at ZT12 (no significant difference by Mann–Whitney U test). Data are presented as mean ± S.E.M. of n = 6 mice with (BD, F, G) or without (A) superimposed individual data points (closed circles). P < 0.05 by two-way RM ANOVA with main factors ‘time’ and ‘drug’, *P < 0.05 by post hoc Sidak’s multiple comparisons test. §P < 0.05 by Mann–Whitney U test.
Figure 6
Figure 6
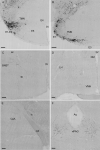
Projection targets of HATMN neurons. The presence of mCherry-immunoreactive HATMN somata and fibres were examined in coronal brain sections 6 months after AAV injections. (A) mCherry-immunoreactive HATMN neuronal somata and fibres in the ventrolateral TMN. (B) mCherry-immunoreactive HATMN neuronal somata and fibres in the caudal TMN. (CF) HATMN fibres in the bed nucleus of the stria terminalis (BNST) (C), lateral hypothalamus (LH) (D), central amygdala (CeA) (E) and ventrolateral periaqueductal grey (vlPAG) (F). Scale bar = 100 μm. ac anterior commissure, Aq aqueduct, DM dorsomedial hypothalamic nucleus, LH lateral hypothalamus, opt optic tract, SI substantia innominate, TMN tuberomamillary nucleus, VMH ventromedial hypothalamic nucleus, 3 V third ventricle. E1–E5, neuronal clusters of HATMN. Anterior–posterior locations (mm from bregma): (A) − 2.18 mm, (B) − 2.70 mm, (C) 0.14 mm, (D) − 0.46 mm, (E) − 1.34 mm and (F) − 4.24 mm.

References

    1. Haas HL, Sergeeva OA, Selbach O. Histamine in the nervous system. Physiol. Rev. 2008;88:1183–1241. doi: 10.1152/physrev.00043.2007. - DOI - PubMed
    1. Yoshikawa T, Nakamura T, Yanai K. Histaminergic neurons in the tuberomammillary nucleus as a control centre for wakefulness. Br. J. Pharmacol. 2020 doi: 10.1111/bph.15220. - DOI - PubMed
    1. Deisseroth K. Optogenetics: 10 years of microbial opsins in neuroscience. Nat. Neurosci. 2015;18:1213–1225. doi: 10.1038/nn.4091. - DOI - PMC - PubMed
    1. Roth BL. DREADDs for neuroscientists. Neuron. 2016;89:683–694. doi: 10.1016/j.neuron.2016.01.040. - DOI - PMC - PubMed
    1. Yu X, et al. Genetic lesioning of histamine neurons increases sleep–wake fragmentation and reveals their contribution to modafinil-induced wakefulness. Sleep. 2019 doi: 10.1093/sleep/zsz031. - DOI - PMC - PubMed

Publication types

MeSH terms

LinkOut - more resources