

Effects of an external compared to an internal focus of attention on the excitability of fast and slow(er) motor pathways
- PMID: 34504145
- PMCID: PMC8429756
- DOI: 10.1038/s41598-021-97168-9
Effects of an external compared to an internal focus of attention on the excitability of fast and slow(er) motor pathways
Abstract
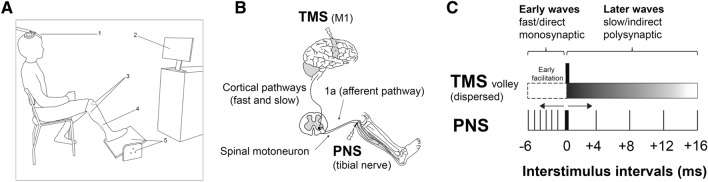
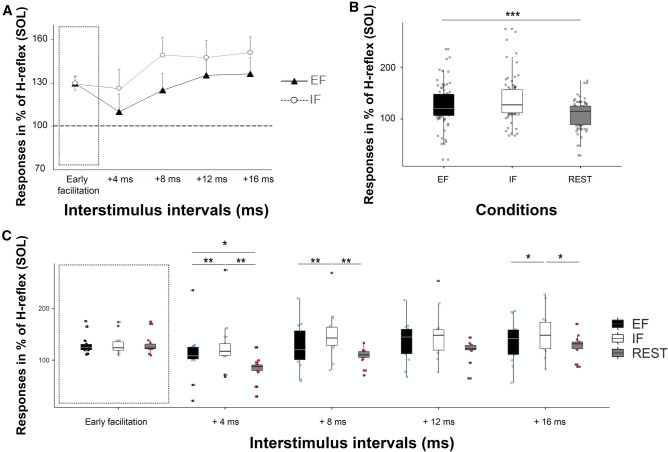
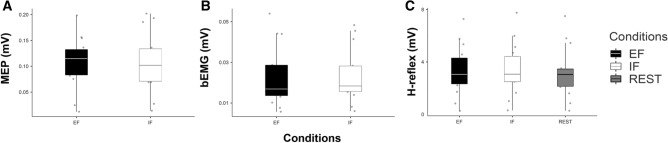
The neurophysiological mechanisms underlying the behavioural improvements usually associated with an external (EF) compared with an internal focus of attention (IF) remain poorly investigated. Surround inhibition in the primary cortex has been shown to be more pronounced with an EF, indicating a more spatial restriction of the motor command. However, the influence of different foci on the temporal aspect of the motor command, such as the modulation of fast versus slow(er) motor pathways, remains unknown and was therefore investigated in this study. Fourteen participants were asked to press on a pedal with the right foot to match its position with a target line displayed on a screen. The deviation of the pedal from the target line was used as a behavioural parameter and compared between both foci (EF vs IF). Additionally, conditioned H-reflexes were evoked during the motor task to assess the excitability of fast (direct) and slower (more indirect) motor pathways when adopting an EF or IF. With an EF compared to an IF, the motor performance was enhanced (P = .001; + 24%) and the activation of slow(er) motor pathways was reduced (P < 0.001, - 11.73%). These findings demonstrate for the first time that using different attentional strategies (EF and IF) has an influence on the excitability of slow(er) motor pathways. Together with the increased intracortical inhibition and surround inhibition known from previous studies, the diminished activation in the slow(er) motor pathways further explains why using an EF is a more economic strategy.
© 2021. The Author(s).
Conflict of interest statement
The authors declare no competing interests.
Figures

Similar articles
-
Changes in the Brain with an External Focus of Attention: Neural Correlates.Exerc Sport Sci Rev. 2025 Apr 1;53(2):49-59. doi: 10.1249/JES.0000000000000354. Epub 2024 Dec 18. Exerc Sport Sci Rev. 2025. PMID: 39690510 Free PMC article. Review.
-
Task-dependent activation of distinct fast and slow(er) motor pathways during motor imagery.Brain Stimul. 2018 Jul-Aug;11(4):782-788. doi: 10.1016/j.brs.2018.02.010. Epub 2018 Feb 22. Brain Stimul. 2018. PMID: 29510958
-
Surround inhibition can instantly be modulated by changing the attentional focus.Sci Rep. 2018 Jan 18;8(1):1085. doi: 10.1038/s41598-017-19077-0. Sci Rep. 2018. PMID: 29348536 Free PMC article.
-
Individual optimal attentional strategy during implicit motor learning boosts frontoparietal neural processing efficiency: A functional near-infrared spectroscopy study.Brain Behav. 2019 Jan;9(1):e01183. doi: 10.1002/brb3.1183. Epub 2018 Dec 5. Brain Behav. 2019. PMID: 30520270 Free PMC article.
-
Excitability changes in human corticospinal projections to muscles moving hand and fingers while viewing a reaching and grasping action.Eur J Neurosci. 2005 Sep;22(6):1513-20. doi: 10.1111/j.1460-9568.2005.04336.x. Eur J Neurosci. 2005. PMID: 16190904 Clinical Trial.
Cited by
-
A crossover study on attentional focus and gross motor performance in individuals with Down syndrome.PLoS One. 2024 Aug 22;19(8):e0305267. doi: 10.1371/journal.pone.0305267. eCollection 2024. PLoS One. 2024. PMID: 39172942 Free PMC article.
-
Changes in the Brain with an External Focus of Attention: Neural Correlates.Exerc Sport Sci Rev. 2025 Apr 1;53(2):49-59. doi: 10.1249/JES.0000000000000354. Epub 2024 Dec 18. Exerc Sport Sci Rev. 2025. PMID: 39690510 Free PMC article. Review.
-
The location of an internal focus of attention differentially affects motor performance.PLoS One. 2023 Nov 13;18(11):e0294246. doi: 10.1371/journal.pone.0294246. eCollection 2023. PLoS One. 2023. PMID: 37956130 Free PMC article.
-
External and internal focus of attention differentially modulate corticospinal excitability in anticipatory postural adjustments.Sci Rep. 2022 Dec 26;12(1):22385. doi: 10.1038/s41598-022-26987-1. Sci Rep. 2022. PMID: 36572719 Free PMC article.
-
An external focus promotes motor learning of an aiming task in individuals with hearing impairments.Eur J Sport Sci. 2024 Aug;24(8):1143-1151. doi: 10.1002/ejsc.12157. Epub 2024 Jun 28. Eur J Sport Sci. 2024. PMID: 38940066 Free PMC article. Clinical Trial.
References
-
- Schücker L, et al. On the optimal focus of attention for efficient running at high intensity. Sport Exerc. Perform. Psychol. 2013;2(3):207–219. doi: 10.1037/a0031959. - DOI
MeSH terms
LinkOut - more resources
Full Text Sources
Miscellaneous
