. 2021 Sep 9;11(1):17912.
doi: 10.1038/s41598-021-97105-w.

Characterisation of lamina I anterolateral system neurons that express Cre in a Phox2a-Cre mouse line

Affiliations

Characterisation of lamina I anterolateral system neurons that express Cre in a Phox2a-Cre mouse line

Wafa A A Alsulaiman et al. Sci Rep. .

Abstract

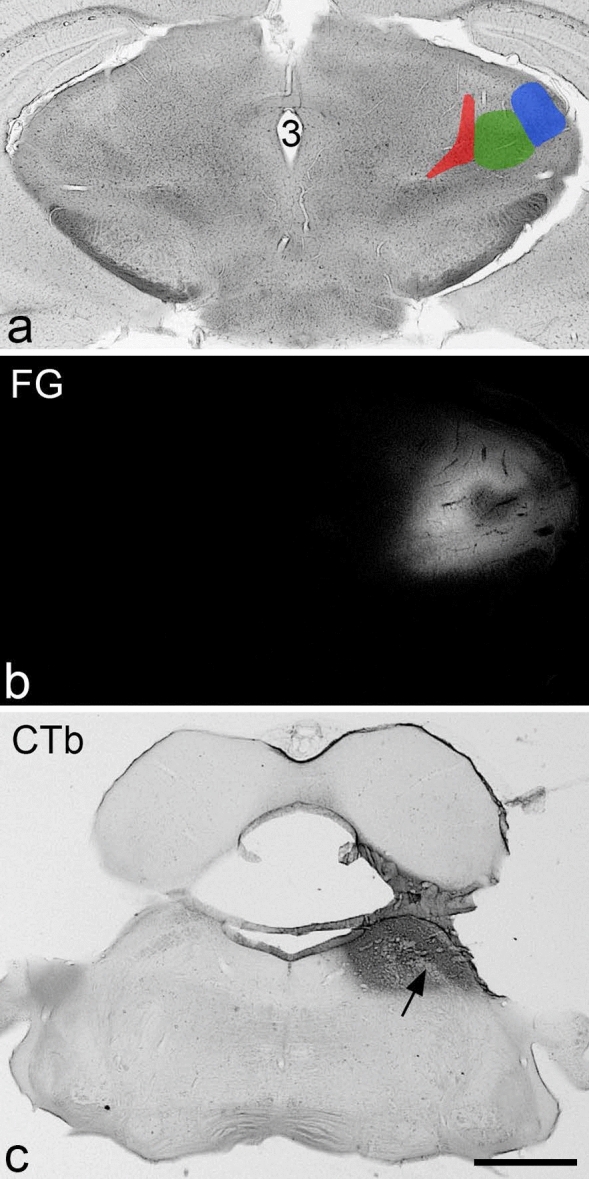
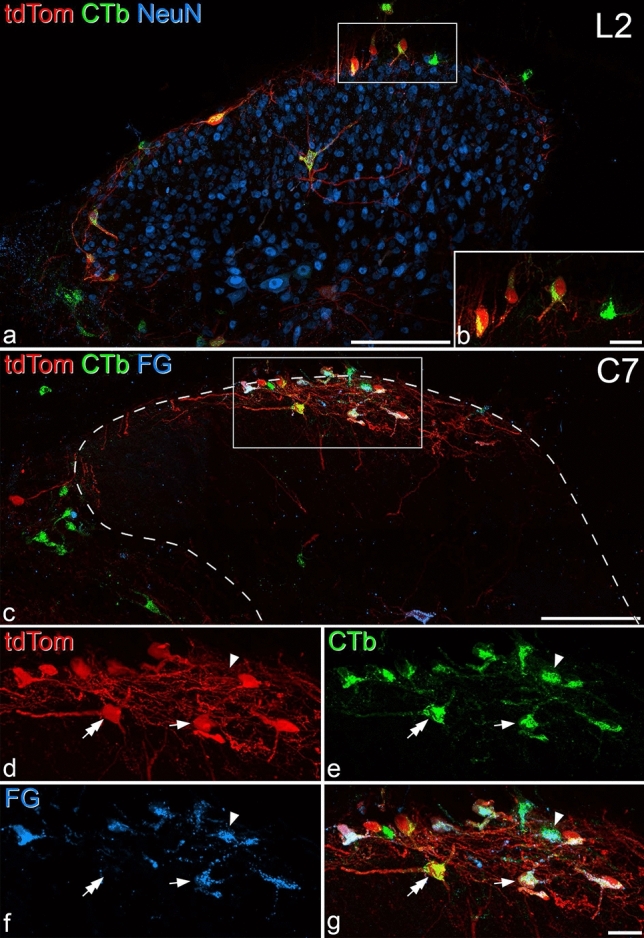
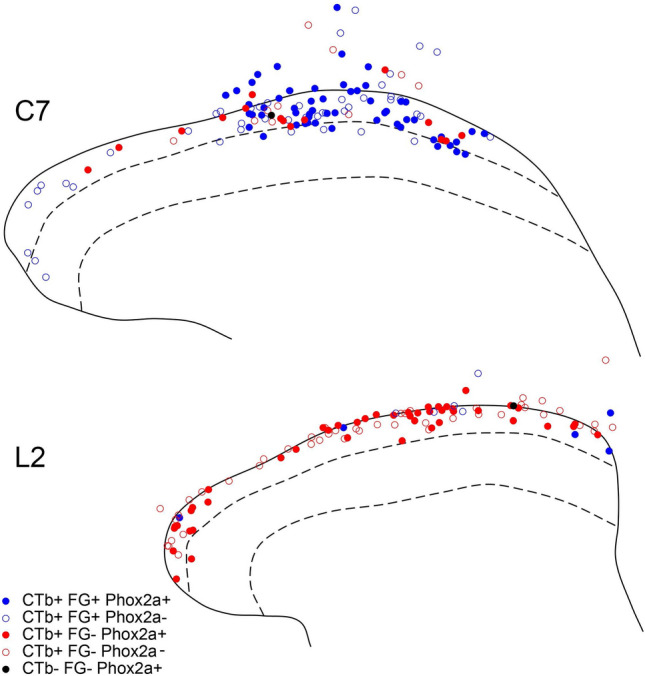
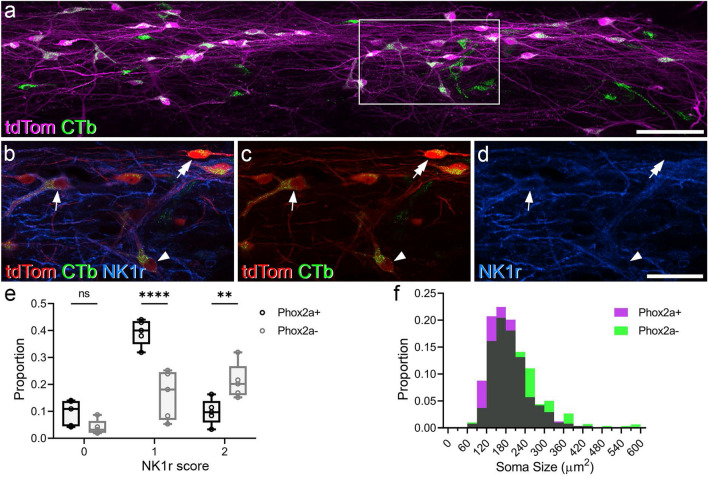
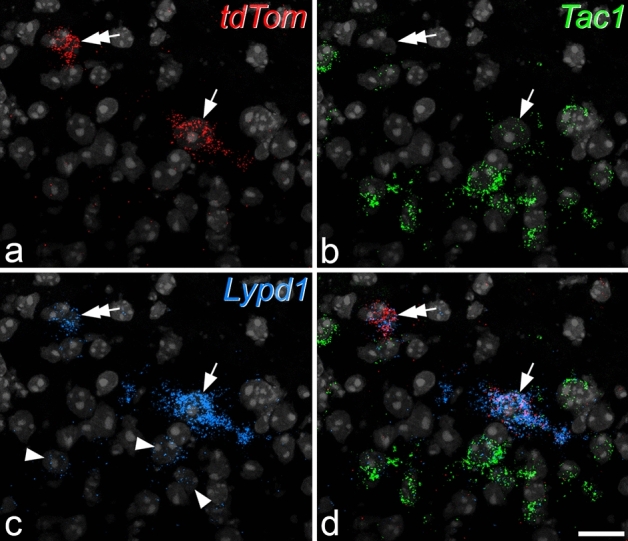
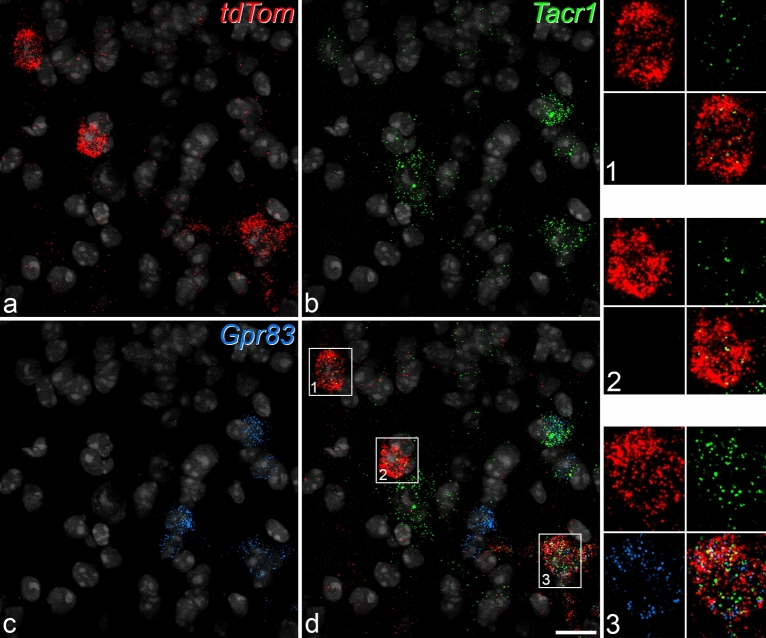
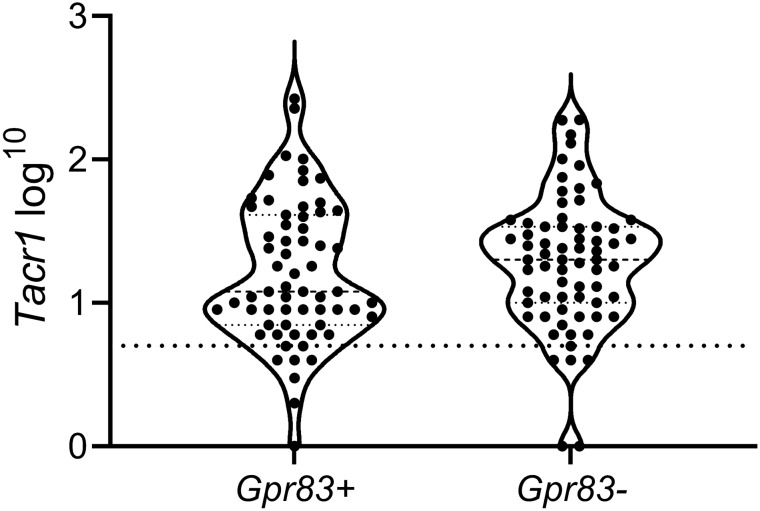
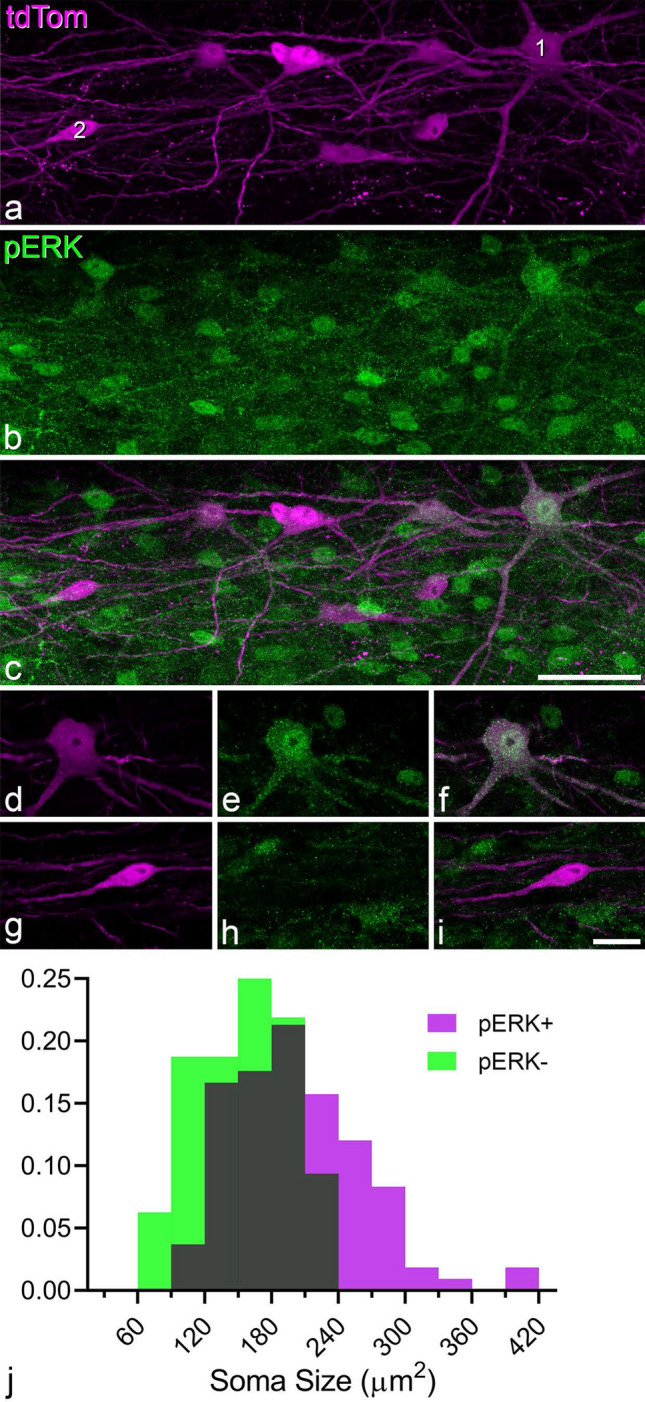
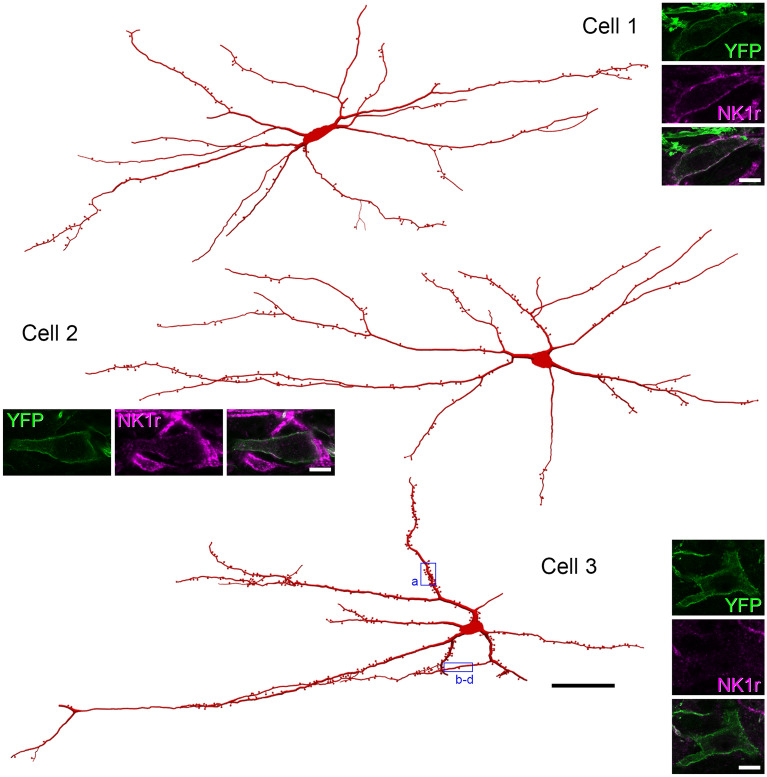
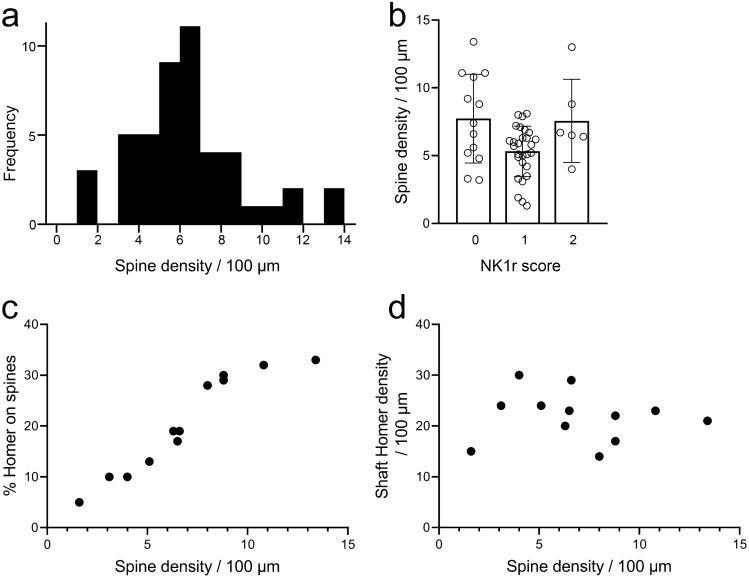
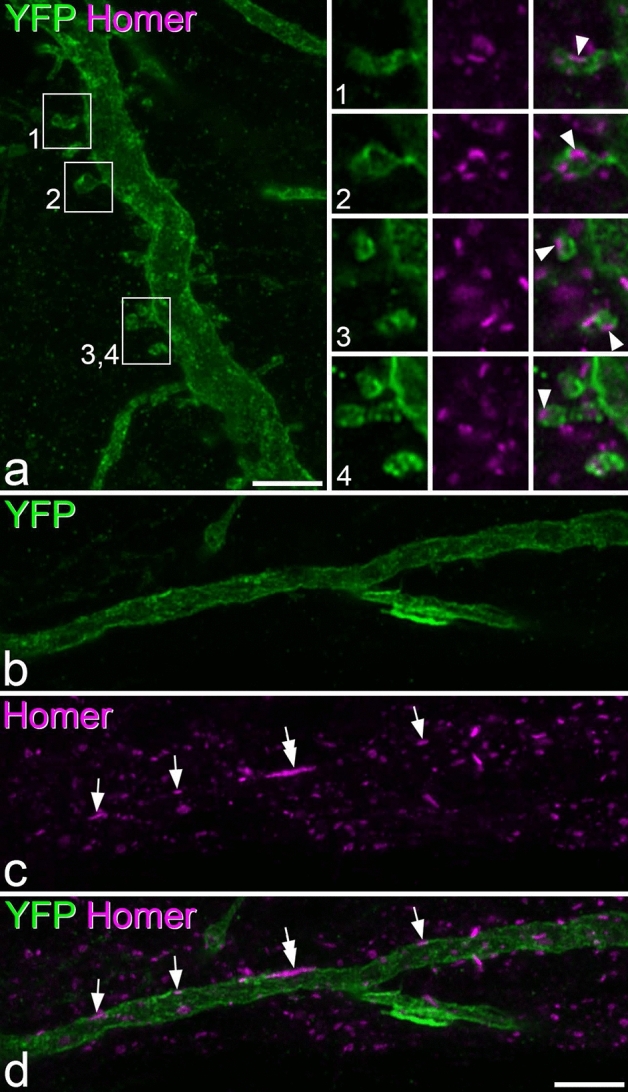
A recently developed Phox2a::Cre mouse line has been shown to capture anterolateral system (ALS) projection neurons. Here, we used this line to test whether Phox2a-positive cells represent a distinct subpopulation among lamina I ALS neurons. We show that virtually all lamina I Phox2a cells can be retrogradely labelled from injections targeted on the lateral parabrachial area (LPb), and that most of those in the cervical cord also belong to the spinothalamic tract. Phox2a cells accounted for ~ 50-60% of the lamina I cells retrogradely labelled from LPb or thalamus. Phox2a was preferentially associated with smaller ALS neurons, and with those showing relatively weak neurokinin 1 receptor expression. The Phox2a cells were also less likely to project to the ipsilateral LPb. Although most Phox2a cells phosphorylated extracellular signal-regulated kinases following noxious heat stimulation, ~ 20% did not, and these were significantly smaller than the activated cells. This suggests that those ALS neurons that respond selectively to skin cooling, which have small cell bodies, may be included among the Phox2a population. Previous studies have defined neurochemical populations among the ALS cells, based on expression of Tac1 or Gpr83. However, we found that the proportions of Phox2a cells that expressed these genes were similar to the proportions reported for all lamina I ALS neurons, suggesting that Phox2a is not differentially expressed among cells belonging to these populations. Finally, we used a mouse line that resulted in membrane labelling of the Phox2a cells and showed that they all possess dendritic spines, although at a relatively low density. However, the distribution of the postsynaptic protein Homer revealed that dendritic spines accounted for a minority of the excitatory synapses on these cells. Our results confirm that Phox2a-positive cells in lamina I are ALS neurons, but show that the Phox2a::Cre line preferentially captures specific types of ALS cells.


Conflict of interest statement

The authors declare no competing interests.

Figures

Figure 1
Figure 1
Representative injection sites in the thalamus and brainstem from one of the experiments (#6). (a,b) Brightfield and fluorescence and images of a section through the diencephalon reveal the extent of the Fluorogold (FG) injection. Areas shown in red, green and blue correspond to the posterior triangular nucleus of the thalamus, and the medial and lateral geniculate nuclei, respectively. The 3rd ventricle is also indicated (3). (c) A section through the pons that has been reacted by an immunoperoxidase method to reveal cholera toxin B subunit (CTb). The arrow indicates the position of the superior cerebellar peduncle. Scale bar (a–c) = 1 mm.
Figure 2
Figure 2
The relationship between retrograde labelled and Phox2a-positive cells. (a) Transverse section through the L2 segment of experiment #4, showing the side contralateral to the cholera toxin B subunit (CTb) injection into the lateral parabrachial area. The section has been immunostained to reveal tdTomato (tdTom, red), CTb (green) and NeuN (blue). Several retrogradely labelled neurons are visible, and most of these are in lamina I. Several of these are also tdTom-positive, and therefore appear yellow. The box shows the region corresponding to (b). (b) Part of lamina I from the same section showing 4 retrogradely-labelled lamina I cells, which contain CTb in the cytoplasm. The one on the right side is negative for tdTom, while the other three are tdTom-positive. (c) Transverse section through the C7 segment of experiment #6, showing the side contralateral to the CTb and Fluorogold (FG) injections. The section has been stained to reveal tdTom (red), CTb (green) and FG (blue). There is a cluster of retrogradely labelled cells, many of which are tdTom-positive in the central part of lamina I. The dashed line shows the outline of the grey matter, and the box indicates the region shown at higher magnification in (dg). (dg) Separating the individual colours reveals several patterns of co-localisation, including CTb-positive cells that also contain FG and tdTom (example shown with arrow). There are also tdTom-negative cells that are labelled with both CTb and FG (example shown with arrowhead) and CTb-labelled tdTom-positive cells that lack FG (example shown with double arrow). All images are from maximum intensity projections of confocal image scans (1 μm z-separation) through the full thickness of the 60 μm sections. In both (a,c), medial is to the right. Scale bars: (a,c) = 100 μm; (b,df) = 20 μm.
Figure 3
Figure 3
Plots showing the distribution of retrogradely-labelled and tdTomato-positive cells in the C7 and L2 segments from experiment #6, in which injections of cholera toxin B subunit (CTb) and Fluorogold (FG) were targeted on the lateral parabrachial area and thalamus, respectively. tdTomato-positive and -negative cells are shown with solid and open symbols, respectively. Those that were retrogradely labelled with CTb and FG are shown in blue, and those labelled only with CTb in red. Only one tdTom cell (in the L2 segment) was not retrogradely labelled, and this is shown in black. Dashed lines represent the dorsal and ventral borders of lamina II. Outline drawings were prepared with XaraXtreme v2 (http://www.xaraxtreme.org/).
Figure 4
Figure 4
Retrogradely labelled and tdTomato-positive lamina I neurons in horizontal sections from the L3 segment. (a) Part of lamina I from experiment #1, in which cholera toxin B subunit (CTb) was injected bilaterally into the lateral parabrachial area. TdTom and CTb are revealed in magenta and green, respectively. Many double-labelled cells are visible, as well as some that are CTb-positive but lack tdTomato. The box shows the area corresponding to (bd). (bd) Show this region at higher magnification, with NK1r-immunoreactivity in blue, tdTom in red and CTb in green. Several retrogradely labelled tdTom-positive cells are visible in this field. The three marked cells are either strongly NK1r-immunoreactive (arrow), weakly NK1r-immunoreactive (arrowhead) or NK1r-negative (double arrow). The image in (a) is projected from a confocal scan through the thickness of the section, while those in (bd) are projected from 2 optical sections (1 μm z-separation in each case). Scale bars: (a) = 100 μm, (bd) = 50 μm. (e) Box and whisker plots showing the proportions of Phox2a-positive and -negative cells that were classed as negative (0), weakly-stained (1) or strongly stained (2) for NK1r in experiments #1–4 and #6. Significance is shown with asterisks (**p < 0.01; ****p < 0.0001). (f) Frequency histogram showing the soma sizes of retrogradely labelled neuron analysed in experiments #1–#6. Phox2a-positive and negative cells are represented in magenta and green, respectively, and areas of overlap are shown in grey.
Figure 5
Figure 5
Fluorescence in situ hybridisation with RNAscope in a transverse section from a Phox2a::Cre;Rosa26LSL-tdTomato mouse. The section has been reacted with probes directed against tdTom (red), Tac1 (green) and Lypd1 (blue) mRNAs. These are shown separately in (ac), and combined in (d). The nuclear counterstain NucBlue is shown in grey. Two tdTom-positive cells are present in this field. One of these (arrow) is positive for Tac1, while the other (double arrow) is not. Several smaller Tac1-positive cells are present, and these are likely to be interneurons. Both of the tdTom-positive cells are also positive for Lypd1. However, many other smaller cells show weak Lypd1, and some of these are indicated with arrowheads. Images are projections of confocal optical sections (1 μm z-separation) through the full thickness of the section. Scale = 20 μm.
Figure 6
Figure 6
Fluorescence in situ hybridisation with RNAscope in a horizontal section from a Phox2a::Cre;Rosa26LSL-tdTomato mouse. The section was reacted with probes for tdTom (red), Tacr1 (green) and Gpr83 (blue) mRNAs, and these are shown separately in (ac) and combined in (d). The nuclear counterstain NucBlue is shown in grey. Three tdTom-positive cells are present (numbered 1–3 in (d)). These are illustrated at higher magnification in the insets, and in each of these the top row shows labelling for tdTom and Tacr1 and the bottom row labelling for Gpr83 together with a merged image. All 3 cells are positive for Tacr1 (based on the presence of more than 5 transcripts), while cell 3 is positive for Gpr83. Note that there are sparse scattered transcripts for tdTom, which are also seen in Rosa26LSL-tdTomato mice, and presumably result from a low-level “leak” of tdTomato expression. However, these can easily be distinguished from the labelling in the putative Phox2a-positive lamina I neurons. Images are projections of confocal optical sections (1 μm z-separation) through the full thickness of the section. Scale = 20 μm.
Figure 7
Figure 7
Violin plot of Tacr1 transcript number in Gpr83-positive and Gpr83-negative Phox2a neurons. The dotted line represents 5 transcripts per cell (i.e. the threshold for defining positivity). Lines within the violins represent the median and inter-quartile range.
Figure 8
Figure 8
Phosphorylation of extracellular signal-regulated kinases (ERK) in response to noxious heat stimulation. (a,b) part of a horizontal section through the ipsilateral dorsal horn from a Phox2a::Cre;Rosa26LSL-tdTomato mouse that had received a noxious heat stimulus to one hind paw. The tissue was scanned to reveal tdTomato (tdTom, magenta) and phosphorylated ERK (pERK, green), respectively and the images are projections of 10 optical sections at 2 μm z-spacing. Two cells are numbered in (a). (c) A merged image shows that the Phox2a neurons are in a region that contains numerous pERK-positive cells. (di) single optical sections through the two Phox2a cells numbered 1 and 2 in (c). Cell 1 is pERK-positive and cell 2 is pERK-negative. Scale bars: (ac) = 50 μm, (di) = 20 μm. (j) A frequency histogram showing the sizes of the Phox2a-positive cells that were pERK+ and pERK−, expressed as a proportion of each population.
Figure 9
Figure 9
Neurolucida reconstructions of Phox2a cells from horizontal sections of Phox2a::Cre;Rosa26LSL-ChR2-EYFP mice. The drawings show the cell bodies and dendritic trees of 3 YFP-positive cells. Note that although the locations of all dendritic spines are shown, these are represented in a standardised way that does not indicate spine shape. Insets show confocal scans through the cell body of each neuron. YFP is shown in green and NK1r-immunoreactivity in magenta. Cell 1 was classed as strongly NK1r-immunoreactive, Cell 2 as weakly NK1r-immunoreactive and Cell 3 as NK1r-negative. Boxes over Cell 3 show regions illustrated in Fig. 11. Scale bars: main figure = 100 μm; insets = 10 μm. Neurons were reconstructed with Neurolucida v2020.1.3 (https://www.mbfbioscience.com/).
Figure 10
Figure 10
Quantitative analysis of dendritic spines and Homer puncta. (a) Frequency histogram showing the range densities on the 47 neurons analysed from the 3 Phox2a::Cre;Rosa26LSL ChR2-EYFP mice. (b) Spine densities for cells classified as strongly NK1r-immunoreactive (2), weakly immunoreactive (1) or non-immunoreactive (0). There was no significant difference between the three classes. Mean and SD are indicated. (c) There was a strong correlation between the dendritic spine density and the proportion of Homer puncta that were located on spines for the 12 cells in which Homer was analysed. (d) There was no correlation between spine density and the density of Homer puncta that were located on dendritic shafts for these cells.
Figure 11
Figure 11
Homer puncta on the dendritic shafts and spines of YFP-positive lamina I cells in Phox2a::Cre;Rosa26LSL- ChR2-EYFP mice. (a) A region of dendrite from Cell 3 (shown in Fig. 9) that has numerous dendritic spines. The insets show higher magnification views of these spines. The tissue has been reacted to reveal YFP (green) and Homer (magenta). Homer puncta can be seen in each of the dendritic spines (arrowheads) in the insets. (bd) Part of a dendritic shaft from the same cell. This region has few dendritic spines, but there are several Homer puncta in the membrane (arrows). One of these (double arrow) is particularly large (approximately 3 μm long). Confocal images are projections of 11 optical sections (main part of (a) and 4 optical sections (bd) all at 0.3 μm z-separation. Insets in (a) are all single optical sections. Scale bars: (a,bd) = 5 μm.

References

    1. Braz J, Solorzano C, Wang X, Basbaum AI. Transmitting pain and itch messages: A contemporary view of the spinal cord circuits that generate gate control. Neuron. 2014;82:522–536. doi: 10.1016/j.neuron.2014.01.018. - DOI - PMC - PubMed
    1. Todd AJ. Neuronal circuitry for pain processing in the dorsal horn. Nat. Rev. Neurosci. 2010;11:823–836. doi: 10.1038/nrn2947. - DOI - PMC - PubMed
    1. Lahuerta J, Bowsher D, Campbell J, Lipton S. Clinical and instrumental evaluation of sensory function before and after percutaneous anterolateral cordotomy at cervical level in man. Pain. 1990;42:23–30. doi: 10.1016/0304-3959(90)91087-Y. - DOI - PubMed
    1. Marshall AG, Sharma ML, Marley K, Olausson H, McGlone FP. Spinal signalling of C-fiber mediated pleasant touch in humans. Elife. 2019 doi: 10.7554/eLife.51642. - DOI - PMC - PubMed
    1. Wercberger R, Basbaum AI. Spinal cord projection neurons: A superficial, and also deep, analysis. Curr. Opin. Physiol. 2019;11:109–115. doi: 10.1016/j.cophys.2019.10.002. - DOI - PMC - PubMed

Publication types

LinkOut - more resources