. 2021 Sep;39(9):1151-1160.
doi: 10.1038/s41587-021-00993-6. Epub 2021 Sep 9.

Establishing community reference samples, data and call sets for benchmarking cancer mutation detection using whole-genome sequencing

Li Tai Fang #  1 Bin Zhu #  2 Yongmei Zhao #  3 Wanqiu Chen  4 Zhaowei Yang  4   5 Liz Kerrigan  6 Kurt Langenbach  6 Maryellen de Mars  6 Charles Lu  7 Kenneth Idler  7 Howard Jacob  7 Yuanting Zheng  8 Luyao Ren  8 Ying Yu  8 Erich Jaeger  9 Gary P Schroth  9 Ogan D Abaan  9 Keyur Talsania  3 Justin Lack  3 Tsai-Wei Shen  3 Zhong Chen  4 Seta Stanbouly  4 Bao Tran  10 Jyoti Shetty  10 Yuliya Kriga  10 Daoud Meerzaman  11 Cu Nguyen  11 Virginie Petitjean  12 Marc Sultan  12 Margaret Cam  13 Monika Mehta  10 Tiffany Hung  14 Eric Peters  14 Rasika Kalamegham  14 Sayed Mohammad Ebrahim Sahraeian  1 Marghoob Mohiyuddin  1 Yunfei Guo  1 Lijing Yao  1 Lei Song  2 Hugo Y K Lam  1 Jiri Drabek  15   16 Petr Vojta  15   16 Roberta Maestro  16   17 Daniela Gasparotto  16   17 Sulev Kõks  16   18   19 Ene Reimann  16   19 Andreas Scherer  16   20 Jessica Nordlund  16   21 Ulrika Liljedahl  16   21 Roderick V Jensen  22 Mehdi Pirooznia  23 Zhipan Li  24 Chunlin Xiao  25 Stephen T Sherry  25 Rebecca Kusko  26 Malcolm Moos  27 Eric Donaldson  28 Zivana Tezak  29 Baitang Ning  30 Weida Tong  30 Jing Li  5 Penelope Duerken-Hughes  31 Claudia Catalanotti  32 Shamoni Maheshwari  32 Joe Shuga  32 Winnie S Liang  33 Jonathan Keats  33 Jonathan Adkins  33 Erica Tassone  33 Victoria Zismann  33 Timothy McDaniel  33 Jeffrey Trent  33 Jonathan Foox  34 Daniel Butler  34 Christopher E Mason  34 Huixiao Hong  35 Leming Shi  36 Charles Wang  37   38 Wenming Xiao  39 Somatic Mutation Working Group of Sequencing Quality Control Phase II Consortium
Collaborators, Affiliations

Establishing community reference samples, data and call sets for benchmarking cancer mutation detection using whole-genome sequencing

Li Tai Fang et al. Nat Biotechnol. 2021 Sep.

Abstract

The lack of samples for generating standardized DNA datasets for setting up a sequencing pipeline or benchmarking the performance of different algorithms limits the implementation and uptake of cancer genomics. Here, we describe reference call sets obtained from paired tumor-normal genomic DNA (gDNA) samples derived from a breast cancer cell line-which is highly heterogeneous, with an aneuploid genome, and enriched in somatic alterations-and a matched lymphoblastoid cell line. We partially validated both somatic mutations and germline variants in these call sets via whole-exome sequencing (WES) with different sequencing platforms and targeted sequencing with >2,000-fold coverage, spanning 82% of genomic regions with high confidence. Although the gDNA reference samples are not representative of primary cancer cells from a clinical sample, when setting up a sequencing pipeline, they not only minimize potential biases from technologies, assays and informatics but also provide a unique resource for benchmarking 'tumor-only' or 'matched tumor-normal' analyses.


Conflict of interest statement

Competing interests

L.T.F., S.M.E.S., M. Mohiyuddin, Y.G., L.Y. and H.L. are employees of Roche Sequencing Solutions Inc. L.K., K.L. and M. Mars are employees of ATCC, which provides cell lines and derivative materials. E.J., G.P.S. and O.D.A. are employees of Illumina Inc. V.P. and M.S. are employees of Novartis Institutes for Biomedical Research. T.H., E.P. and R. Kalamegham are employees of Genentech (a member of the Roche group). Z.L. is an employee of Sentieon Inc. R. Kusko is an employee of Immuneering Corp. C.C., S.M. and J.S. are employees of 10x Genomics. All other authors declare no competing interests.

Figures

Extended Data Fig. 1 |
Extended Data Fig. 1 |. 3D scatter plot shows the consistency of SomaticSeq and NeuSomatic classification of somatic variant calls.
3D scatter plot for number of PASS classifications by SomaticSeq, NeuSomatic-E, and VAF for (a) SNV (R = 0.997) and (b) indel calls (R = 0.925). (c) The subset of SNV calls that were re-sequenced by AmpliSeq. Solid markers are deemed ‘validated.’ Open markers are deemed ‘not validated.’ Stars/crosses are deemed uninterpretable. HighConf calls generally have many PASS calls and a full range of VAF. MedConf have fewer PASS calls and tend to have lower VAF. Unclassified calls have a full range of VAF, which means their somatic signals were poor-quality.
Extended Data Fig. 2 |
Extended Data Fig. 2 |. Genome coverage and high-confidence regions.
(a) Genome coverage by reads from three technologies. Inner track: PacBio. Middle track: 10X Genomics. Outer track: Illumina HiSeq. (b) Genome regions coverage by short reads in comparison to NA12878. Outer black Track: Gene density plot. Middle orange track: NA12878. Inner blue track: the callable regions in HCC1395.
Extended Data Fig. 3 |
Extended Data Fig. 3 |. Validation of somatic indels.
(a) Validation of indels by AmpliSeq. R = 0.989 for HighConf calls. (b) Validation of indels by WES with Ion Torrent. R = 0.767 for HighConf calls. (c) Validation of indels by WES with HiSeq. R = 0.990 for HighConf calls. (d) Histogram of indel sizes. The dashed lines on the diagonal for (a), (b), and (c) are the 95% binomial confidence-interval of observed VAF given the actual VAF, calculated based on depths of 2000X for AmpliSeq, 34X for Ion Torrent, and 100X for WES, respectively. (d) shows the indel lengths of the somatic indels in the reference call set.
Extended Data Fig. 4 |
Extended Data Fig. 4 |. Validation of germline indels.
Germline indel scatter plots comparing VAF super set to confirmed VAF. (a) VAF scatter plot of germline indels by WGS super set and AmpliSeq. (b) VAF scatter plot of germline indels by truth set and Ion Torrent WES.
Extended Data Fig. 5 |
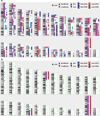
Extended Data Fig. 5 |. Karyotyping of HCC1395 and HCC1395BL.
(a) Karyotype of HCC1395. Cytogenetic analysis was performed on ten G-Banded metaphase cells from HCC1395. Analysis pointed to a hypertetraploid line with chromosome counts ranging from 64–79 and gain of 38–63 unidentifiable marker chromosomes. (b) Karyotype of HCC1395BL. Cytogenetic analysis was performed on ten G-banded metaphase cells from HCC1395BL. All ten cells showed loss of a chrX and an unbalanced whole arm translocation between the long-arm of chr6 at band q10 and the short-arm of chr16 at band p10. This resulted in a net loss of one copy of the short-arm of chr6 and loss of one copy of the long-arm of chr16. The abnormal chromosome could be placed in either a chr6 or chr16 locus as we were unable to determine if the centromere belongs to chr6 or chr16 (inset figure).
Extended Data Fig. 6 |
Extended Data Fig. 6 |. Cytogenetic analysis with Affymetrix Cytoscan HD microarray.
Cytogenetic analysis with Affymetrix Cytoscan HD microarray. (a) Cytogenetic view of HCC1395. (b) Cytogenetic view of HCC1395BL. The losses of chr6p, chr16q, and chrX were confirmed.
Extended Data Fig. 7 |
Extended Data Fig. 7 |. Variant allele frequencies across the genome.
(a) VAF of truth set germline SNVs in HCC1395BL. The copy numbers of HCC1395BL were predicted by Affymetrix Cytoscan HD microarray. (b) VAF of the truth set germline SNV positions (discovered in HCC1395BL) in HCC1395. (c) VAF of the truth set somatic SNVs in HCC1395. The copy numbers of HCC1395 were predicted by ascatNgs.
Extended Data Fig. 8 |
Extended Data Fig. 8 |. Variant allele frequencies of somatic mutations.
(a) VAFs of somatic SNVs and indels in the reference call sets. (b) VAFs of reference SNVs in different copy number states as predicted by ascatNgs.
Extended Data Fig. 9 |
Extended Data Fig. 9 |. Tumor sample HCC1395 CNV and Clonality Analysis.
Tumor sample HCC1395 CNV and Clonality Analysis. (a) Clonality analysis from WES data using SuperFreq for tumor cell line HCC1395. The clonality of each somatic SNV was calculated based on the VAF, accounting for local copy number. The SNVs and CNAs were evaluated with hierarchical clustering based on the clonality and uncertainty across replicates for HCC1395. The river plot shows the relative distribution of multiple subclones in HCC1395. The main cancer clone (blue) and the two subclones (red and green) appeared in early time of clonal evolution, while subclone (orange) and its descendant (peak) appeared in the late event of the clonal evolution. (b) The main- and sub-clonal somatic copy number profiles using subHMM38 from the Illumina WGS data set. Main-clonal genotype: upper panel; sub-clonal genotype: middle panel; sub-clonal proportion: bottom bar plot. Each colored block represents the genotype of somatic copy number alterations (SCNAs) in the corresponding position of the chromosome. The chromosomes are separated by vertical dash lines. Genotype of SCNAs: deletion (DEL), homozygous deletion (HOMD), hemizygous deletion loss of heterozygosity (DLOH), copy neutral loss of heterozygosity (NLOH), diploid heterozygous (HET), gain of one allele (GAIN), amplified loss of heterozygosity (ALOH), allele-specific copy number amplification (ASCNA), balanced copy number amplification (BCNA), and unbalanced copy number amplification (UBCNA).
Extended Data Fig. 10 |
Extended Data Fig. 10 |. Number of somatic mutations detected in HCC1395 and 560 triple negative and non-triple negative breast cancers from previous literature.
Number of somatic mutations detected in HCC1395 and 560 triple negative and non-triple negative breast cancers from previous literature.
Fig. 1 |
Fig. 1 |. Schematic of the bioinformatics pipelines used to define the confidence levels of the somatic mutation call set (see Methods for details).
Twenty-one sequencing replicates for the tumor (HCC1395) and normal (HCC1395BL) gDNA samples were performed at six sequencing centers. They were grouped into five groups shown as colored squares on the far left. The sequencing platforms used were HiSeq and NovaSeq, and the sequencing experiments were performed at Illumina (IL), Fudan University (FD), Novartis (NV), European Infrastructure for Translational Medicine (EA), National Cancer Institute (NC) and Loma Linda University (LL). Each of the 21 sequencing datasets was aligned with three aligners to create a total of 63 pairs of tumor–normal BAM files. For each of the 63 tumor–normal BAM files, we ran six somatic mutation callers (MuTect2, SomaticSniper, VarDict, MuSE, Strelka2 and TNscope) followed by SomaticSeq and NeuSomatic machine learning classifiers using models built specifically for these datasets. Initial tier was assigned to each variant call based on how consistently the variant was classified as a somatic mutation across different sequencing centers and aligners. Then, to rescue low-VAF variants into the reference call set, we ran the same variant-calling pipeline on two higher-depth datasets: an independent 350× replicate sequenced on a HiSeq at Genentech (GT) and a 400× replicate by combining nine NovaSeq replicates at Illumina (IL). High-confidence calls from those two datasets were used to promote less-reproducible low-VAF variants from the 21 sequencing replicates into the reference call set. Then, we combined all of our short-read sequencing data into a pair of 1,500× tumor–normal and used it to rescue additional low-VAF variants into the reference call set. Finally, we cross-referenced our Illumina short-read-based high-confidence calls with PacBio long-read sequencing data and removed a small number of calls that were inconsistent with each other. The high-confidence calls (labeled PASS) were considered ‘true’ somatic mutations, and genomic regions with low-confidence calls were removed from the high-confidence regions. Chr, chromosome; Pos, position.
Fig. 2 |
Fig. 2 |. Definition and validation of the somatic mutation reference call set.
a, Breakdown of the somatic variant calls within the consensus callable regions based on the four labels HighConf, MedConf, LowConf and Unclassified. Variant calls labeled HighConf and MedConf are grouped into the reference call set; genomic positions with LowConf and Unclassified calls are removed from the high-confidence regions. b, Histogram of VAFs of the somatic variant calls. c, Average tumor purity fitting scores with 95% confidence intervals for the VAF of each SNV across the four different confidence levels versus the observed VAF in the tumor–normal titration series. The formula for fitting scores is described in equation 1 (see Methods for details). d, Scatter plot of VAFs observed in 21 WGS datasets versus an AmpliSeq targeted sequencing dataset. Solid shapes represent variants that were validated. Open shapes represent variants that were not validated. Sticks represent uninterpretable validation data. The diagonal dashed lines represent the 95% binomial confidence interval of the observed VAF given the actual VAF calculated based on 2,000× depth for AmpliSeq. The figure shows a very high correlation between VAFs estimated from the WGS data and AmpliSeq data for HighConf calls (Pearson’s R = 0.982). Many Unclassified data points lie at the bottom, implying that these calls were not real mutations, despite the large number of apparent variant-supporting reads in the all-inclusive set data; x axis, VAFs calculated from the all-inclusive set; y axis, VAFs calculated from the AmpliSeq data. e, Scatter plot of VAFs observed in WGS datasets versus Ion Torrent WES. The 95% binomial confidence intervals were calculated based on 34× depth for Ion Torrent. Pearson’s R = 0.930 for HighConf calls. f, Scatter plot of VAFs observed in WGS datasets versus 12 repeats of WES on the HiSeq platform; y axis, median VAFs calculated based on 12 HiSeq WES replicates. The 95% binomial confidence intervals were calculated based on 150× depth for HiSeq WES. Pearson’s R = 0.997 for HighConf calls. In df, the colors indicate the confidence level of the variant calls, whereas the shapes indicate their validation status.
Fig. 3 |
Fig. 3 |. Initial definition and validation of germline variants.
a, Histogram of SCP for germline variants identified by four callers from 63 BAM files. b, VAF scatter plot of germline SNVs by the call set and AmpliSeq data. Pearson’s R = 0.986 for SCP = 1 call. c, VAF scatter plot of germline SNVs by the call set and Ion Torrent WES. Pearson’s R = 0.758 for SCP = 1 call. In b and c, colors indicate the calling probability of the germlines variants, whereas shapes indicate their validation status.
Fig. 4 |
Fig. 4 |. Clonality analysis of the HCC1395 cell line using bulk DNA and DNA from single cells.
a, The inferred tumor phylogenetic tree. The subclone S1 represents the most recent common ancestor (MRCA) of all tumor cells, and S2 to S10 represent the subclones with various cancer cell fractions (for example, S2: 60%). The edges represent the evolutionary relationships between subclones. Subclones S3 and S6 are not shown given that their cancer cell fractions were less than 10%. Most point mutations are in driver genes (labeled beside the edges) present in the MRCA. Using the 10x Genomics Single Cell CNV Solution, integer-scaled CNA profiles were obtained across the genomes of 638 HCC1395BL cells (b) and 1,270 HCC1395 cells (c). Noisy cells and cells in the S phase of the cell cycle were removed. The complete linkage method was used for hierarchical clustering. Each row represents a cell being sequenced; similar cells were clustered together based on CNVs. Chromosome-scale gains are in orange and losses are in blue in the heat maps.

References

    1. Gall JG Human genome sequencing. Science 233, 1367–1368 (1986). - PubMed
    1. Garraway LA & Lander ES Lessons from the cancer genome. Cell 153, 17–37 (2013). - PubMed
    1. Bailey MH et al. Comprehensive characterization of cancer driver genes and mutations. Cell 173, 371–385 (2018). - PMC - PubMed
    1. ICGC/TCGA Pan-Cancer Analysis of Whole Genomes Consortium. Pan-cancer analysis of whole genomes. Nature 578, 82–93 (2020). - PMC - PubMed
    1. Hyman DM, Taylor BS & Baselga J Implementing genome-driven oncology. Cell 168, 584–599 (2017). - PMC - PubMed

Publication types