

Development and Application of a United States wide correction for PM2.5 data collected with the PurpleAir sensor
- PMID: 34504625
- PMCID: PMC8422884
- DOI: 10.5194/amt-14-4617-2021
Development and Application of a United States wide correction for PM2.5 data collected with the PurpleAir sensor
Abstract
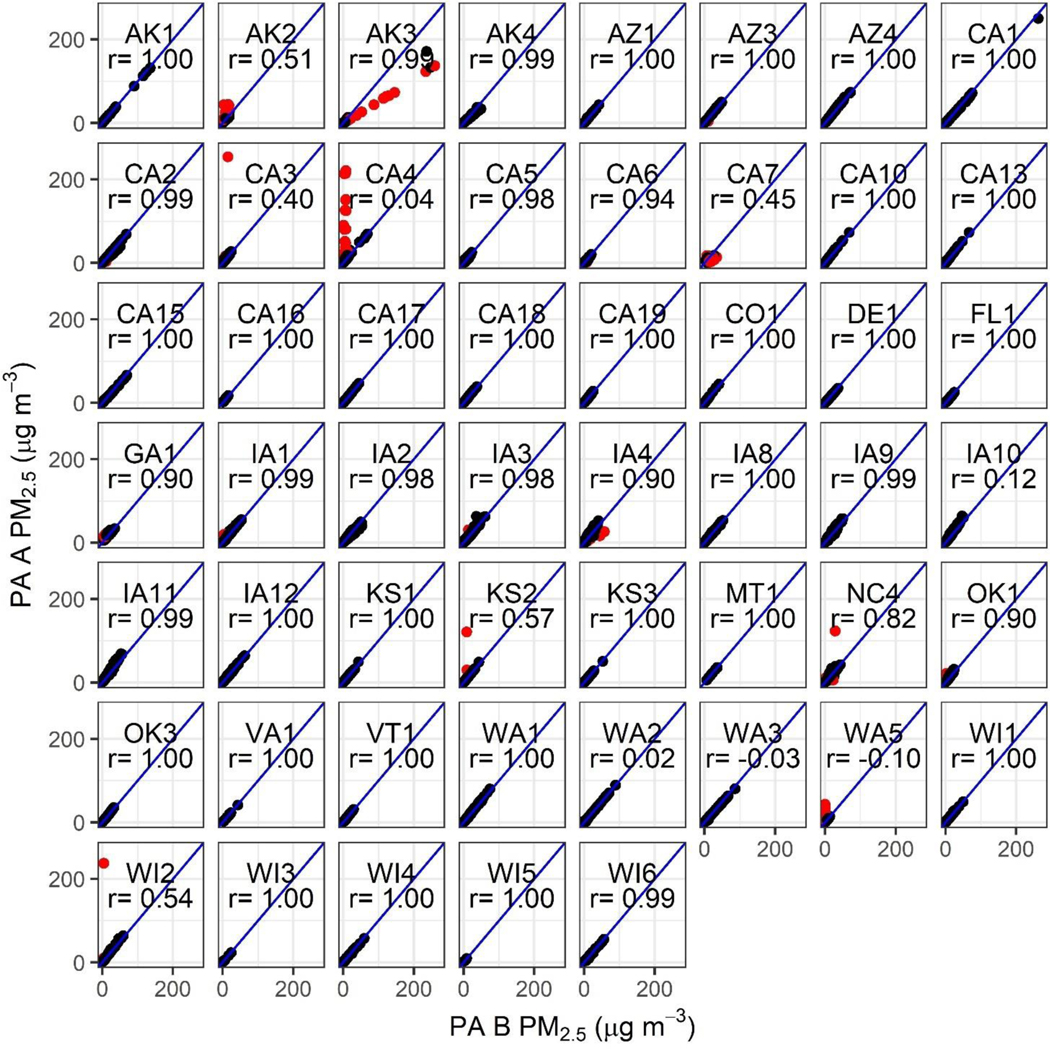
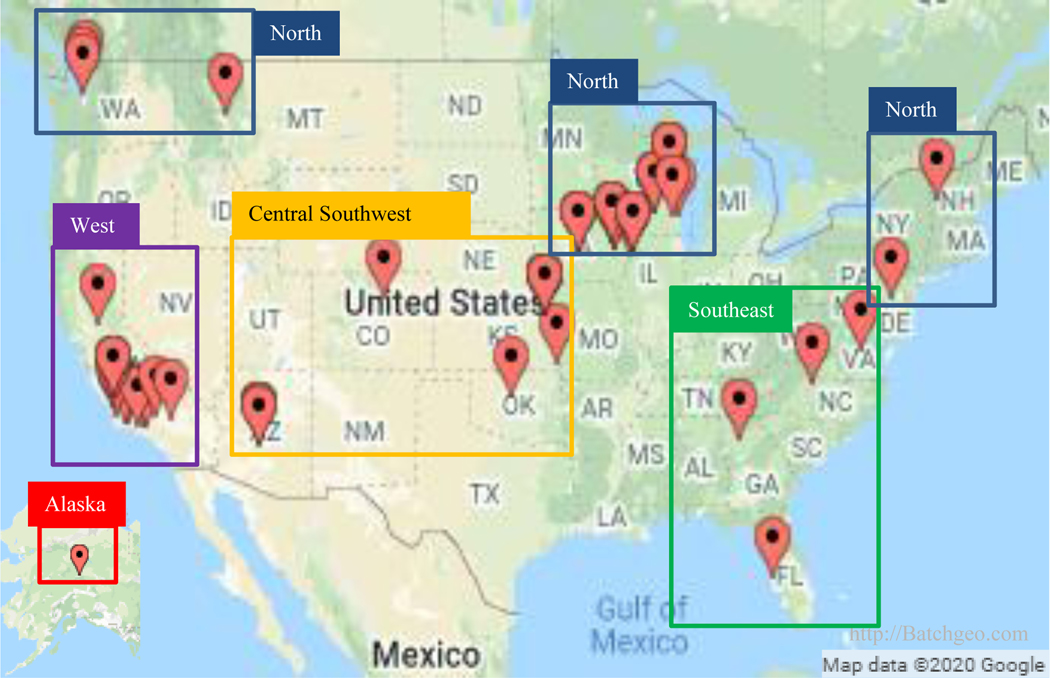
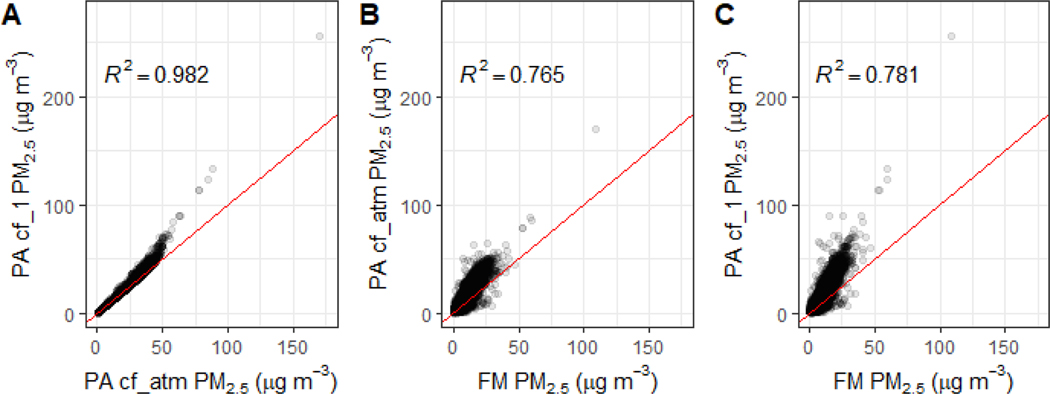
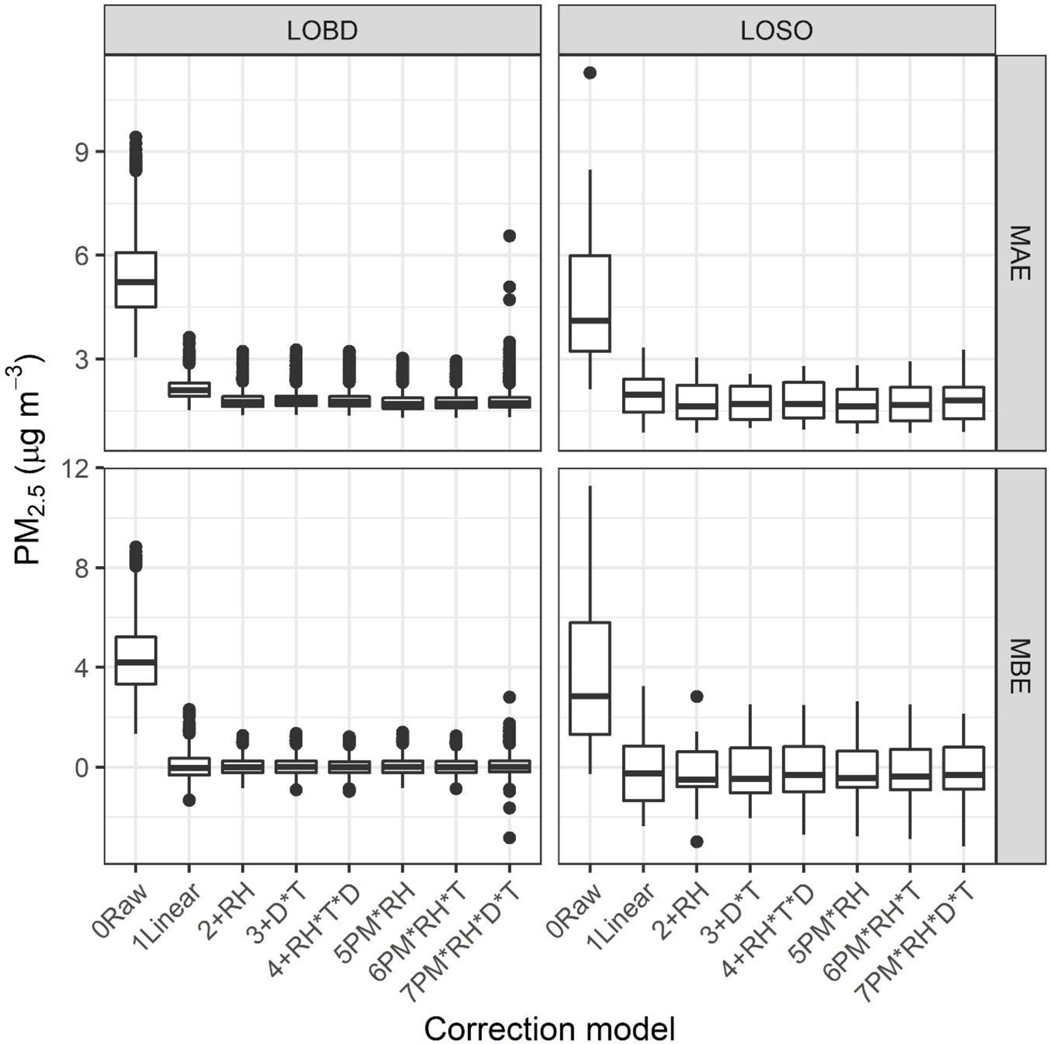
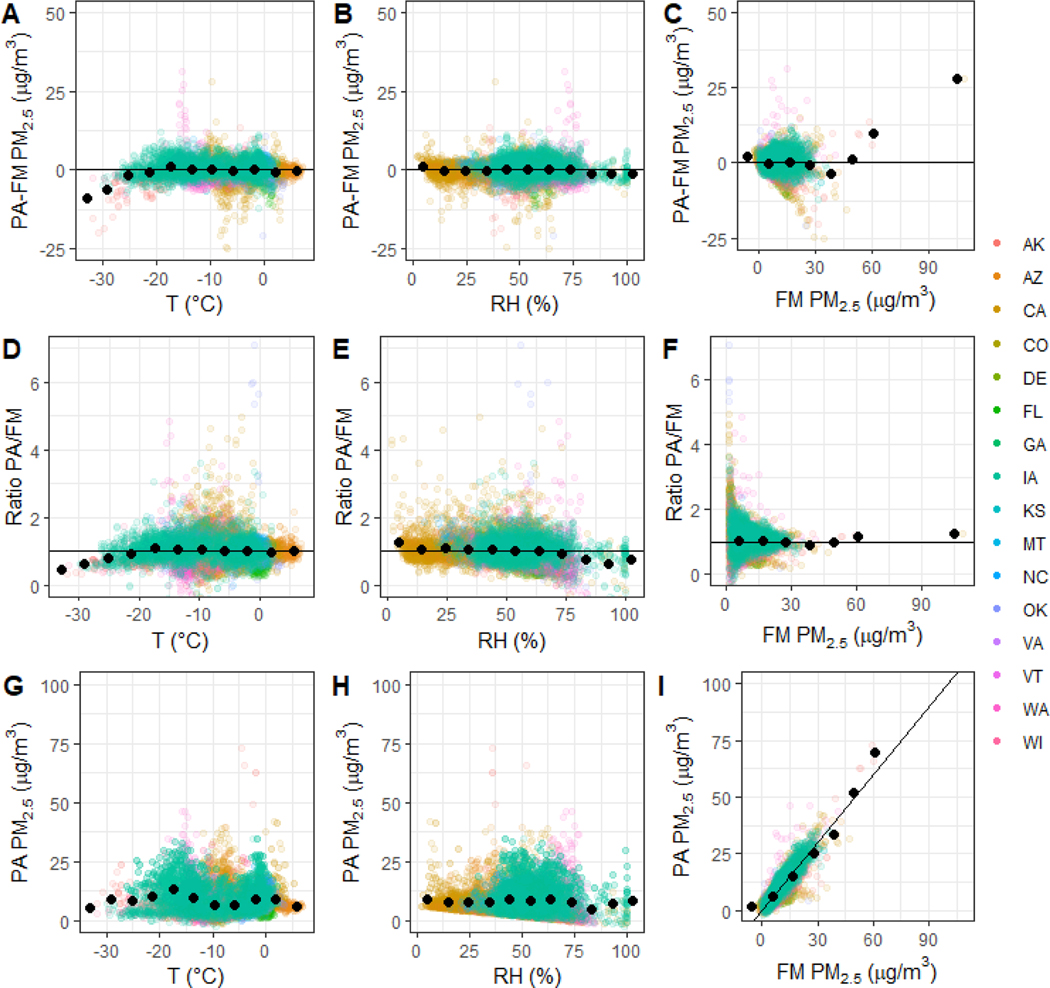
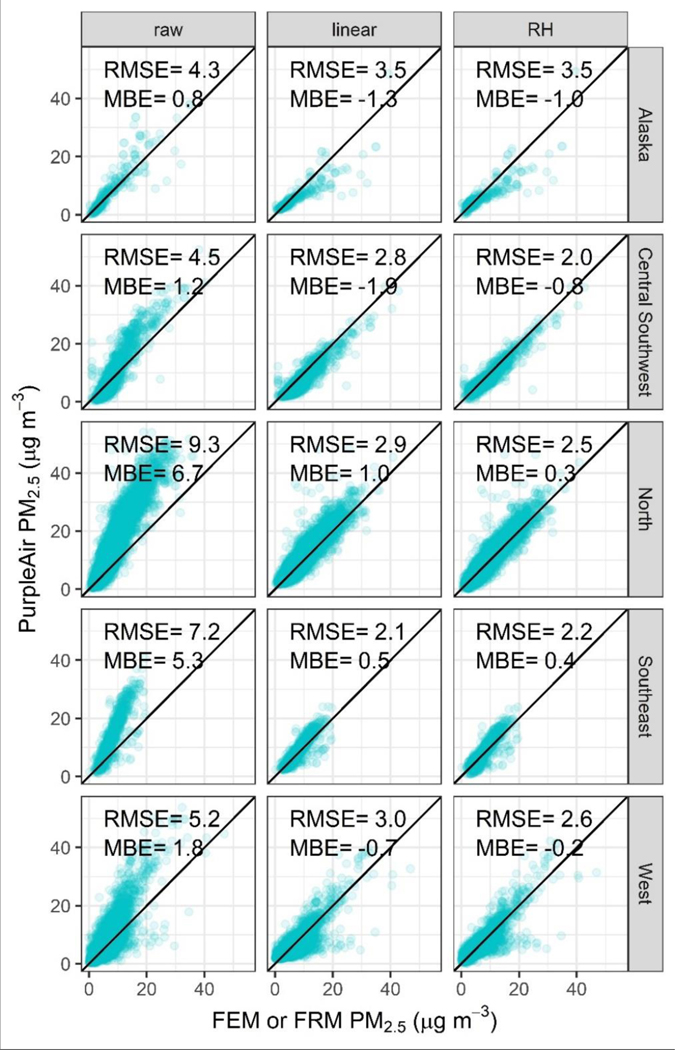
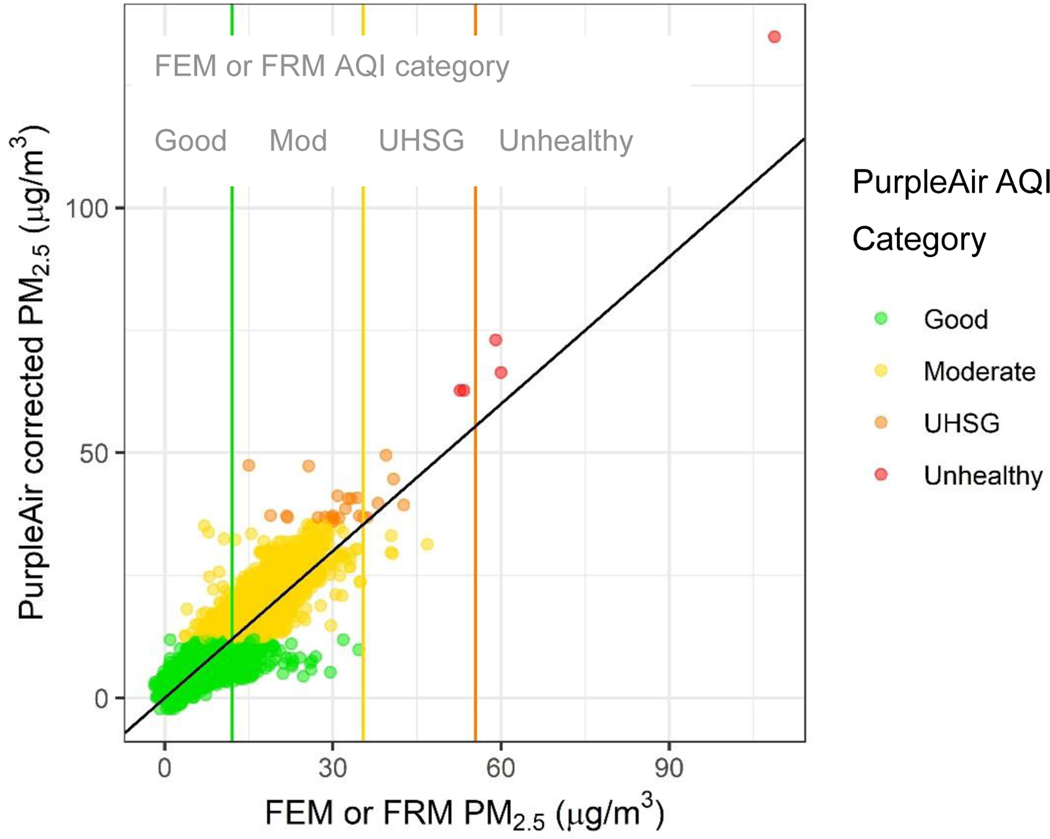
PurpleAir sensors, which measure particulate matter (PM), are widely used by individuals, community groups, and other organizations including state and local air monitoring agencies. PurpleAir sensors comprise a massive global network of more than 10,000 sensors. Previous performance evaluations have typically studied a limited number of PurpleAir sensors in small geographic areas or laboratory environments. While useful for determining sensor behavior and data normalization for these geographic areas, little work has been done to understand the broad applicability of these results outside these regions and conditions. Here, PurpleAir sensors operated by air quality monitoring agencies are evaluated in comparison to collocated ambient air quality regulatory instruments. In total, almost 12,000 24-hour averaged PM2.5 measurements from collocated PurpleAir sensors and Federal Reference Method (FRM) or Federal Equivalent Method (FEM) PM2.5 measurements were collected across diverse regions of the United States (U.S.), including 16 states. Consistent with previous evaluations, under typical ambient and smoke impacted conditions, the raw data from PurpleAir sensors overestimate PM2.5 concentrations by about 40% in most parts of the U.S. A simple linear regression reduces much of this bias across most U.S. regions, but adding a relative humidity term further reduces the bias and improves consistency in the biases between different regions. More complex multiplicative models did not substantially improve results when tested on an independent dataset. The final PurpleAir correction reduces the root mean square error (RMSE) of the raw data from 8 μg m-3 to 3 μg m-3 with an average FRM or FEM concentration of 9 μg m-3. This correction equation, along with proposed data cleaning criteria, has been applied to PurpleAir PM2.5 measurements across the U.S. in the AirNow Fire and Smoke Map (fire.airnow.gov) and has the potential to be successfully used in other air quality and public health applications.
Conflict of interest statement
9Competing interests The authors declare that they have no conflict of interest.
Figures
References
-
- Al-Thani H, Koç M. and Isaifan RJ (2018). “A review on the direct effect of particulate atmospheric pollution on materials and its mitigation for sustainable cities and societies.” Environmental Science and Pollution Research 25(28): 27839–27857. - PubMed
-
- Apte JS, Marshall JD, Cohen AJ and Brauer M. (2015). “Addressing Global Mortality from Ambient PM2.5.” Environmental Science & Technology 49(13): 8057–8066. - PubMed
-
- Ardon-Dryer K, Dryer Y, Williams JN and Moghimi N. (2020). “Measurements of PM2.5 with PurpleAir under atmospheric conditions.” Atmos. Meas. Tech. 13(10): 5441–5458.
-
- Barkjohn KK, Bergin MH, Norris C, Schauer JJ, Zhang Y, Black M, Hu M. and Zhang J. (2020). “Using Low-cost sensors to Quantify the Effects of Air Filtration on Indoor and Personal Exposure Relevant PM2. 5 Concentrations in Beijing, China, Aerosol Air Qual.” Aerosol Air Qual. Res.
Grants and funding
LinkOut - more resources
Full Text Sources