

Signal Transducer and Activator of Transcription-3 Modulation of Cardiac Pathology in Chronic Chagasic Cardiomyopathy
- PMID: 34504808
- PMCID: PMC8421853
- DOI: 10.3389/fcimb.2021.708325
Signal Transducer and Activator of Transcription-3 Modulation of Cardiac Pathology in Chronic Chagasic Cardiomyopathy
Abstract
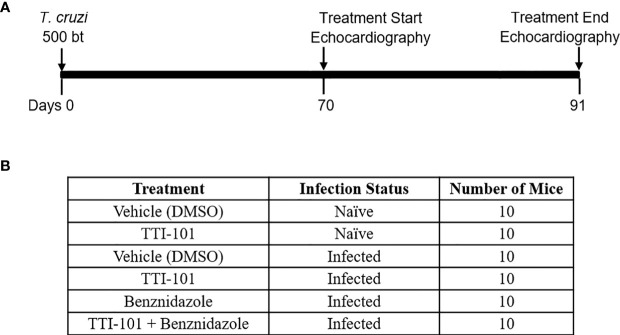
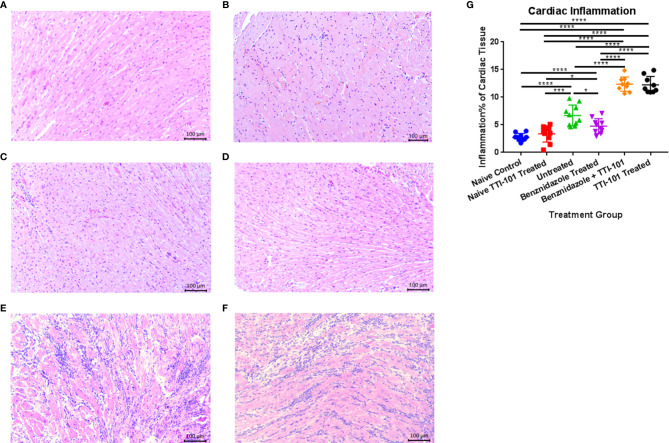
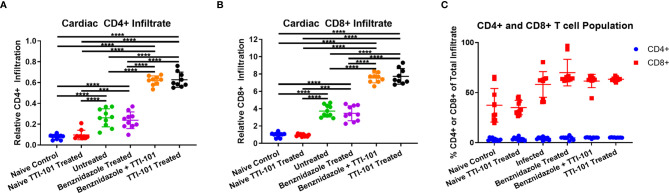
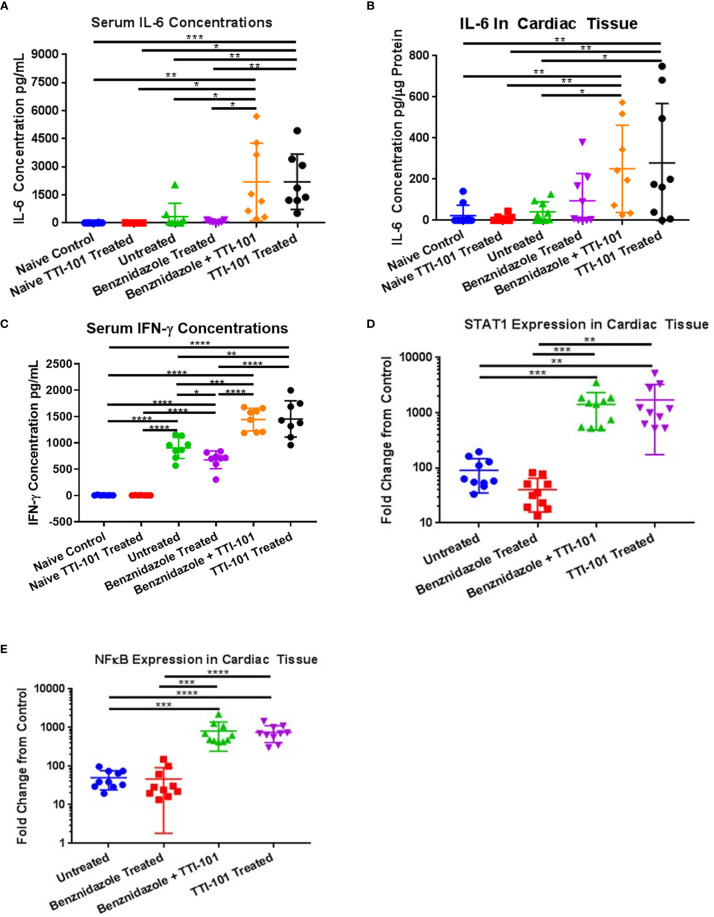
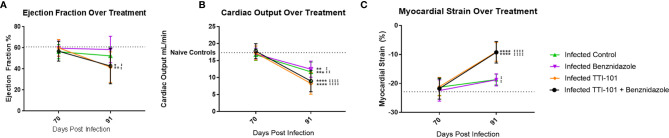
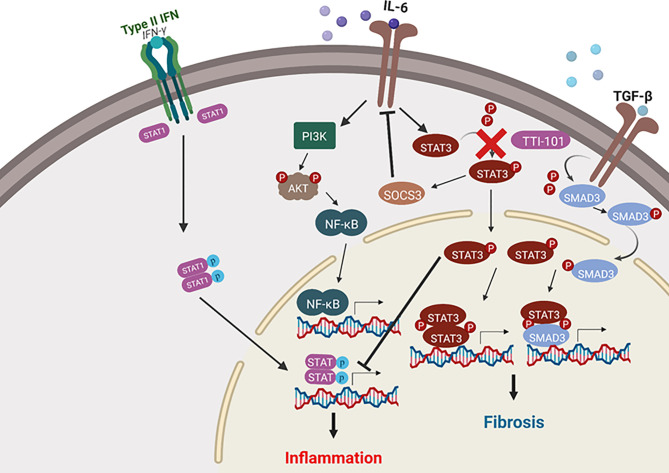
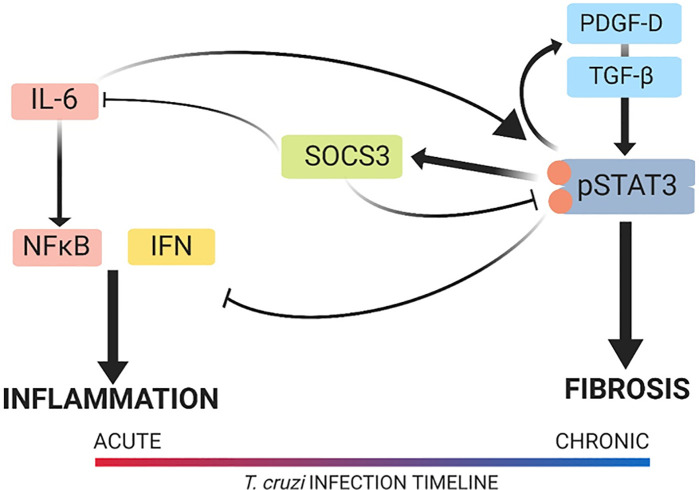
Chronic Chagasic cardiomyopathy (CCC) is a severe clinical manifestation that develops in 30%-40% of individuals chronically infected with the protozoal parasite Trypanosoma cruzi and is thus an important public health problem. Parasite persistence during chronic infection drives pathologic changes in the heart, including myocardial inflammation and progressive fibrosis, that contribute to clinical disease. Clinical manifestations of CCC span a range of symptoms, including cardiac arrhythmias, thromboembolic disease, dilated cardiomyopathy, and heart failure. This study aimed to investigate the role of signal transducer and activator of transcription-3 (STAT3) in cardiac pathology in a mouse model of CCC. STAT3 is a known cellular mediator of collagen deposition and fibrosis. Mice were infected with T. cruzi and then treated daily from 70 to 91 days post infection (DPI) with TTI-101, a small molecule inhibitor of STAT3; benznidazole; a combination of benznidazole and TTI-101; or vehicle alone. Cardiac function was evaluated at the beginning and end of treatment by echocardiography. By the end of treatment, STAT3 inhibition with TTI-101 eliminated cardiac fibrosis and fibrosis biomarkers but increased cardiac inflammation; serum levels of interleukin-6 (IL-6), and IFN-γ; cardiac gene expression of STAT1 and nuclear factor-κB (NF-κB); and upregulation of IL-6 and Type I and Type II IFN responses. Concurrently, decreased heart function was measured by echocardiography and myocardial strain. These results indicate that STAT3 plays a critical role in the cardiac inflammatory-fibrotic axis during CCC.
Keywords: STAT3; Trypanosoma cruzi; chronic Chagasic cardiomyopathy; fibrosis; inflammation.
Copyright © 2021 Hoffman, Villar, Poveda, Bottazzi, Hotez, Tweardy and Jones.
Conflict of interest statement
DT is the inventor of several patents concerning TTI-101 that are owned by Baylor College of Medicine and licensed to Tvardi Therapeutics, Inc.; DT has ownership of this company’s stock. The remaining authors declare that the research was conducted in the absence of any commercial or financial relationships that could be construed as a potential conflict of interest.
Figures
Similar articles
-
Vaccine-linked chemotherapy improves cardiac structure and function in a mouse model of chronic Chagas disease.Front Cell Infect Microbiol. 2023 Feb 9;13:1106315. doi: 10.3389/fcimb.2023.1106315. eCollection 2023. Front Cell Infect Microbiol. 2023. PMID: 36844399 Free PMC article.
-
In Chagas disease, transforming growth factor beta neutralization reduces Trypanosoma cruzi infection and improves cardiac performance.Front Cell Infect Microbiol. 2022 Nov 30;12:1017040. doi: 10.3389/fcimb.2022.1017040. eCollection 2022. Front Cell Infect Microbiol. 2022. PMID: 36530434 Free PMC article.
-
Treatment With Suboptimal Dose of Benznidazole Mitigates Immune Response Molecular Pathways in Mice With Chronic Chagas Cardiomyopathy.Front Cell Infect Microbiol. 2021 Jul 14;11:692655. doi: 10.3389/fcimb.2021.692655. eCollection 2021. Front Cell Infect Microbiol. 2021. PMID: 34381739 Free PMC article.
-
Immunomodulation for the Treatment of Chronic Chagas Disease Cardiomyopathy: A New Approach to an Old Enemy.Front Cell Infect Microbiol. 2021 Nov 12;11:765879. doi: 10.3389/fcimb.2021.765879. eCollection 2021. Front Cell Infect Microbiol. 2021. PMID: 34869068 Free PMC article. Review.
-
Myocardial gene and protein expression profiles after autoimmune injury in Chagas' disease cardiomyopathy.Autoimmun Rev. 2011 Jan;10(3):163-5. doi: 10.1016/j.autrev.2010.09.019. Epub 2010 Sep 29. Autoimmun Rev. 2011. PMID: 20883825 Review.
Cited by
-
Trypanosoma cruzi Dysregulates piRNAs Computationally Predicted to Target IL-6 Signaling Molecules During Early Infection of Primary Human Cardiac Fibroblasts.Immune Netw. 2022 Dec 2;22(6):e51. doi: 10.4110/in.2022.22.e51. eCollection 2022 Dec. Immune Netw. 2022. PMID: 36627941 Free PMC article.
-
Molecular similarities between the genes for Trypanosoma cruzi microtubule-associated proteins, mammalian interferons, and TRIMs.Parasitol Res. 2024 Sep 9;123(9):319. doi: 10.1007/s00436-024-08329-4. Parasitol Res. 2024. PMID: 39251458 Free PMC article.
-
Immunomodulatory proteins from hookworms reduce cardiac inflammation and modulate regulatory responses in a mouse model of chronic Trypanosoma cruzi infection.Front Parasitol. 2023;2:1244604. doi: 10.3389/fpara.2023.1244604. Epub 2023 Oct 12. Front Parasitol. 2023. PMID: 38239430 Free PMC article.
-
Macrophage-mediated IL-6 signaling drives ryanodine receptor-2 calcium leak in postoperative atrial fibrillation.J Clin Invest. 2025 Mar 6;135(9):e187711. doi: 10.1172/JCI187711. eCollection 2025 May 1. J Clin Invest. 2025. PMID: 40048254 Free PMC article.
-
Different responses involving Tfh cells delay parasite-specific antibody production in Trypanosoma cruzi acute experimental models.Front Immunol. 2025 Apr 28;16:1487317. doi: 10.3389/fimmu.2025.1487317. eCollection 2025. Front Immunol. 2025. PMID: 40356908 Free PMC article.
References
-
- Akira S. (1996). Transcription Factors NF-IL6 and STAT3 Involved in Cytokine Signal Transductions. Tanpakushitsu Kakusan Koso 41, 1237–1248. - PubMed
-
- Araujo-Jorge T. C., Waghabi M. C., Soeiro Mde N., Keramidas M., Bailly S., Feige J. J. (2008). Pivotal Role for TGF-Beta in Infectious Heart Disease: The Case of Trypanosoma Cruzi Infection and Consequent Chagasic Myocardiopathy. Cytokine Growth Factor Rev. 19, 405–413. 10.1016/j.cytogfr.2008.08.002 - DOI - PubMed
Publication types
MeSH terms
Substances
Grants and funding
LinkOut - more resources
Full Text Sources
Medical
Research Materials
Miscellaneous