. 2020 Sep;2(9):095003.
doi: 10.1088/2515-7620/abb831. Epub 2020 Sep 28.

Using longitudinal survey and sensor data to understand the social and ecological determinants of clean fuels use and discontinuance in rural Ghana

Affiliations

Using longitudinal survey and sensor data to understand the social and ecological determinants of clean fuels use and discontinuance in rural Ghana

D Carrión et al. Environ Res Commun. 2020 Sep.

Abstract

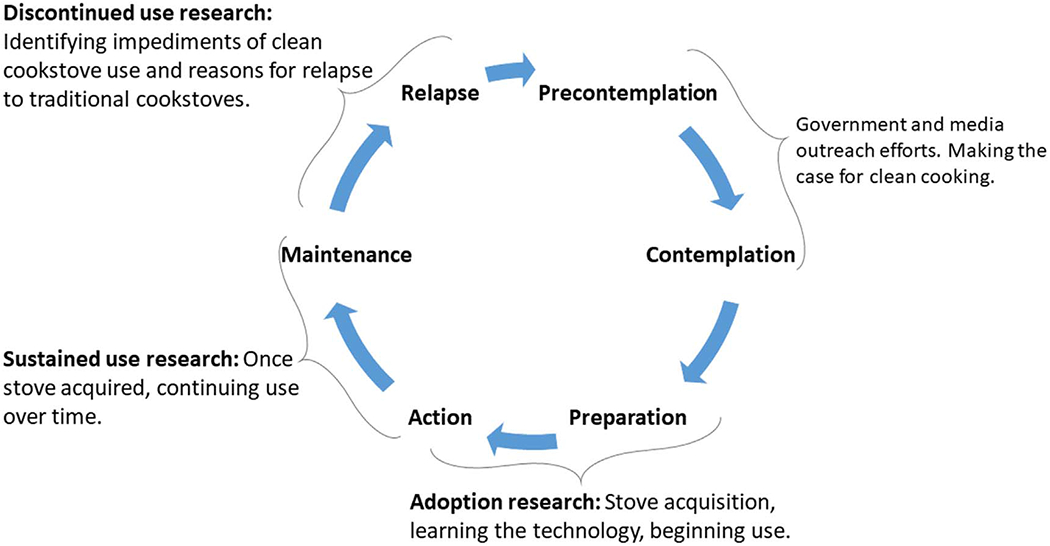
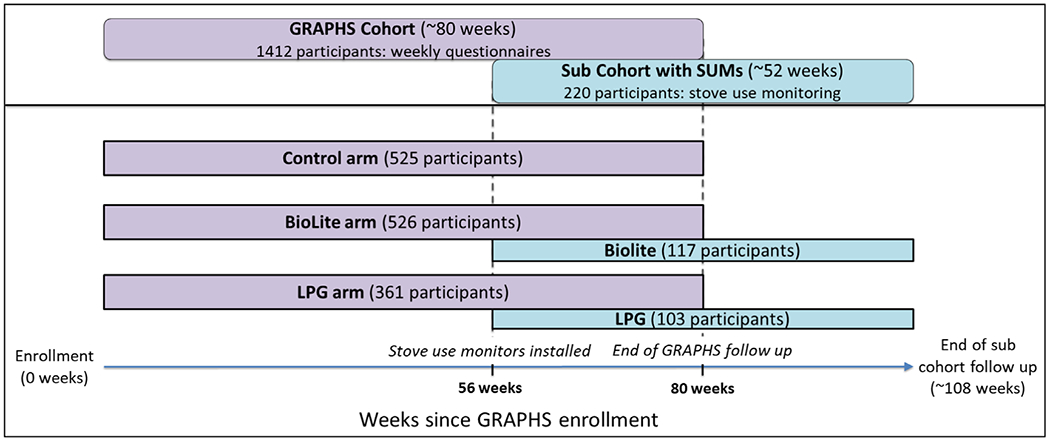
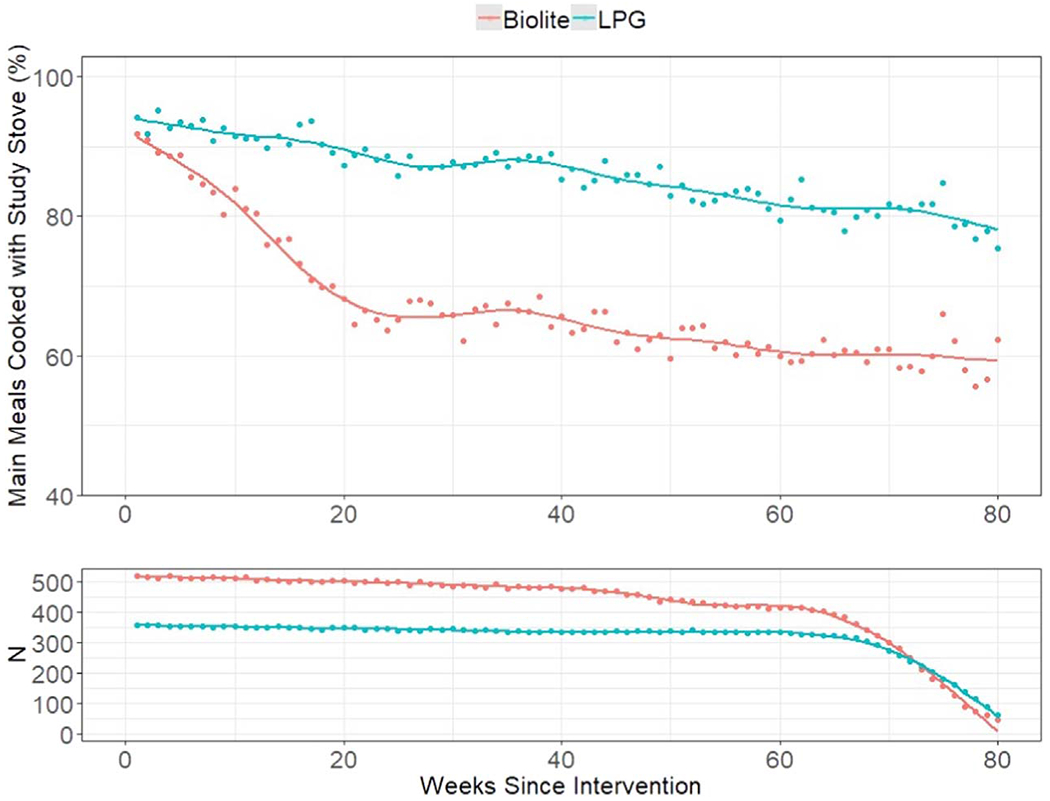
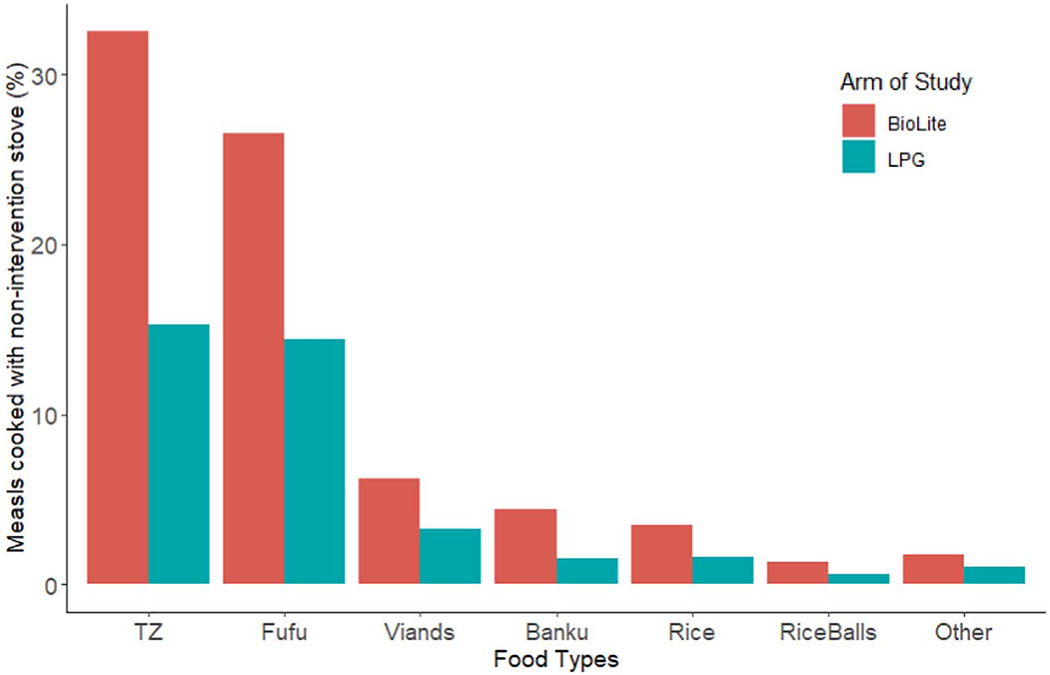
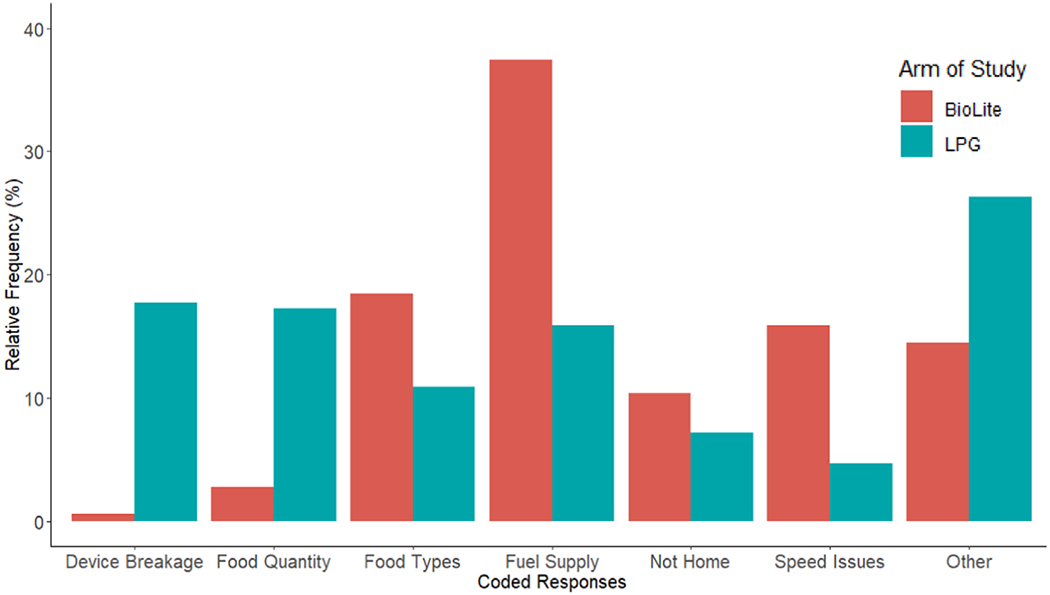
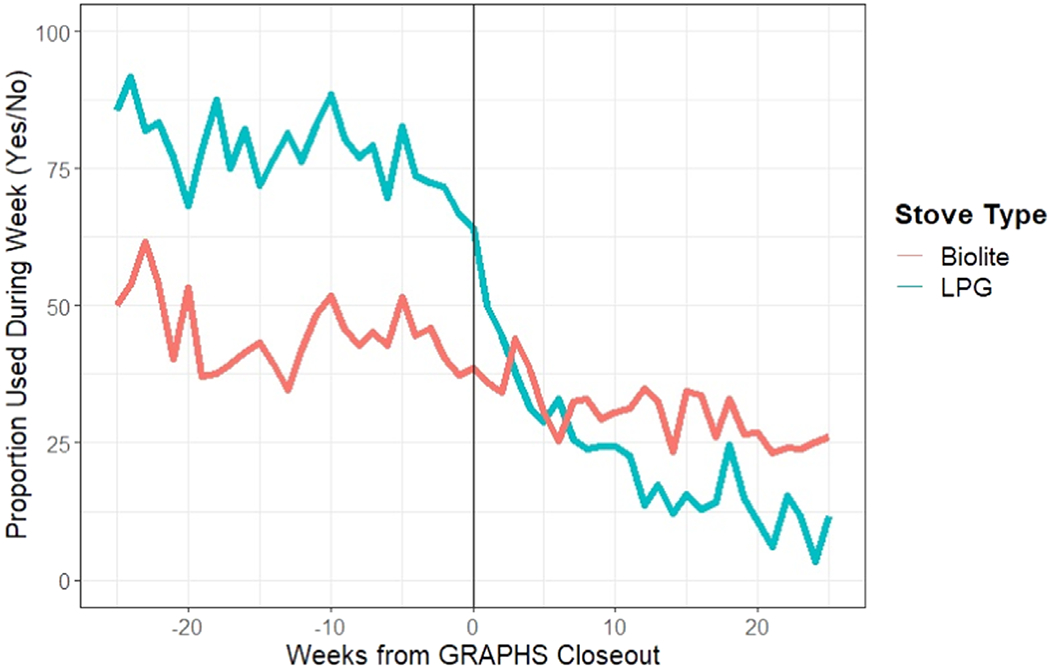
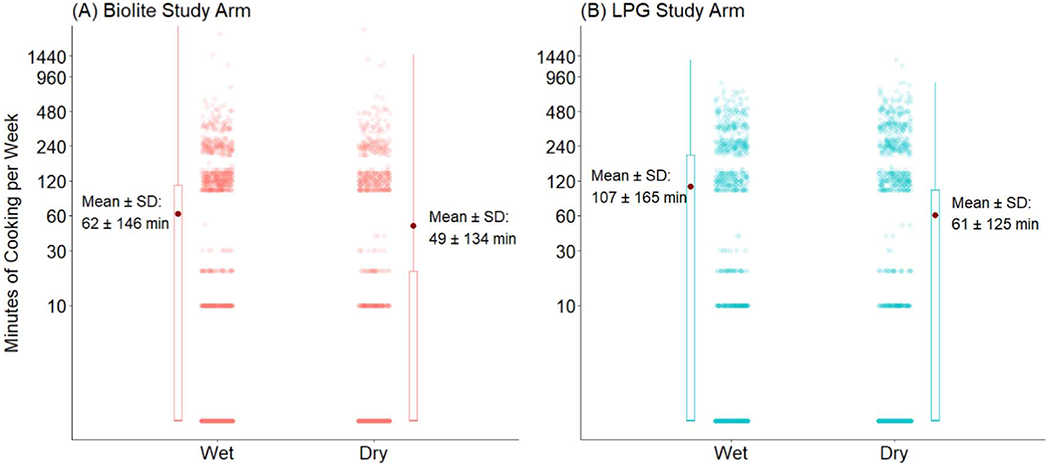
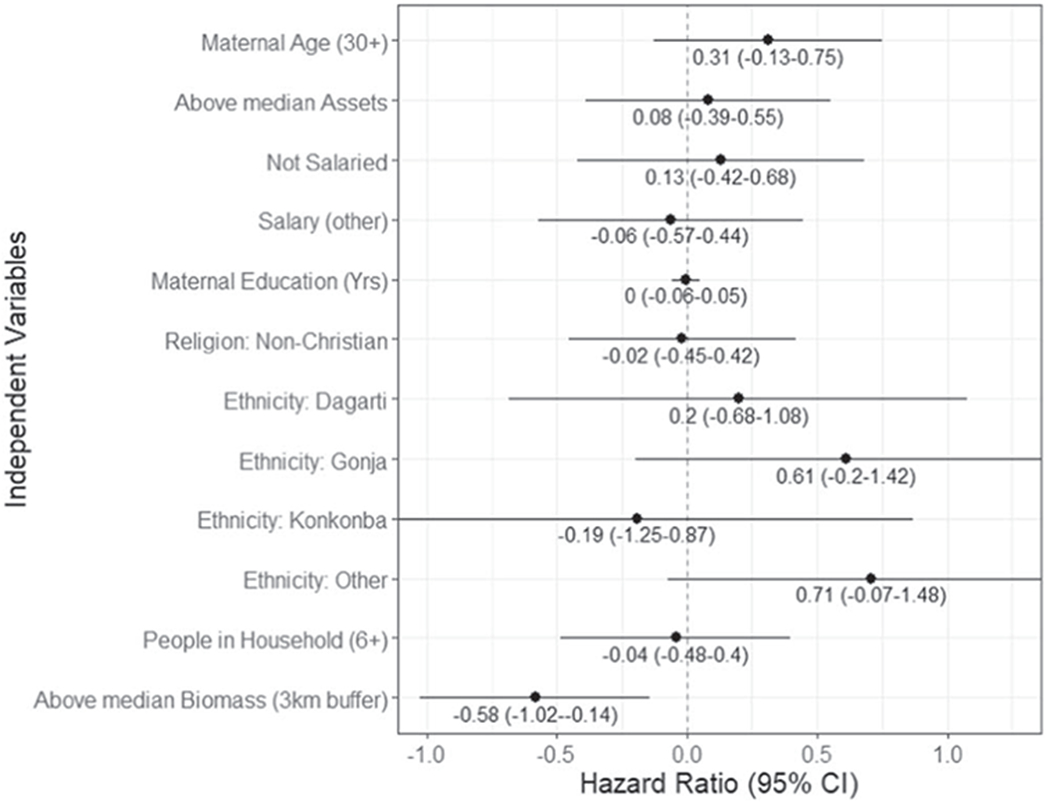
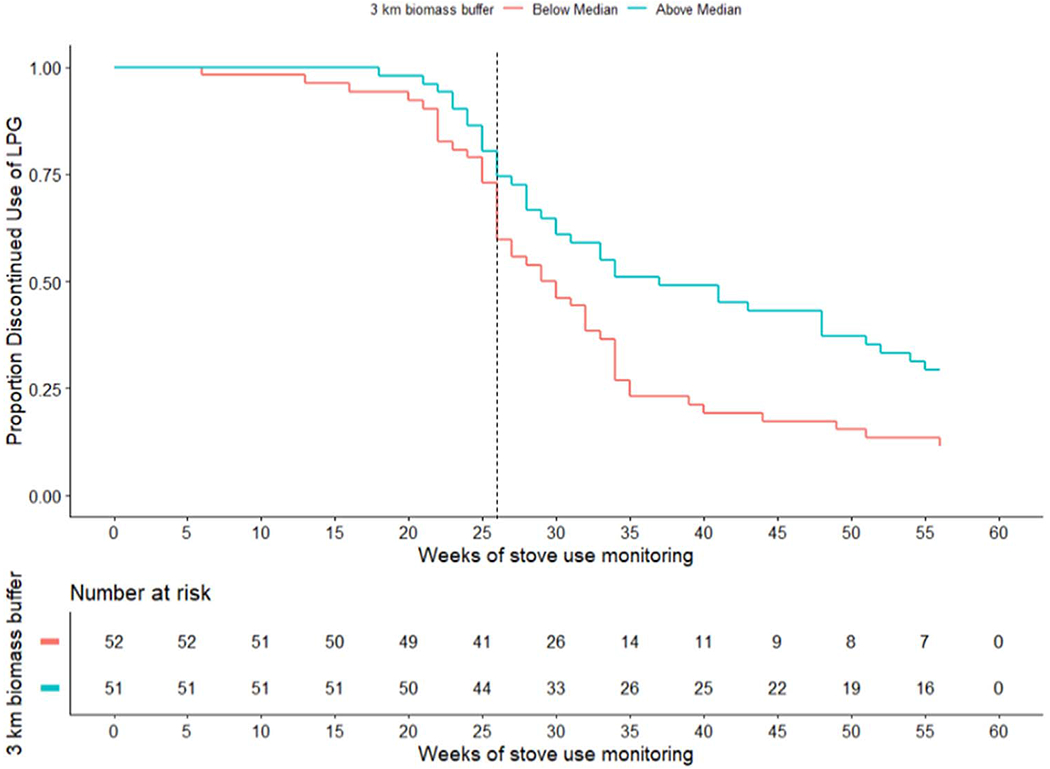
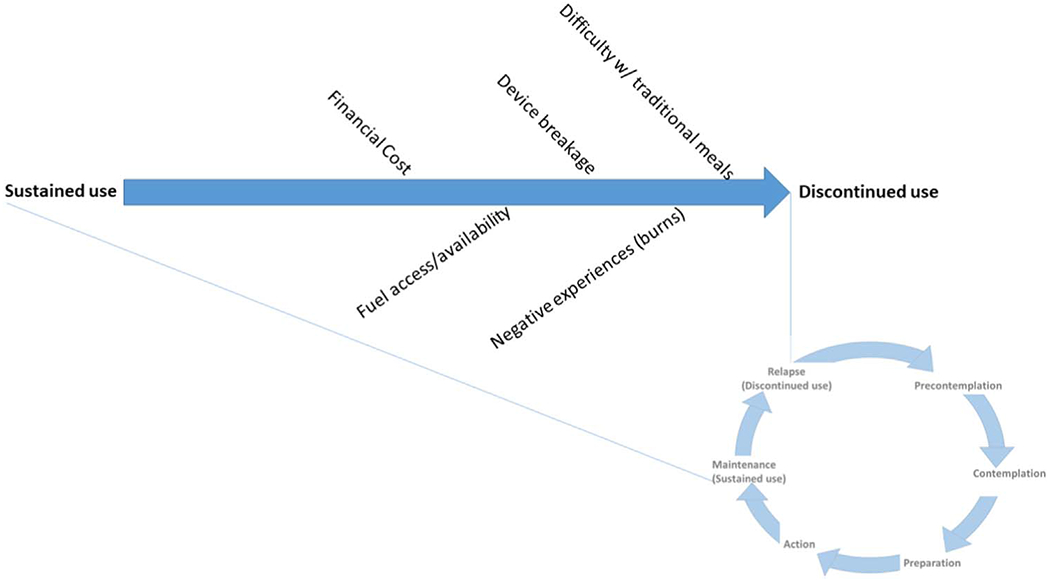
Efforts to reduce the health and ecological burdens of household biomass combustion are underway in Ghana, principally by promoting clean cookstoves and fuels. Recent studies have focused on the sustained use of clean cookstoves, but sometimes household adopt a new cookstove and then end use of that stove. In this study, we introduce a novel framework for understanding and encouraging household transitions to cleaner cooking: clean fuel discontinuance. We leveraged data from the Ghana Randomized Air Pollution and Health Study (GRAPHS) (N = 1412) where pregnant women received either improved biomass (BioLite) or dual burner LPG stoves for free. LPG users were given free LPG refills during GRAPHS. Weekly questionnaires were administered. Stove use monitors tracked a sub-cohort (n = 220) 6 months before and after the fuel subsidy. We examined social and ecological determinants of stove use and discontinuance. Overall intervention stove use adherence was high throughout GRAPHS, with self-reported use at 69% and 86% of participant-weeks for BioLite and LPG arms respectively. Participants used intervention stoves less for meals requiring vigorous stirring. Burns from intervention stoves decreased use among BioLite (RR: 0.96, p = 0.009), but not LPG users. Device breakage was mentioned as an impediment in 18% of free-text responses for LPG users and 1% for BioLite. Tree canopy within a spatial buffer-a plausible proxy for biomass fuels access-was the only variable explaining LPG discontinued stove use in adjusted Cox time-to-event analyses (HR = -0.56, p < 0.001). Future studies should consider the stove use discontinuance framework.

Keywords: biomass combustion; clean cookstoves; discontinued use; energy access; energy transitions; sustained use.


Figures

Figure 1.
Figure 1.
Adapted transtheoretical (Stages of Change) Model for clean cooking.
Figure 2.
Figure 2.
Timeline of GRAPHS and the monitored subcohort, relative to enrollment into GRAPHS. Calendar dates of enrollment were between September 2013 and January 2014.
Figure 3.
Figure 3.
Weekly self-reported intervention stove use for main meals throughout GRAPHS. Top = proportion of main meals reported as cooked with intervention stove. Bottom = Number of households responding. Points are observations and the lines are locally weighted regression smoothers.
Figure 4.
Figure 4.
Foods cooked with non-intervention stoves. TZ = Tuo Zaafi, Fufu and Banku = thick starches often eaten with soups and stews, Viands = boiled starchy vegetables (cocoyam, plantains, cassava, etc). Values do not sum to 100% due to participants who chose not to respond.
Figure 5.
Figure 5.
Results of text analysis from open-response question regarding reasons for not using intervention stoves in the past week. Synthesized from bigrams depicted in supplemental figures 4 and 5. Words categorizations in supplemental table 1.
Figure 6.
Figure 6.
Proportion of measured stove use (from stove use monitors) in a given week relative to the GRAPHS study end date.
Figure 7.
Figure 7.
Minutes of stove use per week in the subcohort by stove and season (y axis is spaced logarithmically). Dark red point = mean, dots = observations of minutes cooking per week. Box = interquartile range (IQR), whiskers = 1.5 times the IQR. Median of each group = 0 min.
Figure 8.
Figure 8.
Univariable Cox proportional hazard regression coefficients: Hazard ratios with 95% confidence intervals. Outcome is stove use discontinuance (week after last measured use). Positive values indicate increased discontinuance by the end of the study period, negative indicate decreased discontinuance. n = 103.
Figure 9.
Figure 9.
Time-to-event curve comparing discontinued use of LPG for those above the median tree canopy in a 3-kilometer buffer, and below. Dashed line at the end of GRAPHS (no additional LPG refills paid by study).
Figure 10.
Figure 10.
Summarized findings: impediments to sustained use and potential reasons for discontinuance.

References

    1. Abadi N, Gebrehiwot K, Techane A and Nerea H 2017. Links between biogas technology adoption and health status of households in rural Tigray, Northern Ethiopia Energy Policy 101 284–92
    1. Abdulai MA et al.2018Experiences with the mass distribution of LPG stoves in rural communities of Ghana EcoHealth 15757–67 - PMC - PubMed
    1. Agbokey F. et al. Determining the enablers and barriers for the adoption of clean cookstoves in the middle Belt of Ghana—A qualitative study. International Journal of Environmental Research and Public Health. 2019;16:1207. - PMC - PubMed
    1. Amoah M, Cremer T, Dadzie PK, Ohene M and Marfo O 2019. Firewood collection and consumption practices and barriers to uptake of modern fuels among rural households in Ghana International Forestry Review 21 149–66
    1. Asante KP, Afari-Asiedu S, Abdulai MA, Dalaba MA, Carrión D, Dickinson KL, Abeka AN, Sarpong K and Jack DW 2018. Ghana’s rural liquefied petroleum gas program scale up: a case study Energy for Sustainable Development 46 94–102 - PMC - PubMed

LinkOut - more resources