. 2021 Aug 11;24(9):102971.
doi: 10.1016/j.isci.2021.102971. eCollection 2021 Sep 24.

Independent transcriptomic and proteomic regulation by type I and II protein arginine methyltransferases

Affiliations

Independent transcriptomic and proteomic regulation by type I and II protein arginine methyltransferases

Maxim I Maron et al. iScience. .

Abstract

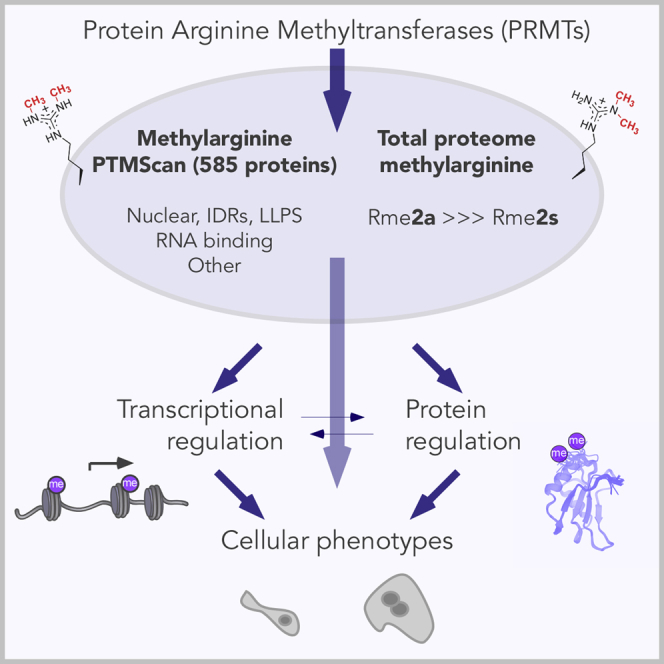
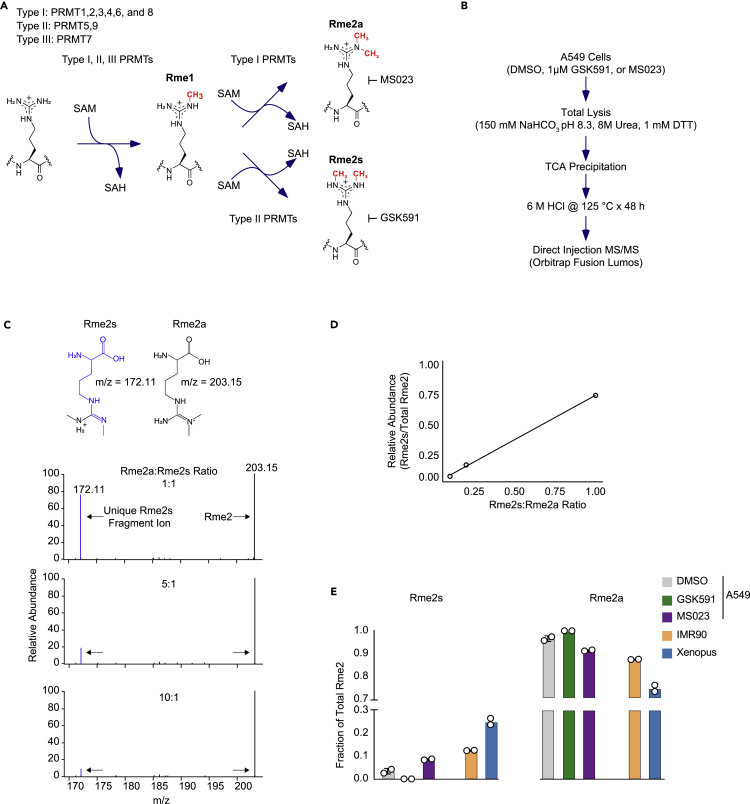
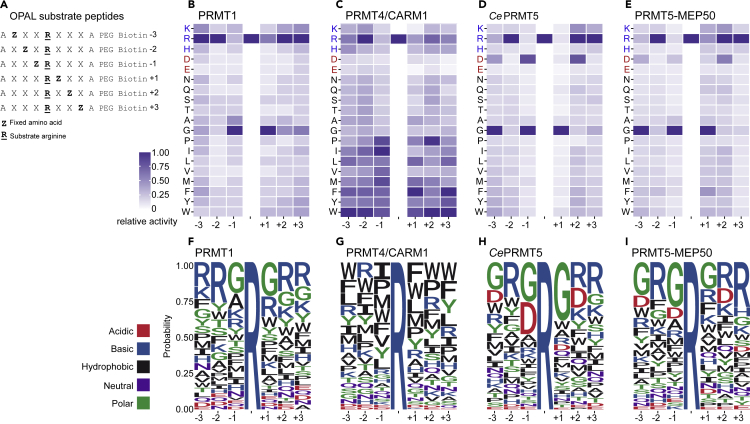
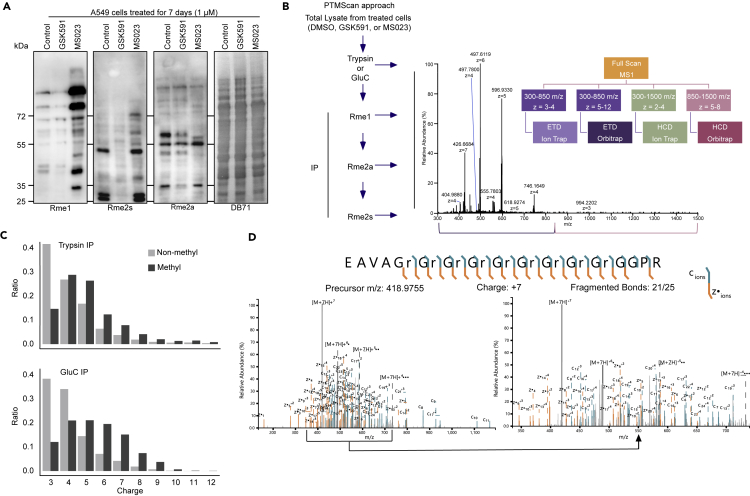
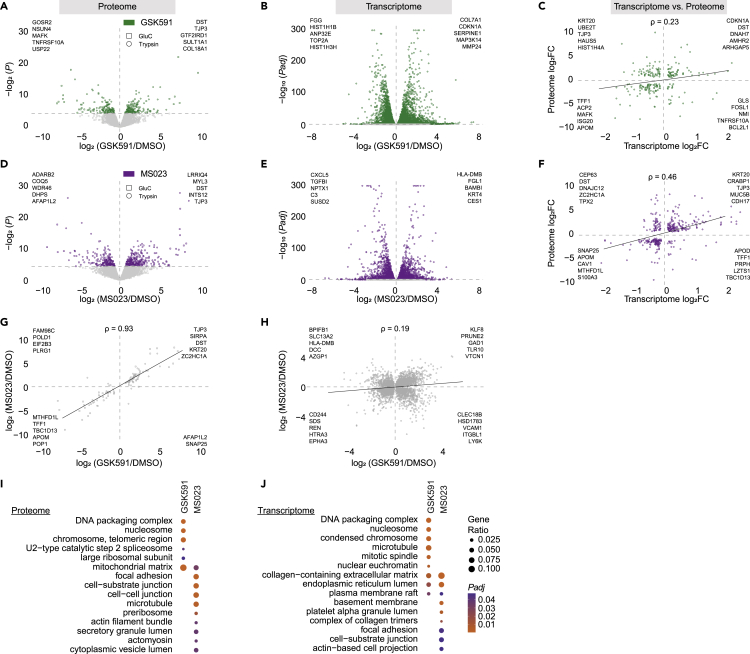
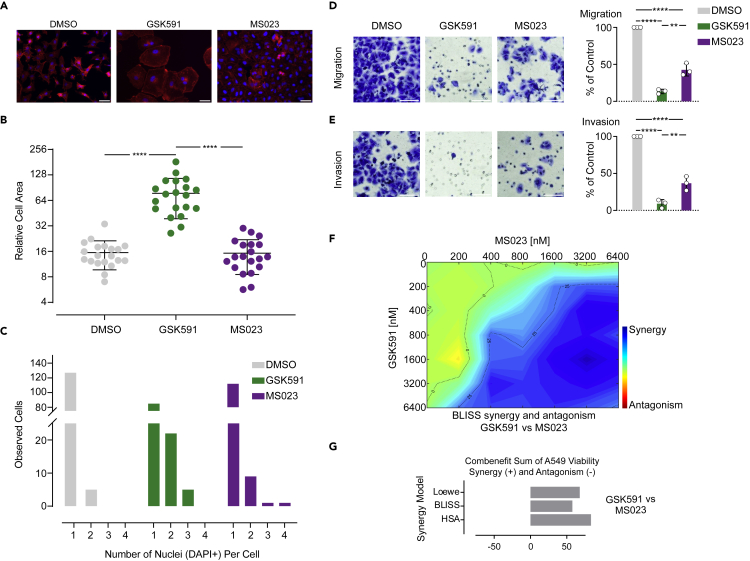
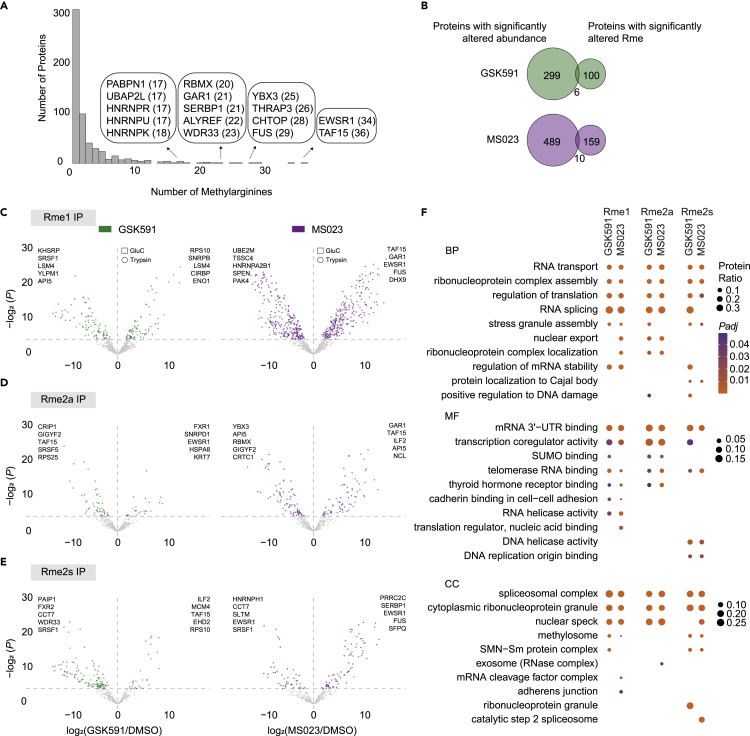
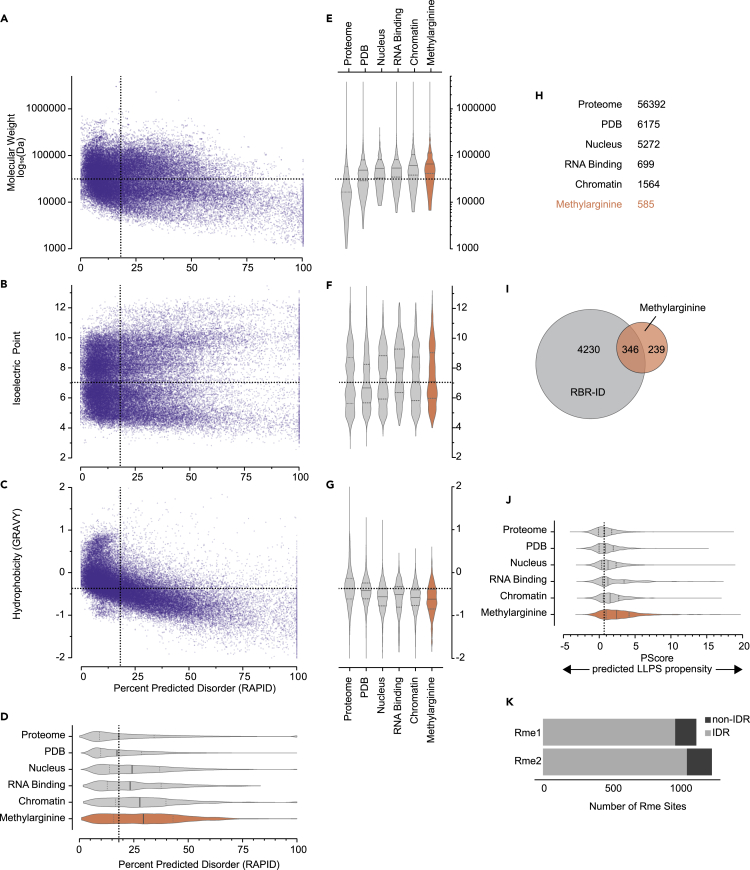
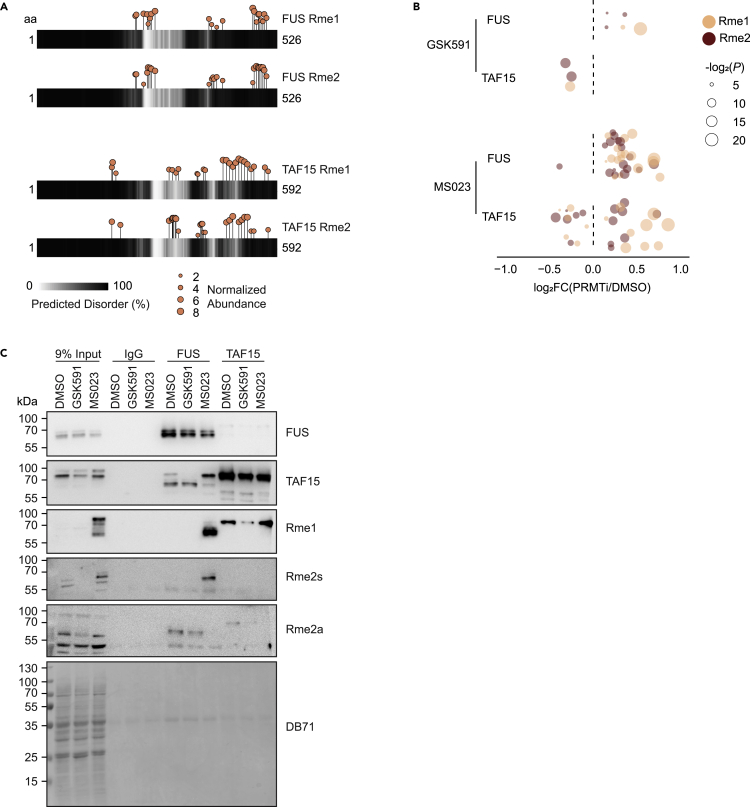
Protein arginine methyltransferases (PRMTs) catalyze the post-translational monomethylation (Rme1), asymmetric (Rme2a), or symmetric (Rme2s) dimethylation of arginine. To determine the cellular consequences of type I (Rme2a) and II (Rme2s) PRMTs, we developed and integrated multiple approaches. First, we determined total cellular dimethylarginine levels, revealing that Rme2s was ∼3% of total Rme2 and that this percentage was dependent upon cell type and PRMT inhibition status. Second, we quantitatively characterized in vitro substrates of the major enzymes and expanded upon PRMT substrate recognition motifs. We also compiled our data with publicly available methylarginine-modified residues into a comprehensive database. Third, we inhibited type I and II PRMTs and performed proteomic and transcriptomic analyses to reveal their phenotypic consequences. These experiments revealed both overlapping and independent PRMT substrates and cellular functions. Overall, this study expands upon PRMT substrate diversity, the arginine methylome, and the complex interplay of type I and II PRMTs.

Keywords: cell biology; molecular biology.


Conflict of interest statement

M.T.B. is a co-founder of EpiCypher.

Figures

None
Graphical abstract
Figure 1
Figure 1
Total proteome Rme2s and Rme2a fraction (A) Schematic of the reactions catalyzed by the three types of protein arginine methyltransferases (type I PRMTs catalyze Rme1 and Rme2a; type II PRMTs catalyze Rme1 and Rme2s; type III PRMTs catalyze only Rme1). (B) Experimental setup: A549 cells were cultured for 1 week with either 0.01% DMSO, 1 μM GSK591, or 1 μM MS023. Total protein lysates (8M Urea) were precipitated with TCA followed by complete hydrolysis in 6M HCl and heat. Resulting amino acid products were diluted in acetonitrile and direct injected onto an Orbitrap Fusion Lumos. (C) Example MS2 spectra from varying ratios of Rme2a:Rme2s highlighting abundance changes in the unique Rme2s fragment ion. Schematic at top indicates characteristic ions for Rme2s and Rme2a in the MS2. (D) Standard curve of the change in Rme2s relative to total Rme2 over varying concentrations of Rme2a and Rme2s. (E) Fraction of Rme2s and Rme2a of total Rme2 for A549 cells treated with either 0.01% DMSO (gray), 1 μM GSK591 (green), or 1 μM MS023 (purple), as well as IMR90 cells (orange) and Xenopus cell-free egg extract (blue). Data are represented as mean ± SD.
Figure 2
Figure 2
In vitro substrates of the major enzymes PRMT1, PRMT4/CARM1, and PRMT5 (A) Oriented peptide array library (OPAL) substrate degeneracy schematic. As shown, the substrate arginine (R) is fixed as is one other position per mixture (Z) (locations −3,-2,-1, or 1,2,3 relative to the fixed R). The remainder of the substrate peptide residues are degenerate (X). (B) Homo sapiens (Hs) PRMT1 relative activity toward the OPAL substrate library. Each row represents the fixed amino acid in each position. Charged residues are colored (blue = positive, red = negative) and shown at the top. Relative activity is shown as a heatmap (0–100%, white to blue). (C) HsPRMT4/CARM1 relative activity shown as a heatmap. (D) C. elegans (Ce) PRMT5 relative activity shown as a heatmap. (E) X. laevis (Xl) PRMT5-MEP50 complex relative activity shown as a heatmap. (F) Sequence logo probability plot of PRMT1 relative activity. Acidic residues are shown in red, basic in blue, hydrophobic in black, neutral in purple, and polar residues shown in green. (G) Sequence logo probability plot of HsPRMT4/CARM1 relative activity. (H) Sequence logo probability plot of CePRMT5 relative activity. (I) Sequence logo probability plot of XlPRMT5-MEP50 relative activity.
Figure 3
Figure 3
PTMScan of arginine methylated proteins in cells treated with PRMT inhibitors (A) Total proteome western blots of all three methylarginine states. Using the CST Rme1 (left), Rme2s (center left panel), and Rme2a (center right panel) antibodies, the changes in methylarginine protein abundance are shown for the control (DMSO), GSK591, and MS023 conditions. The right panel shows the Direct Blue 71 (DB71) membrane stain. (B) Schematic of PTMScan approach. Purified tryptic or GluC peptides—in biological triplicate—were sequentially immunoprecipitated with the CST Rme1 antibodies, Rme2a antibodies, and then Rme2s antibodies. Peptides were eluted and subject to mass spectrometry. A sample of input peptides was reserved for total proteome analysis. (C) Ratio of charge distribution of methylated (dark) versus non-methylated (light) peptides in either trypsin (top) or GluC (bottom) samples. (D) Example ETD spectrum of the C-terminal peptide from small nuclear ribonucleoprotein SmD1 (SNRPD1). The peptide fragment from residue 93 to 118 containing 9x dimethylarginines, all site localized. The region from 350 to 750 m/z of the full mass spectrum (left/top) is expanded in the (right/bottom) spectra.
Figure 4
Figure 4
Proteomic and Transcriptomic analysis reveals robust PRMT-inhibitor dependent changes (A) Volcano plot of combined trypsin (circle) and GluC (square) derived total protein changes in GSK591-treated A549 cells relative to DMSO where x axis is log2(fold change relative to DMSO); y axis is -log2(P) (dashed y axis line represents P = 0.05; significant values are green). The top 5 most significant proteins are listed in the upper quadrants. (B) Volcano plot of transcriptomic changes in GSK591-treated A549 cells relative to DMSO where x axis is log2(fold change relative to DMSO); y axis is -log10(Padj) (dashed y axis line represents Padj = 0.05; significant values are green). The top 5 most significant transcripts are listed in the upper quadrants. (C) Comparison of common significant transcript and protein log2(fold change relative to DMSO) for GSK591-treated cells. The top 5 most significant genes are listed in their respective quadrants. (D) Volcano plot of combined trypsin (circle) and GluC (square) derived total protein changes in MS023-treated A549 cells relative to DMSO where x axis is log2(fold change relative to DMSO); y axis is -log2(P) (dashed y axis line represents P = 0.05; significant values are purple). The top 5 most significant proteins are listed in the upper quadrants. (E) Volcano plot of transcriptomic changes in MS023-treated A549 cells relative to DMSO where x axis is log2(fold change relative to DMSO); y axis is -log10(Padj) (dashed y axis line represents Padj = 0.05; significant values are purple). The top 5 most significant transcripts are listed in the upper quadrants. (F) Comparison of common significant transcript and protein log2(fold change relative to DMSO) for MS023-treated cells. The top 5 most significant genes are listed in their respective quadrants. (G) Comparison of common significant protein log2(fold change relative to DMSO) for GSK591- and MS023-treated cells. The top 5 most significant proteins are listed in their respective quadrants. (H) Comparison of common significant transcript log2(fold change relative to DMSO) for GSK591- and MS023-treated cells. The top 5 most significant transcripts are listed in their respective quadrants. (I) Over-representation analysis for Cellular Component of the top 300 most significant differentially abundant proteins in either GSK591- or MS023-treated cells. Circle size is proportional to the Gene Ratio, while color denotes significance (orange is more significant, purple is less significant). (J) Over-representation analysis for Cellular Component of the top 300 most significant differentially abundant transcripts in either GSK591- or MS023-treated cells. Circle size is proportional to the Gene Ratio, while color denotes significance (orange is more significant, purple is less significant).
Figure 5
Figure 5
Phenotypic consequences of type I PRMT- or PRMT5-inhibition (A) Rhodamine phalloidin (red) and DAPI (blue) staining of A549 cells treated with 0.01% DMSO, 1 μM GSK591, or 1 μM MS023 for 7 days. Scale bar is 50 μm. (B) Cell size analysis of A549 cells treated with 0.01% DMSO (gray), 1 μM GSK591 (green), or 1 μM MS023 (purple) for 7 days. Y axis denotes relative cell area. Data are represented as mean ± SD. (C) Nuclei per cell analysis of A549 cells treated with 0.01% DMSO (gray), 1 μM GSK591 (green), or 1 μM MS023 (purple) for 7 days. Y axis denotes observed cells. (D) Migration assay of A549 cells treated with 0.01% DMSO (gray), 1 μM GSK591 (green), or 1 μM MS023 (purple) for 7 days. Micrographs of crystal violet stained (purple) cells (left); scale bar is 50 pixels. Quantitation of successfully migrating cells relative to control (right). Data are represented as mean ± SD. (E) Invasion assay of A549 cells treated with 0.01% DMSO (gray), 1 μM GSK591 (green), or 1 μM MS023 (purple) for 7 days. Micrographs of crystal violet stained (purple) cells (left); scale bar is 50 pixels. Quantitation of successfully invading cells relative to control (right). Data are represented as mean ± SD. (F) BLISS synergy and antagonism score for dose response matrix of cells treated with GSK591 (y axis) or MS023 (x axis) for 7 days (blue represents increased synergy; red represents increased antagonism). (G) Combenefit analysis for drug synergy with GSK591 and MS023 using Loewe, BLISS, and HSA models (positive more synergistic; negative more antagonistic).
Figure 6
Figure 6
PTMScan protein and residue level analysis reveals PRMT-inhibitor dependent changes in arginine methylation (A) Number of unique methylarginine residues per protein (x axis) versus the number of proteins (y axis). (B) Intersection of proteins with significant differential expression and methylarginine abundance in A549 cells treated with either GSK591 (green) or MS023 (purple) relative to DMSO. (C–E) Volcano plot of combined trypsin (circle) and GluC (square) monomethylarginine (Rme1) (c) asymmetric dimethylarginine (Rme2a) (d) and symmetric dimethylarginine (Rme2s) (e) peptide enrichments for GSK591 (left, green) and MS023 (right, purple) treated cells where x axis is log2(fold change relative to DMSO); y axis is -log2(P) (dashed y axis line represents P = 0.05). The top 5 most significant proteins are listed in the upper quadrants. (F) Over-representation analysis for Biological Process (BP), Molecular Function (MF), and Cellular Component (CC) ontologies of the significant differentially abundant protein enrichments according to their IP in either GSK591- or MS023-treated cells. Circle size is proportional to the Protein Ratio, while color denotes significance (orange is more significant, purple is less significant).
Figure 7
Figure 7
Proteome characteristics reveal the nature of the PTMScan arginine methylome (A) Comparison of RAPID predicted intrinsic disorder percentage on x axis and the log10(molecular weight (Da)) on the y axis for 56,392 human proteins (Uniprot, 2012). Vertical dashed line denotes the median intrinsic disorder (18.1%); horizontal dashed line denotes median molecular weight (31.4 kDa). (B) Comparison of RAPID predicted intrinsic disorder (x axis) and isoelectric point (y axis). Vertical dashed line denotes the median intrinsic disorder (18.1%); horizontal dashed line denotes median isoelectric point (7.03). (C) Comparison of RAPID predicted intrinsic disorder (x axis) and hydrophobicity as calculated by GRAVY (y axis). Positive scores are hydrophobic, while negative scores are hydrophilic. Vertical dashed line denotes the median intrinsic disorder (18.1%); horizontal dashed line denotes median hydrophobicity (−0.37). (D) RAPID percent disorder distribution of the proteome, PDB, Nucleus, RNA-binding, chromatin, and methylarginine (orange) sets. Vertical dashed line denotes the proteomic median intrinsic disorder (18.1%); solid line within individual plots denotes median, while dashed lines denote quartiles. (E) The molecular weight distribution of the proteome, PDB, Nucleus, RNA-binding, chromatin, and methylarginine (orange) sets are shown as violin plots as in d. (F) The isoelectric point distribution of the proteome, PDB, Nucleus, RNA-binding, chromatin, and methylarginine (orange) sets are shown as violin plots as in d. (G) The GRAVY hydrophobicity distribution of the proteome, PDB, Nucleus, RNA-binding, chromatin, and methylarginine (orange) sets are shown as violin plots as in d. (H) Table showing the number of proteins in each set. (I) Venn diagram showing the intersection human proteins between the PTMScan methylarginine containing proteins and those previously identified to be bound to RNA using RBR-ID. (J) PScore distribution—indicating pi-pi mediated liquid-liquid phase separation (LLPS) propensity—for the proteome, PDB, Nucleus, RNA-binding, chromatin, and methylarginine (orange) sets. Vertical dashed line denotes the proteomic median PScore (0.69); solid line within individual plots denotes median, while dashed lines denote quartiles. (K) Percent of residues found in intrinsically disordered regions (light) or non-disordered regions (dark) for Rme1 (86.2%) and Rme2 (85.2%).
Figure 8
Figure 8
PRMT inhibition promotes substrate scavenging of FUS and TAF15 (A) Rme1 and Rme2s abundance in A549 cells (lollipop height and size) juxtaposed with DISOPRED3 predicted intrinsic disorder for FUS and TAF15 (white less disordered; black more disordered). (B) Comparison of significant GSK591- or MS023-dependent changes in Rme1 (yellow) or Rme2 (burgundy) relative to DMSO on FUS and TAF15 where each circle represents a unique residue. Circle size is proportional to -log2(P). (C) FUS and TAF15 co-immunoprecipitation blotted for each protein and methylarginine state (Rme1, Rme2s, Rme2a, as indicated). Direct Blue 71 (DB71) total protein membrane stain is at the bottom.

Similar articles

Cited by

References

    1. Banaszynski L.A., Allis C.D., Shechter D. Analysis of histones and chromatin in Xenopus laevis egg and oocyte extracts. Methods. 2010;51:3–10. - PMC - PubMed
    1. Barretina J., Caponigro G., Stransky N., Venkatesan K., Margolin A.A., Kim S., Wilson C.J., Lehár J., Kryukov G.V., Sonkin D. The Cancer Cell Line Encyclopedia enables predictive modelling of anticancer drug sensitivity. Nature. 2012;483:603–607. - PMC - PubMed
    1. Barth T.K., Imhof A. Fast signals and slow marks: the dynamics of histone modifications. Trends Biochem. Sci. 2010;35:618–626. - PubMed
    1. Boffa L.C., Karn J., Vidali G., Allfrey V.G. Distribution of NG, NG,-dimethylarginine in nuclear protein fractions. Biochem. Biophys. Res. Commun. 1977;74:969–976. - PubMed
    1. Branscombe T.L., Frankel A., Lee J.H., Cook J.R., Yang Z., Pestka S., Clarke S. PRMT5 (Janus kinase-binding protein 1) catalyzes the formation of symmetric dimethylarginine residues in proteins. J. Biol. Chem. 2001;276:32971–32976. - PubMed