. 2021 Nov;41(8):1902-1914.
doi: 10.1007/s10875-021-01120-5. Epub 2021 Sep 10.

Determinants and Reference Ranges of Serum Immunoglobulins in Middle-Aged and Elderly Individuals: a Population-Based Study

Affiliations

Determinants and Reference Ranges of Serum Immunoglobulins in Middle-Aged and Elderly Individuals: a Population-Based Study

Samer Raza Khan et al. J Clin Immunol. 2021 Nov.

Abstract

Purpose: In clinical practice, currently one reference range for serum immunoglobulin (Ig) A, G, and M is applied to all adults, although various factors may influence Ig serum levels. Population-based data on determinants of IgA, IgG, and IgM and recommendations for subgroup specific reference ranges are lacking. We aimed to provide an overview of determinants of IgA, IgG, and IgM in community-dwelling middle-aged and elderly individuals and explore determinants that influence Ig reference ranges.

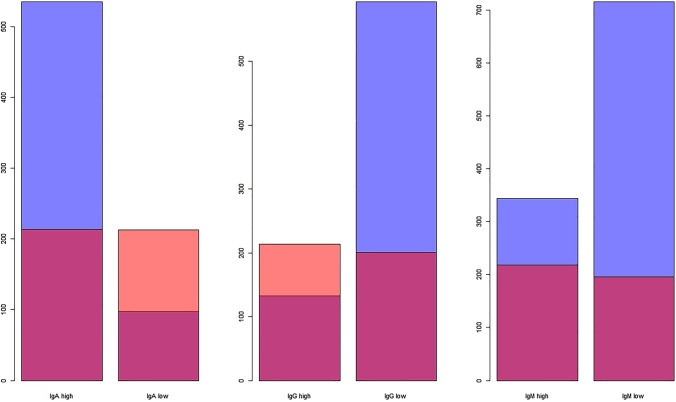
Methods: Within the Rotterdam Study, we performed linear regression analyses for the association of demographic, lifestyle, and cardiovascular factors with serum IgA, IgG, and IgM. We furthermore calculated Ig reference ranges (based on percentiles), both overall and within relevant subgroups.

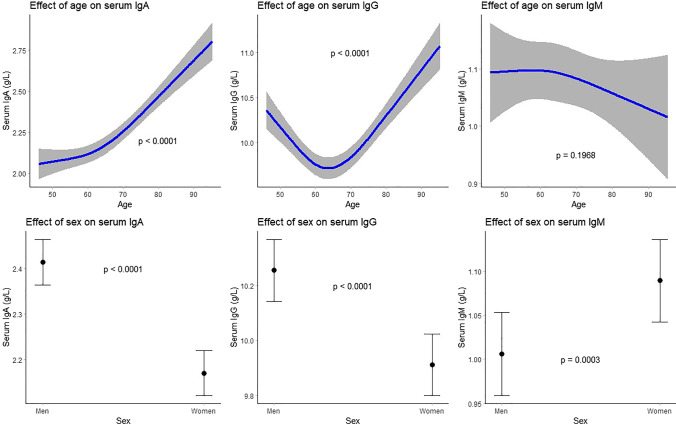
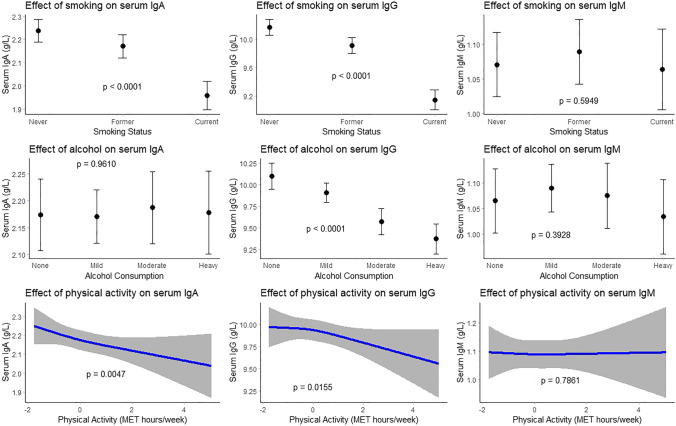
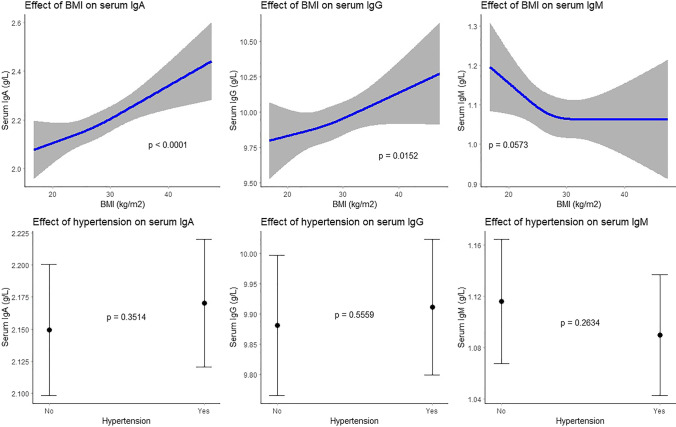
Results: We included 8768 participants (median age 62 years). IgA and IgG increased non-linearly with higher age (P < .0001 for both). Women had lower IgA (beta: - 0.24; 95% confidence interval [95% CI]: - 0.29; - 0.20) and IgG (beta: - 0.33; 95% CI: - 0.44; - 0.23), but higher IgM levels (beta: 0.08; 95% CI: 0.04;0.13) than men. Former and particularly current smoking were associated with lower IgA and IgG (betas between - 0.07 and - 1.03). Higher alcohol consumption was associated with lower IgG (beta for heavy drinking: - 0.70; 95% CI: - 0.91; - 0.48). Corticosteroid use was associated with lower IgG (beta: - 1.12; 95% CI: - 1.58; - 0.66). Associations with cardiovascular factors were heterogeneous and differed between sexes.

Conclusion: Age, sex, smoking, alcohol consumption, corticosteroid use, and cardiovascular factors are determinants that should be considered when interpreting serum Ig levels in middle-aged and elderly individuals and may require adjusted reference ranges.

Keywords: Aging; Epidemiologic factors; Immunoglobulin A; Immunoglobulin G; Immunoglobulin M; Reference values.


Conflict of interest statement

The authors declare no competing interests.

Figures

Fig. 1
Fig. 1
Association between demographic factors and serum immunoglobulin (g/L) levels. Top 3 plots depict association between age and serum IgA, IgG, and IgM respectively with corresponding 95% confidence intervals. The associations have been adjusted for sex, BMI, smoking status, alcohol consumption, and hypertension. Bottom 3 plots depict association between sex and serum IgA, IgG, and IgM respectively with corresponding 95% confidence intervals. The associations have been adjusted for age, BMI, smoking status, alcohol consumption, and hypertension. IgA, immunoglobulin A; IgG, immunoglobulin G; IgM, immunoglobulin M; BMI, body mass index
Fig. 2
Fig. 2
Association between lifestyle factors and serum immunoglobulin (g/L) levels. Top 3 plots depict association between smoking status and serum IgA, IgG, and IgM respectively with corresponding 95% confidence intervals. The associations have been adjusted for age, sex, BMI, alcohol consumption, and hypertension. Middle 3 plots depict association between alcohol consumption and serum IgA, IgG, and IgM respectively with corresponding 95% confidence intervals. The associations have been adjusted for age, sex, BMI, smoking status, and hypertension. Mild consumption was defined as 0–10 g/day, moderate consumption as 10–20 g/day, and heavy consumption as > 20 g/day. According to WHO guidelines, 10 g alcohol/day is equivalent to one alcoholic beverage. Bottom 3 plots depict association between psychical activity and serum IgA, IgG, and IgM respectively with corresponding 95% confidence intervals. The associations have been adjusted for age, sex, BMI, smoking status, alcohol consumption, and hypertension. Psychical activity is depicted as standardized score of metabolic equivalent of task (MET) hours/week. IgA, immunoglobulin A; IgG, immunoglobulin G; IgM, immunoglobulin M; BMI, body mass index; WHO, World Health Organization
Fig. 3
Fig. 3
Association between cardiovascular risk factors and serum immunoglobulin (g/L) levels. Top 3 plots depict association between BMI and serum IgA, IgG, and IgM respectively with corresponding 95% confidence intervals. The associations have been adjusted for age, sex, smoking status, alcohol consumption, and hypertension. Bottom 3 plots depict association between hypertension and serum IgA, IgG, and IgM respectively with corresponding 95% confidence intervals. The associations have been adjusted for age, sex, BMI, smoking status, and alcohol consumption. Hypertension was defined as a resting blood pressure of ≥ 140/90 mm Hg or as use of blood pressure lowering agents with the indication of hypertension. IgA, immunoglobulin A; IgG, immunoglobulin G; IgM, immunoglobulin M; BMI, body mass index
Fig. 4
Fig. 4
Number of participants with low or high serum immunoglobulin levels according to different reference ranges. Blue depicts the number of participants with serum immunoglobulin levels outside the reference range as recommended by the assay’s manufacturer. Orange depicts the number of participants with serum immunoglobulin levels outside the reference range as computed by us for this population. Red depicts the overlay in participants with low or high immunoglobulin levels according to both reference ranges. IgA, immunoglobulin A; IgG, immunoglobulin G; IgM, immunoglobulin M

References

    1. Späth PJ. Structure and function of immunoglobulins. Sepsis. 1999;3(3):197–218.
    1. Oksenhendler E, Gerard L, Fieschi C, Malphettes M, Mouillot G, Jaussaud R, et al. Infections in 252 patients with common variable immunodeficiency. Clin Infect Dis. 2008;46(10):1547–1554. - PubMed
    1. Fischer A, Provot J, Jais JP, Alcais A, Mahlaoui N, members of the CFPIDsg. Autoimmune and inflammatory manifestations occur frequently in patients with primary immunodeficiencies. J Allergy Clin Immunol. 2017;140(5):1388–93 e8. - PubMed
    1. Bonilla FA, Barlan I, Chapel H, Costa-Carvalho BT, Cunningham-Rundles C, de la Morena MT, et al. International Consensus Document (ICON): common variable immunodeficiency disorders. J Allergy Clin Immunol Pract. 2016;4(1):38–59. - PMC - PubMed
    1. Resnick ES, Moshier EL, Godbold JH, Cunningham-Rundles C. Morbidity and mortality in common variable immune deficiency over 4 decades. Blood. 2012;119(7):1650–1657. - PMC - PubMed

Publication types

LinkOut - more resources