. 2021 Sep 10;16(9):e0256655.
doi: 10.1371/journal.pone.0256655. eCollection 2021.

Medial prefrontal area reductions, altered expressions of cholecystokinin, parvalbumin, and activating transcription factor 4 in the corticolimbic system, and altered emotional behavior in a progressive rat model of type 2 diabetes

Affiliations

Medial prefrontal area reductions, altered expressions of cholecystokinin, parvalbumin, and activating transcription factor 4 in the corticolimbic system, and altered emotional behavior in a progressive rat model of type 2 diabetes

Ryosuke Ochi et al. PLoS One. .

Abstract

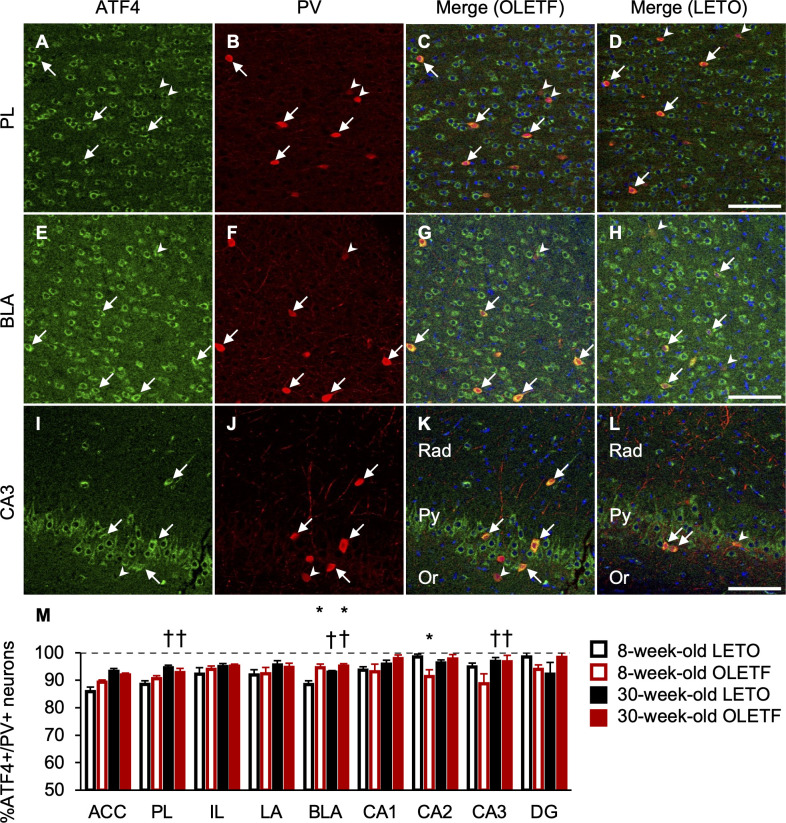
Metabolic disorders are associated with a higher risk of psychiatric disorders. We previously reported that 20-week-old Otsuka Long-Evans Tokushima fatty (OLETF) rats, a model of progressive type 2 diabetes, showed increased anxiety-like behavior and regional area reductions and increased cholecystokinin-positive neurons in the corticolimbic system. However, in which stages of diabetes these alterations in OLETF rats occur remains unclear. We aimed to investigate anxiety-like behavior and its possible mechanisms at different stages of type 2 diabetes in OLETF rats. Eight- and 30-week-old OLETF rats were used as diabetic animal models at the prediabetic and progressive stages of type 2 diabetes respectively, and age-matched Long-Evans Tokushima Otsuka rats served as non-diabetic controls. In the open-field test, OLETF rats showed less locomotion in the center zone and longer latency to leave the center zone at 8 and 30 weeks old, respectively. The areas of the medial prefrontal cortex were smaller in the OLETF rats, regardless of age. The densities of cholecystokinin-positive neurons in OLETF rats were higher in the lateral and basolateral amygdala only at 8 weeks old and in the anterior cingulate and infralimbic cortices and hippocampal cornu ammonis area 3 at both ages. The densities of parvalbumin-positive neurons of OLETF rats were lower in the cornu ammonis area 2 at 8 weeks old and in the prelimbic and infralimbic cortices at both ages. No apoptotic cell death was detected in OLETF rats, but the percentage of neurons co-expressing activating transcription factor 4 and cholecystokinin and parvalbumin was higher in OLETF rats at both ages in the anterior cingulate cortex and basolateral amygdala, respectively. These results suggest that altered emotional behavior and related neurological changes in the corticolimbic system are already present in the prediabetic stage of OLETF rats.


Conflict of interest statement

No authors have competing interests.

Figures

Fig 1
Fig 1. Experimental timeline.
Male LETO and OLETF rats were housed and given free access to food and water. At the age of 8 or 30 weeks, an oral glucose tolerance test was conducted. After 36 h, an open-field test was performed. At 12 h after the open-field test, the brain samples were collected.
Fig 2
Fig 2. Pathological values.
Body weights from 4 to 30 weeks of age (A) and just before euthanasia (B). Food intakes from 4 to 30 weeks of age (C) and mean food intakes of each experimental period (D). Area under the curves (AUCs) of glucose (E) and insulin (F) in the oral glucose tolerance test. Values represent mean ± standard error of means. * Significant difference from age-matched LETO rats, p < 0.01; † significant difference from same strain at 8 weeks of age, p < 0.01, two-way ANOVA.
Fig 3
Fig 3. Behavioral assessment in the open field test.
Locomotion in each zone (A) and number of rearing (B). Velocity of locomotive behaviors in each zone (C). Latency to leave the center zone (D) and velocity in the center zone until first escape (E). Values represent mean ± standard error of means. * Significant difference from age-matched LETO rats, p < 0.01, two-way ANOVA.
Fig 4
Fig 4. Brain weights and areas in the corticolimbic regions.
Brain weights (A) and areas of the medial prefrontal cortex (mPFC; B), basolateral amygdaloid complex (BLC; C), and hippocampus (C). Values represent mean ± standard error of means. * Significant difference from age-matched LETO rats, p < 0.05; † significant difference from same strain at 8 weeks of age, p < 0.01, two-way ANOVA.
Fig 5
Fig 5. Densities of CCK- and PV-positive neurons in the corticolimbic regions.
Densities of cholecystokinin-positive (CCK+; A) and parvalbumin-positive (PV+; B) neurons in the anterior cingulate cortex (ACC), prelimbic cortex (PL), infralimbic cortex (IL), lateral amygdala (LA), basolateral amygdala (BLA), hippocampal cornu ammonis (CA) area 1 (CA1), CA2, CA3, and dentate gyrus (DG). Values represent mean ± standard error of means. * Significant difference from age-matched LETO rats, p < 0.05; † significant difference from same strain at 8 weeks of age, p < 0.05, two-way ANOVA.
Fig 6
Fig 6. ATF4- and NeuN-positive neurons in the corticolimbic system.
Representative immunofluorescent images of 8-week-old OLETF and LETO rats in the anterior cingulate cortex (ACC; A, B, C and D), basolateral amygdala (BLA; E, F, G, and H), and hippocampal cornu ammonis area 3 (CA3; I, J, K, and L. Labeling for activating transcription factor 4 (ATF4; A, E, and I) and neuronal nuclei (NeuN; B, F, and G) and merged images (C, G, and K for OLETF rats; D, H, and L for LETO rats). Arrows or arrow heads indicate neurons expressing ATF4 and NeuN or only NeuN, respectively. Scale bars = 100 μm. Rad: radiatum layer; Py: pyramidal cell layer; Or: oriens layer. The percentages of neurons co-expressing ATF4 and NeuN in the ACC, prelimbic cortex (PL), infralimbic cortex (IL), lateral amygdala (LA), BLA, CA1, CA2, CA3, and dentate gyrus (DG; M). ATF4+: ATF4-positive; NeuN+: NeuN-positive. Values represent mean ± standard error of means. * Significant difference from age-matched LETO rats, p < 0.05, two-way ANOVA.
Fig 7
Fig 7. ATF4- and CCK-positive neurons in the corticolimbic system.
Representative immunofluorescent images of 8-week-old OLETF and LETO rats in the anterior cingulate cortex (ACC; A, B, C, and D), basolateral amygdala (BLA; E, F, G, and H), and hippocampal cornu ammonis area 3 (CA3; I, J, K, and L). Labeling for activating transcription factor 4 (ATF4; A, E, and I) and cholecystokinin (CCK; B, F, and J) and merged images (C, G, and K for OLETF rats; D, H, and L for LETO rats). Arrows or arrow heads indicate neurons expressing ATF4 and CCK or only CCK, respectively. Scale bars = 100 μm. Rad: radiatum layer; Py: pyramidal cell layer; Or: oriens layer. The percentages of neurons co-expressing ATF4 and CCK in the ACC, prelimbic cortex (PL), infralimbic cortex (IL), lateral amygdala (LA), BLA, CA1, CA2, CA3, and dentate gyrus (DG; M). ATF4+: ATF4-positive; CCK+: CCK-positive. Values represent mean ± standard error of means. * Significant difference from age-matched LETO rats, p < 0.05; † significant difference from same strain at 8 weeks of age, p < 0.01, two-way ANOVA.
Fig 8
Fig 8. ATF4- and PV-positive neurons in the corticolimbic system.
Representative immunofluorescent images of 8-week-old OLETF and LETO rats in the prelimbic cortex (PL; A, B, C and D), basolateral amygdala (BLA; E, F, G, and H), and hippocampal cornu ammonis area 3 (CA3; I, J, K, and L). Labeling for activating transcription factor 4 (ATF4; A, E, and I) and parvalbumin (PV; B, F, and J) and merged images (C, G, and K for OLETF rats; D, H, and L for LETO rats). Arrows or arrow heads indicate neurons expressing ATF4 and PV or only PV, respectively. Scale bars = 100 μm. Rad: radiatum layer; Py: pyramidal cell layer; Or: oriens layer. The percentages of neurons co-expressing ATF4 and PV in the anterior cingulate cortex (ACC), PL, infralimbic cortex (IL), lateral amygdala (LA), BLA, CA1, CA2, CA3, and dentate gyrus (DG; M). ATF4+: ATF4-positive; PV+: PV-positive. Values represent mean ± standard error of means. * Significant difference from age-matched LETO rats, p < 0.01; † significant difference from same strain at 8 weeks of age, p < 0.05, two-way ANOVA.

Similar articles

Cited by

References

    1. Alagiakrishnan K, Sclater A. Psychiatric disorders presenting in the elderly with type 2 diabetes mellitus. Am J Geriatr Psychiatry. 2012;20: 645–652. doi: 10.1097/JGP.0b013e31823038db - DOI - PubMed
    1. Smith KJ, Béland M, Clyde M, Gariépy G, Pagé V, Badawi G, et al.. Association of diabetes with anxiety: A systematic review and meta-analysis. J Psychosom Res. 2013;74: 89–99. doi: 10.1016/j.jpsychores.2012.11.013 - DOI - PubMed
    1. Dinel AL, André C, Aubert A, Ferreira G, Layé S, Castanon N. Cognitive and emotional alterations are related to hippocampal inflammation in a mouse model of metabolic syndrome. PLoS One. 2011;6: e24325. doi: 10.1371/journal.pone.0024325 - DOI - PMC - PubMed
    1. Rebolledo-Solleiro D, Roldán-Roldán G, Díaz D, Velasco M, Larqué C, Rico-Rosillo G, et al.. Increased anxiety-like behavior is associated with the metabolic syndrome in non-stressed rats. PLoS One. 2017;12: e0176554. doi: 10.1371/journal.pone.0176554 - DOI - PMC - PubMed
    1. Bocarsly ME, Fasolino M, Kane GA, Lamarca EA, Kirschen GW, Karatsoreos IN, et al.. Obesity diminishes synaptic markers, alters Microglial morphology, and impairs cognitive function. Proc Natl Acad Sci USA. 2015;112: 15731–15736. doi: 10.1073/pnas.1511593112 - DOI - PMC - PubMed

Publication types

MeSH terms