. 2021 Sep 10;16(9):e0257084.
doi: 10.1371/journal.pone.0257084. eCollection 2021.

Proteogenomic analysis of pancreatic cancer subtypes

Affiliations

Proteogenomic analysis of pancreatic cancer subtypes

Doris Kafita et al. PLoS One. .

Abstract

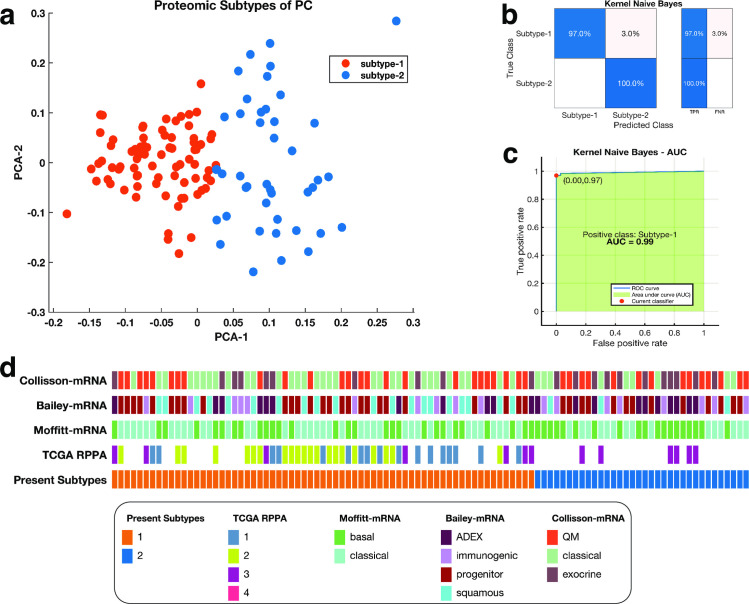
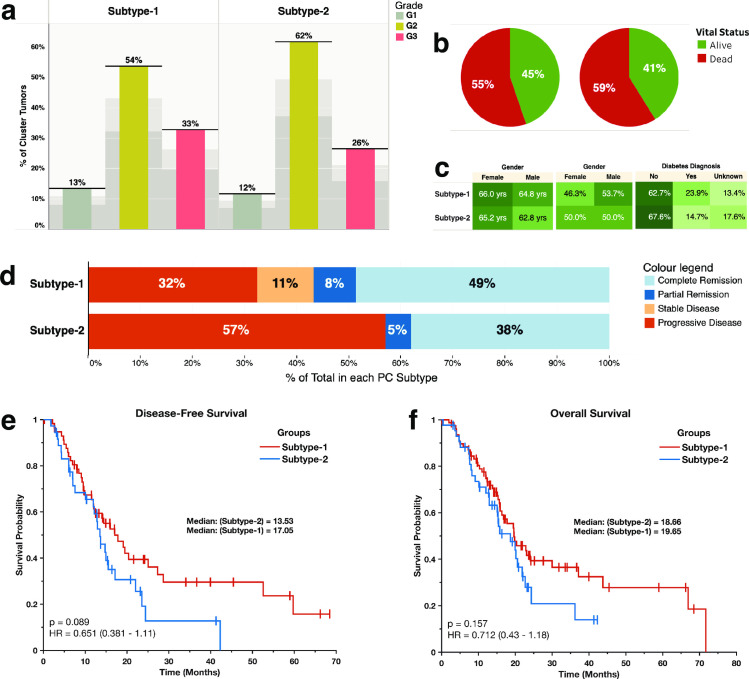
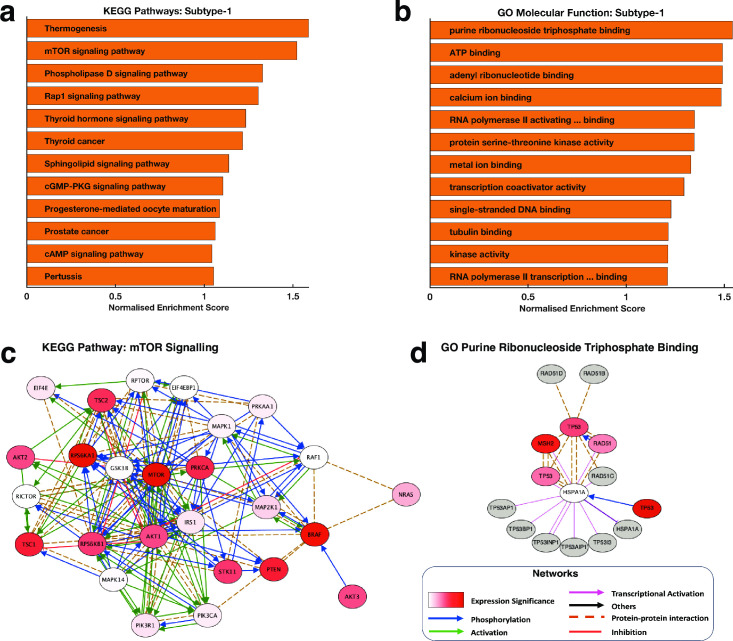
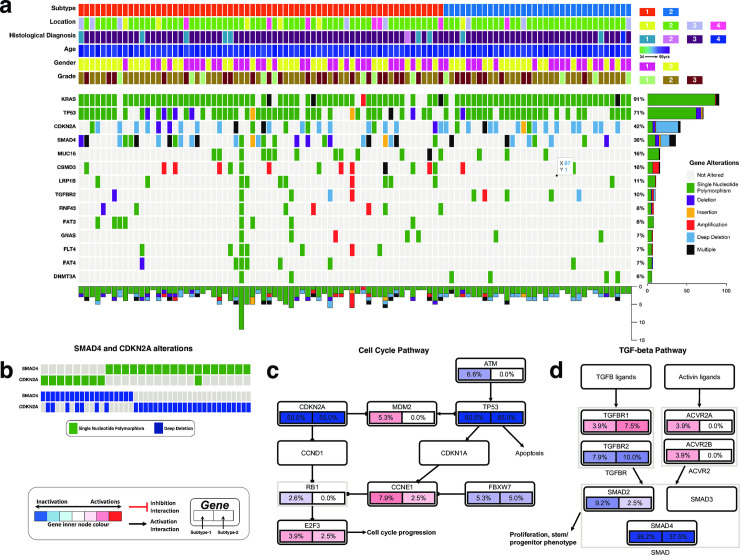
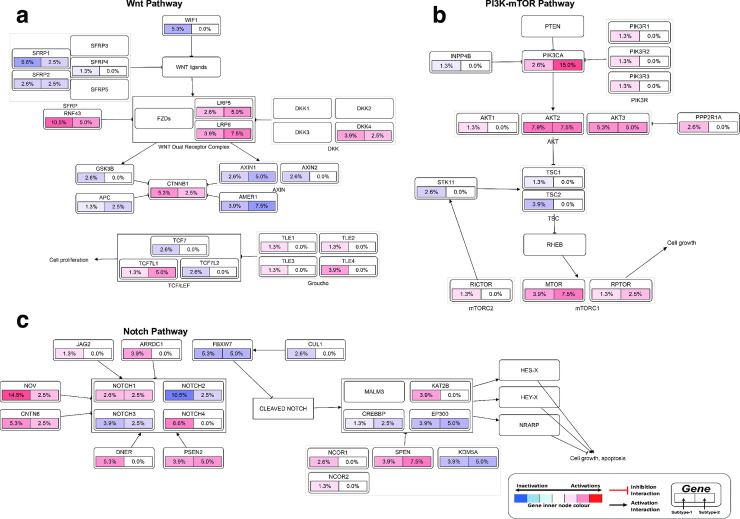
Pancreatic cancer remains a significant public health problem with an ever-rising incidence of disease. Cancers of the pancreas are characterised by various molecular aberrations, including changes in the proteomics and genomics landscape of the tumour cells. Therefore, there is a need to identify the proteomic landscape of pancreatic cancer and the specific genomic and molecular alterations associated with disease subtypes. Here, we carry out an integrative bioinformatics analysis of The Cancer Genome Atlas dataset, including proteomics and whole-exome sequencing data collected from pancreatic cancer patients. We apply unsupervised clustering on the proteomics dataset to reveal the two distinct subtypes of pancreatic cancer. Using functional and pathway analysis based on the proteomics data, we demonstrate the different molecular processes and signalling aberrations of the pancreatic cancer subtypes. In addition, we explore the clinical characteristics of these subtypes to show differences in disease outcome. Using datasets of mutations and copy number alterations, we show that various signalling pathways previously associated with pancreatic cancer are altered among both subtypes of pancreatic tumours, including the Wnt pathway, Notch pathway and PI3K-mTOR pathways. Altogether, we reveal the proteogenomic landscape of pancreatic cancer subtypes and the altered molecular processes that can be leveraged to devise more effective treatments.


Conflict of interest statement

The authors have declared that no competing interests exist.

Figures

Fig 1
Fig 1
(a) Clustering of pancreatic tumours; the first and second principal components of a PCA analysis are plots on the x-axis and y-axis response. The points are coloured according to the K-mean clustering defined cluster assignments. (b) a representative confusion matrix for the Kernel naïve Bayes classifier used to validate the clustering of the proteomic subtypes of pancreatic cancer. The blue cells correspond to samples that are correctly classified. The red cells correspond to incorrectly classified samples. In the plot, TFR shows the true-positive rate and TNR indicate the false-negative rate. (c) the Receiver operating characteristic Curve for the Kernel naïve Bayes. The green shaded area represents the area under the curve (AUC = 0.99). (d) Comparison between the current proteomic based classification of pancreatic cancers to other classification schemes from top to bottom: mRNA-based classification schemes established by Collisson et al.; Bailey et al.; and Moffitt et al., and the TCGA’s [23] RPPA classification scheme.
Fig 2
Fig 2
(a) Distribution of tumour grades across the proteomic subtypes: Showing the percentage of the total count of the number of tumours for each grade of tumour broken down by proteomic subtype. (b) Pie chart showing the vital statistics after the first course of treatment across the two disease subtypes. (c) Highlight tables showing the distribution of, from left to right: The study participants’ age, gender, and the diabetes diagnosis. (d) The clinical outcomes after the first course of treatment across the disease subtypes. (e) Kaplan-Meier curve of the disease-free survival months of patients afflicted by each pancreatic cancer subtype (f) Kaplan-Meier curve of the overall survival months of patients afflicted by each pancreatic cancer subtype.
Fig 3
Fig 3
Showing the top-ranked enriched (a) KEGG pathway and (b) GO Molecular functions in the subtype-1 tumours compared to the subtype-2 tumours. (c) A network of the genes that encompass the KEGG pathways “mTOR signalling pathway” that we found significantly enriched in subtype-1 tumours compared to subtype-2 tumours. The nodes are coloured using the degree of statistical significance for each protein (negative logarithm of the p-values) between subtype-1 and subtype-2 tumours. (d) A network of the genes that encompass the GO-term molecular function “Purine Ribonucleoside Triphosphate Binding” that we found significantly enriched in the subtype-1 compared to the subtype-2 tumours. The nodes are coloured based on the degree of statistical significance for each protein (negative logarithm of the p-values) between subtype-1 and subtype-2 tumours with redder colours indicating a higher level of statistical significance.
Fig 4
Fig 4
(a) The integrated plot of gene mutations, copy number alterations and the clinical features of the pancreatic tumours and the afflicted patients. From top to bottom panels indicate the proteomic subtypes of pancreatic cancer; the tumour location in the pancreas; the histological subtypes of the tumours; age at diagnosis; the patient’s gender; the tumour’s histological grade; non-silent mutations and copy number alteration frequency in each tumour across the altered genes. The key to the number coding of tumour location is 1; head, 2; body, 3; other, 4; tail. The number coding of histological diagnosis is 1; Pancreas-Adenocarcinoma-Other Subtype, 2; Pancreas-Colloid (mucinous non-cystic) Carcinoma, 3; Pancreatic Ductal Adenocarcinoma, 4; Discrepancy. (b) Mutual exclusivity of SMAD4 and CDKN2A mutations. (c) Gene alterations in the cell cycle pathways genes. (d) Gene alterations in the TGF-beta pathway genes.
Fig 5
Fig 5
Alterations in (a) Wnt pathway, (b) PI3K-mTOR pathway and (c) Notch pathway. The node represents the percentage of each gene mutation and copy number alterations of (left half) subtype-1 and (right half) of subtype-2 pancreatic tumours. The nodes are coloured according to the types of genes: Blue nodes for tumour suppressor genes and red for oncogenes. The interaction types are as given in the figure legend.

References

    1. Chang DK, Grimmond SM, Biankin A V. Pancreatic cancer genomics. Curr Opin Genet Dev 2014;24:74–81. doi: 10.1016/j.gde.2013.12.001 - DOI - PubMed
    1. Waddell N, Pajic M, Patch A-M, Chang DK, Kassahn KS, Bailey P, et al.. Whole genomes redefine the mutational landscape of pancreatic cancer. Nature 2015;518:495–501. doi: 10.1038/nature14169 - DOI - PMC - PubMed
    1. Bouvier AM, David M, Jooste V, Chauvenet M, Lepage C, Faivre J. Rising incidence of pancreatic cancer in France. Pancreas 2010;39:1243–6. doi: 10.1097/MPA.0b013e3181e1d5b3 - DOI - PubMed
    1. Wong MCS, Jiang JY, Liang M, Fang Y, Yeung MS, Sung JJY. Global temporal patterns of pancreatic cancer and association with socioeconomic development. Sci Rep 2017;7:1–9. doi: 10.1038/s41598-016-0028-x - DOI - PMC - PubMed
    1. Belpomme D, Irigaray P, Sasco AJ, Newby JA, Howard V, Clapp R, et al.. The growing incidence of cancer: Role of lifestyle and screening detection (Review). Int J Oncol 2007;30:1037–49. doi: 10.3892/ijo.30.5.1037 - DOI - PubMed