

Trends in wildlife rehabilitation rescues and animal fate across a six-year period in New South Wales, Australia
- PMID: 34506558
- PMCID: PMC8432793
- DOI: 10.1371/journal.pone.0257209
Trends in wildlife rehabilitation rescues and animal fate across a six-year period in New South Wales, Australia
Abstract
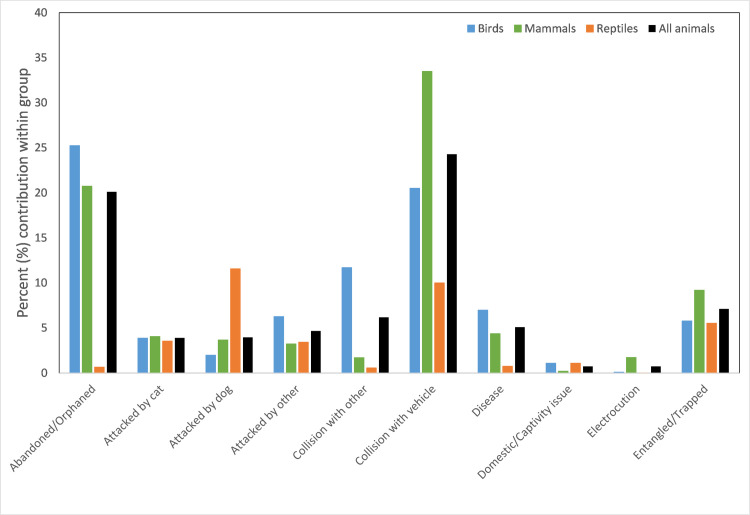
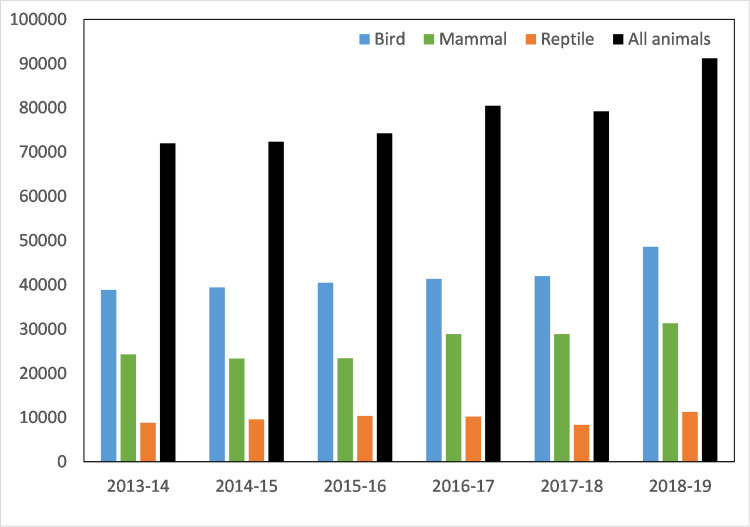
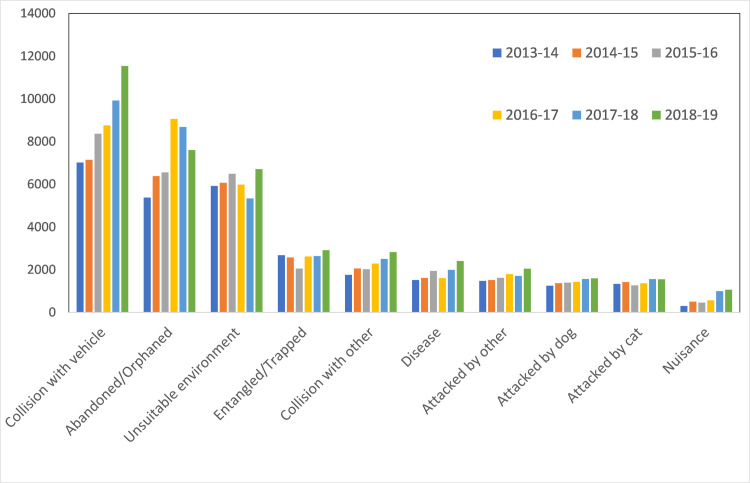
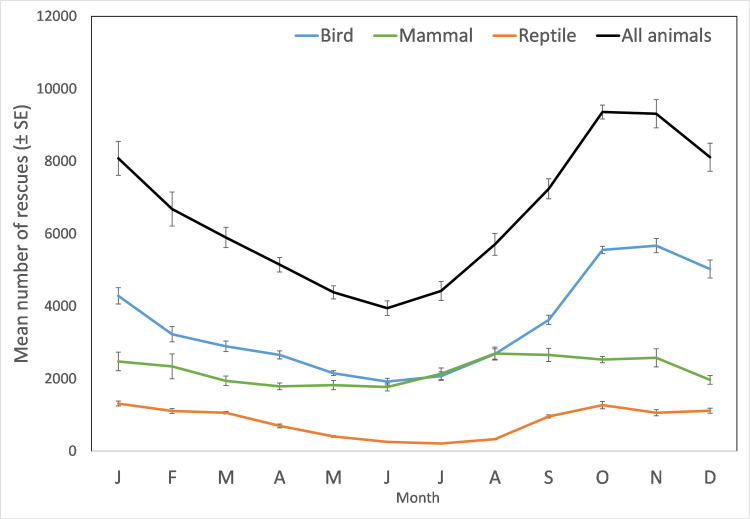
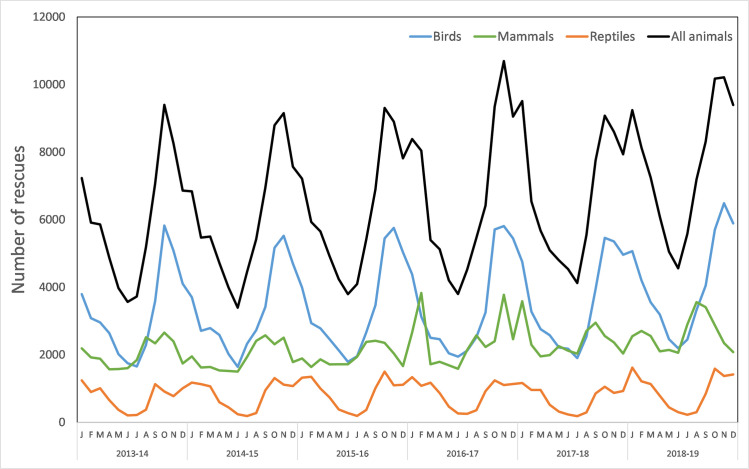
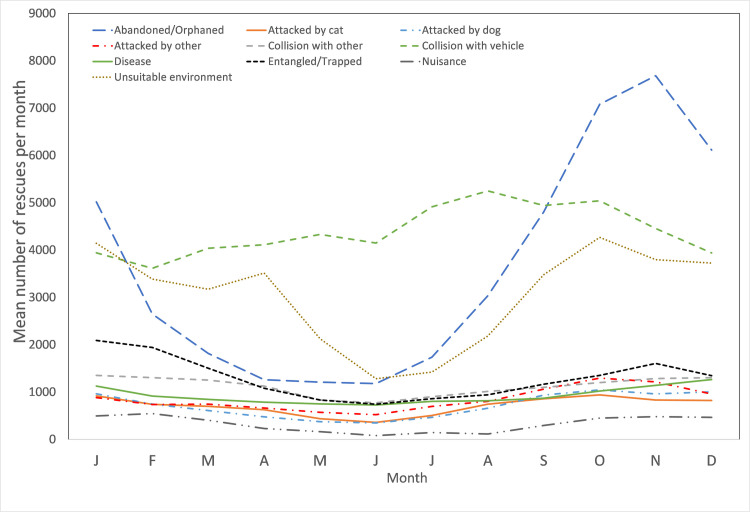
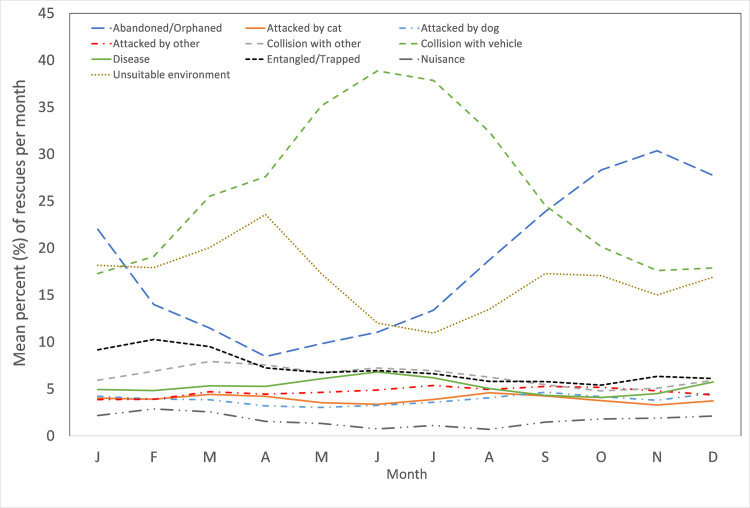
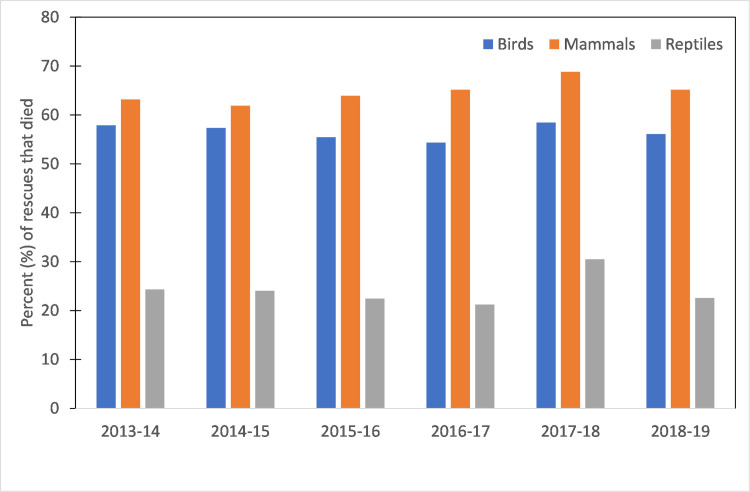
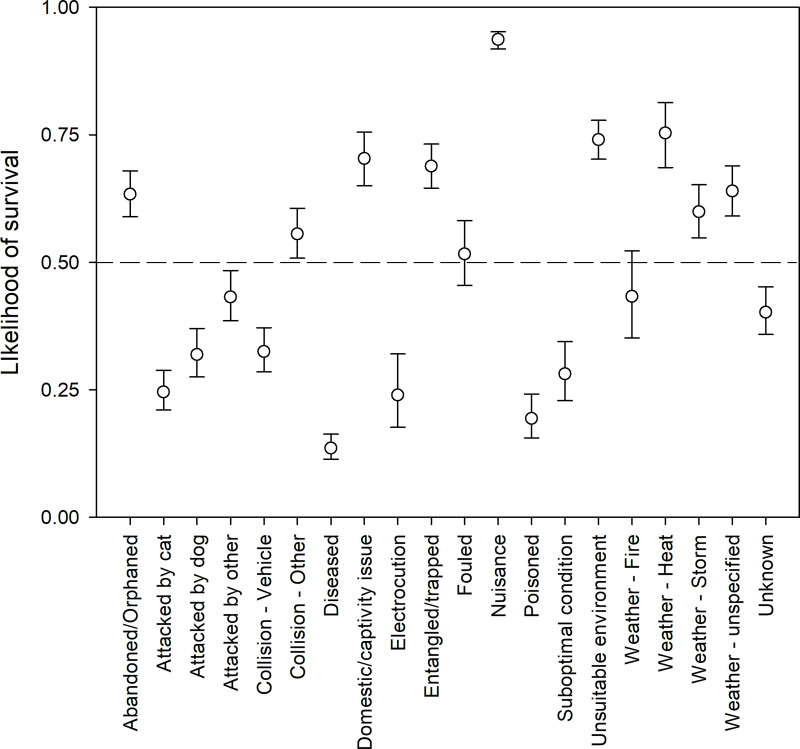
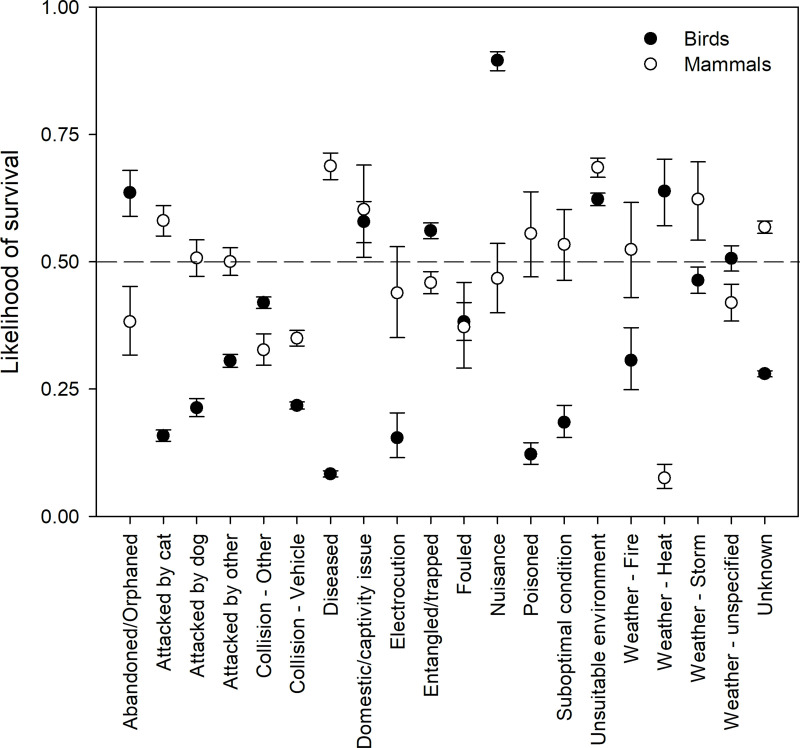
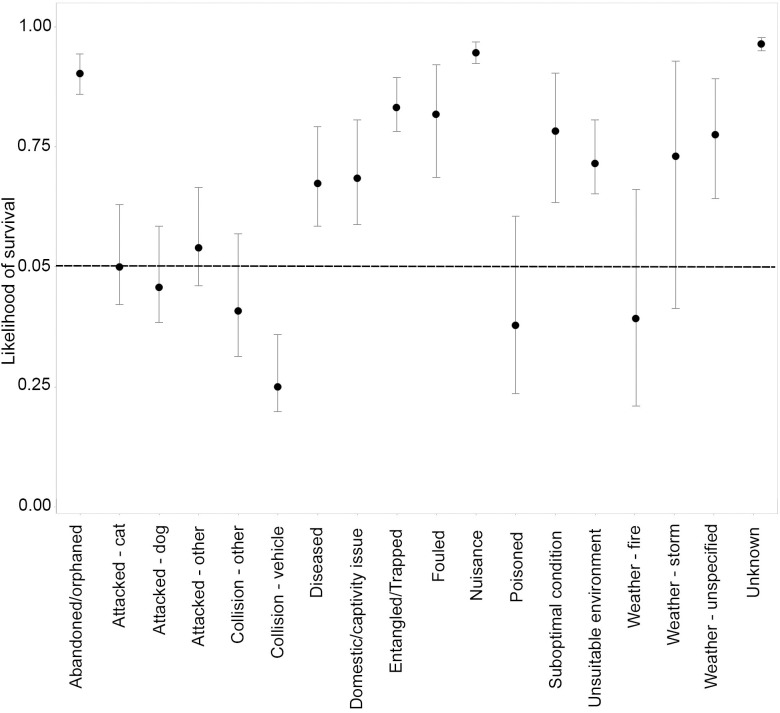
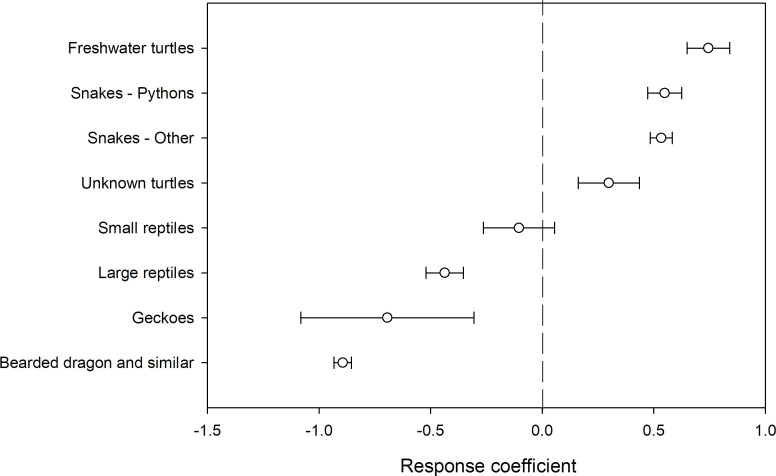
Globally, millions of animals are rescued and rehabilitated by wildlife carers each year. Information gathered in this process is useful for uncovering threats to native wildlife, particularly those from anthropogenic causes. However, few studies using rehabilitation data include a diverse range of fauna, cover large geographical areas, and consider long-term trends. Furthermore, few studies have statistically modelled causes of why animals come into care, and what are their chances of survival. This study draws on 469,553 rescues reported over six years by wildlife rehabilitators for 688 species of bird, reptile, and mammal from New South Wales, Australia. For birds and mammals, 'abandoned/orphaned' and 'collisions with vehicles' were the dominant causes for rescue, however for reptiles this was 'unsuitable environment'. Overall rescue numbers were lowest in winter, and highest in spring, with six-times more 'abandoned/orphaned' individuals in spring than winter. Of the 364,461 rescues for which the fate of an animal was known, 92% fell within two categories: 'dead', 'died or euthanased' (54.8% of rescues with known fate) and animals that recovered and were subsequently released (37.1% of rescues with known fate). Modelling of the fate of animals indicated that the likelihood of animal survival (i.e. chance of: being released, left and observed, or permanent care), was related to the cause for rescue. In general, causes for rescue involving physical trauma (collisions, attacks, etc.) had a much lower likelihood of animals surviving than other causes such as 'unsuitable environment', 'abandoned/orphaned', and this also showed some dependence upon whether the animal was a bird, reptile, or mammal. This suggests rehabilitation efforts could be focused on particular threats or taxa to maximise success, depending on the desired outcomes. The results illustrate the sheer volume of work undertaken by rehabilitation volunteers and professionals toward both animal welfare and to the improvement of wildlife rehabilitation in the future.
Conflict of interest statement
The authors have declared that no competing interests exist.
Figures
Similar articles
-
Interactions between reptiles and people: a perspective from wildlife rehabilitation records.R Soc Open Sci. 2024 Oct 2;11(10):240512. doi: 10.1098/rsos.240512. eCollection 2024 Oct. R Soc Open Sci. 2024. PMID: 39359468 Free PMC article.
-
Trends in Admissions and Outcomes at a British Wildlife Rehabilitation Centre over a Ten-Year Period (2012-2022).Animals (Basel). 2023 Dec 26;14(1):86. doi: 10.3390/ani14010086. Animals (Basel). 2023. PMID: 38200817 Free PMC article.
-
A systematic review of factors affecting wildlife survival during rehabilitation and release.PLoS One. 2022 Mar 17;17(3):e0265514. doi: 10.1371/journal.pone.0265514. eCollection 2022. PLoS One. 2022. PMID: 35298527 Free PMC article.
-
The impact of human activities on Australian wildlife.PLoS One. 2019 Jan 23;14(1):e0206958. doi: 10.1371/journal.pone.0206958. eCollection 2019. PLoS One. 2019. PMID: 30673712 Free PMC article.
-
A retrospective study of native wild birds and reptiles admitted to three New Zealand wildlife hospitals due to predation by cats.N Z Vet J. 2023 Mar;71(2):86-91. doi: 10.1080/00480169.2022.2152889. Epub 2023 Jan 9. N Z Vet J. 2023. PMID: 36444508 Review.
Cited by
-
Trends in Rescue and Rehabilitation of Marsupials Surviving the Australian 2019-2020 Bushfires.Animals (Basel). 2024 Mar 27;14(7):1019. doi: 10.3390/ani14071019. Animals (Basel). 2024. PMID: 38612258 Free PMC article.
-
Interactions between reptiles and people: a perspective from wildlife rehabilitation records.R Soc Open Sci. 2024 Oct 2;11(10):240512. doi: 10.1098/rsos.240512. eCollection 2024 Oct. R Soc Open Sci. 2024. PMID: 39359468 Free PMC article.
-
Common Causes for Veterinary Visits among Australian Wildlife.Animals (Basel). 2024 Sep 13;14(18):2662. doi: 10.3390/ani14182662. Animals (Basel). 2024. PMID: 39335252 Free PMC article.
-
Outcomes for an arboreal folivore after rehabilitation and implications for management.Sci Rep. 2023 Apr 21;13(1):6542. doi: 10.1038/s41598-023-33535-y. Sci Rep. 2023. PMID: 37085564 Free PMC article.
-
Validation of an Enzyme Immunoassay to Measure Faecal Glucocorticoid Metabolites in Common Brushtail Possums (Trichosurus vulpecula) to Evaluate Responses to Rehabilitation.Animals (Basel). 2022 Jun 24;12(13):1627. doi: 10.3390/ani12131627. Animals (Basel). 2022. PMID: 35804526 Free PMC article.
References
-
- Heathcote G, Hobday A, Spaulding M, Gard M, Irons G. Citizen reporting of wildlife interactions can improve impact-reduction programs and support wildlife carers. Wildlife Research. 2019; 46(5):415–28.
-
- Hanger J, Tribe A. Management of critically ill wildlife: The reality and practice of wildlife euthanasia. National Wildlife Rehabilitation Conference, 2005. Gold Coast, Australia.
-
- NSW Department of Planning, Industry and Environment. NSW Volunteer Wildlife Rehabilitation Sector Strategy 2020–2023.2020; https://www.environment.nsw.gov.au/-/media/OEH/Corporate-Site/Documents/....
-
- Haering R, Wilson V, Zhuo A, Stathis P. Towards a more effective model of wildlife care and rehabilitation: A survey of volunteers in New South Wales, Australia. Australian Zoologist. 2020; 40(4):605–27.
MeSH terms
LinkOut - more resources
Full Text Sources
Medical
