. 2021 Nov 3;109(21):3456-3472.e8.
doi: 10.1016/j.neuron.2021.08.011. Epub 2021 Sep 9.

Oligodendrocytes enhance axonal energy metabolism by deacetylation of mitochondrial proteins through transcellular delivery of SIRT2

Affiliations

Oligodendrocytes enhance axonal energy metabolism by deacetylation of mitochondrial proteins through transcellular delivery of SIRT2

Kelly A Chamberlain et al. Neuron. .

Abstract

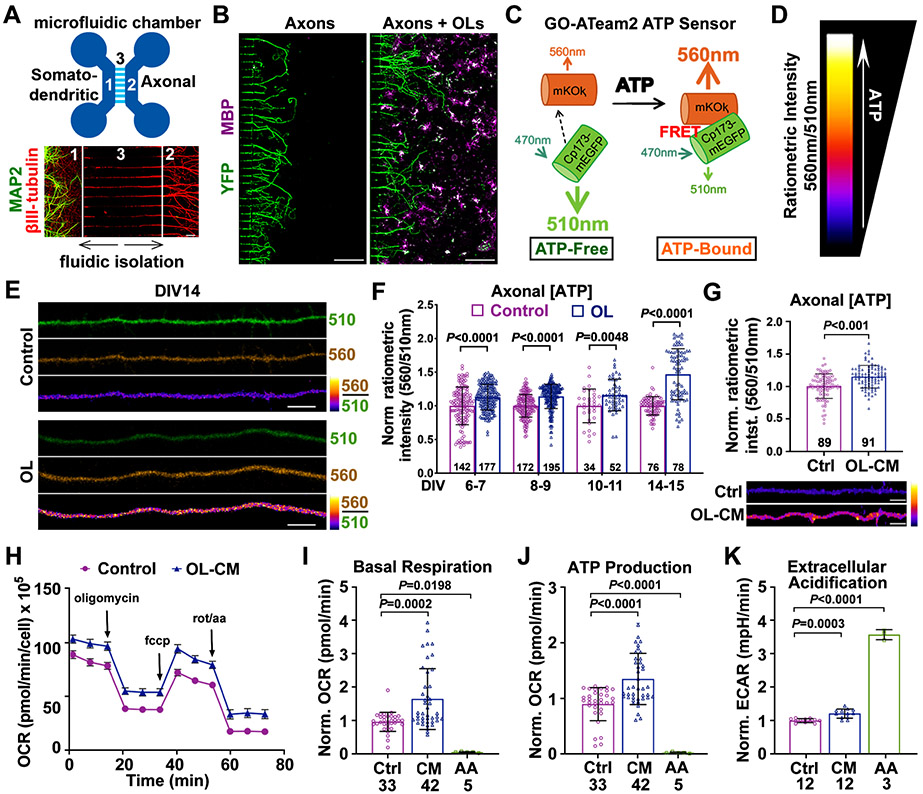
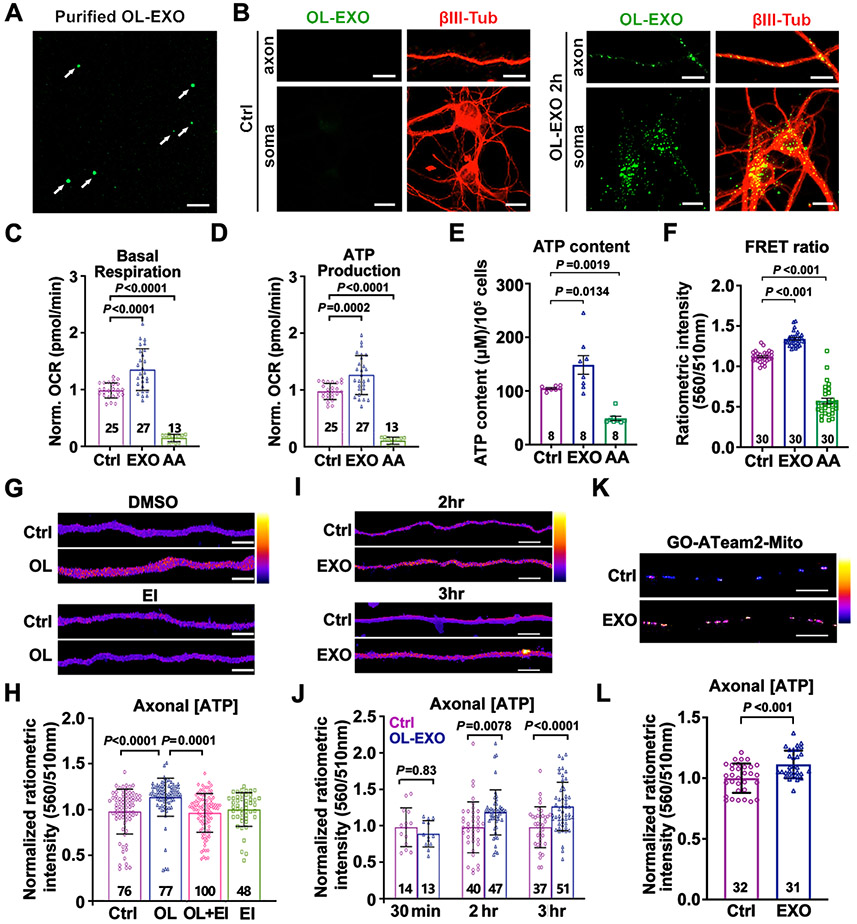
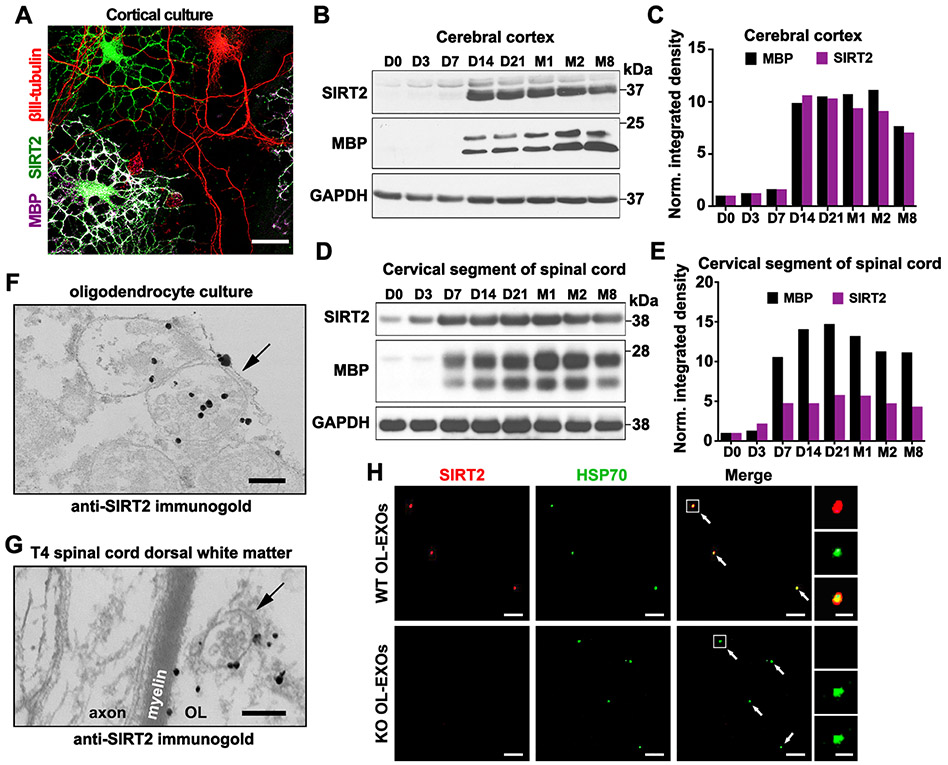
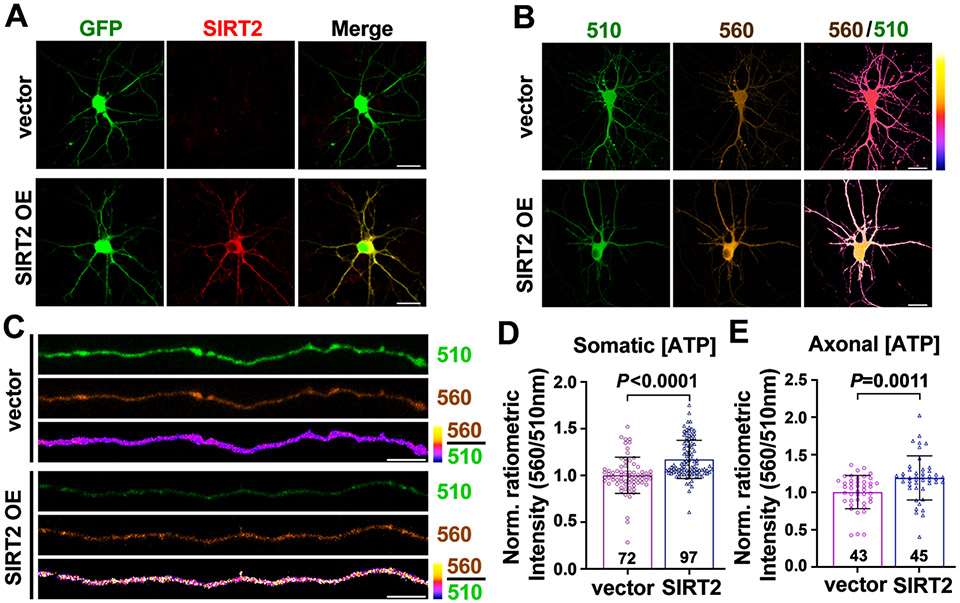
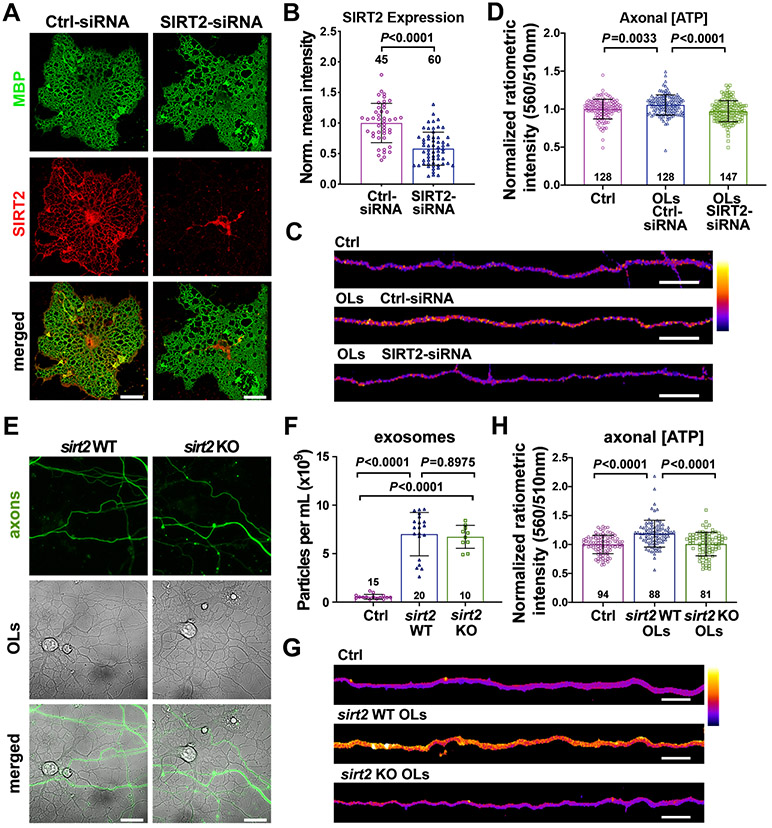
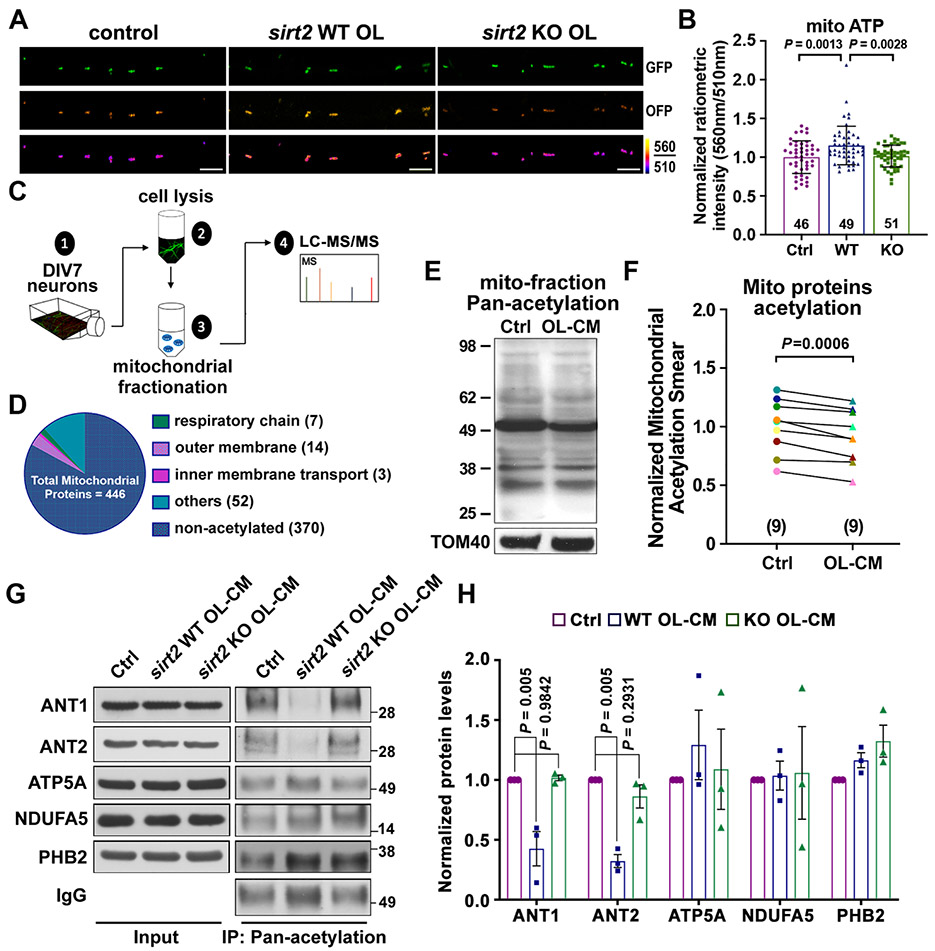
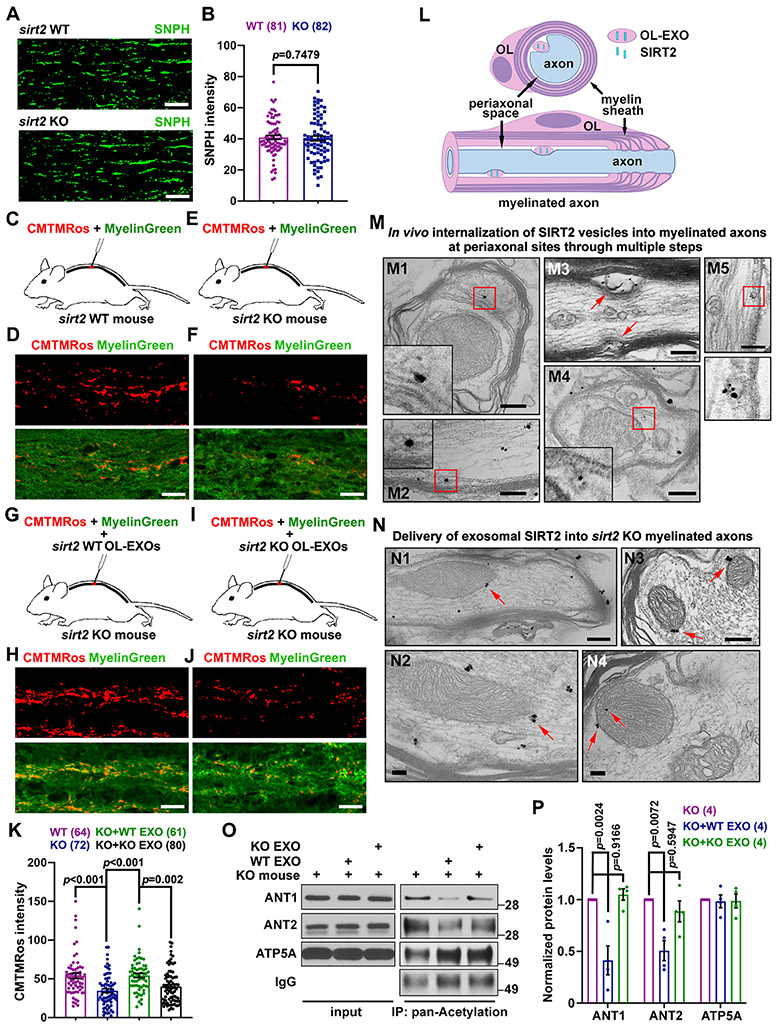
Neurons require mechanisms to maintain ATP homeostasis in axons, which are highly vulnerable to bioenergetic failure. Here, we elucidate a transcellular signaling mechanism by which oligodendrocytes support axonal energy metabolism via transcellular delivery of NAD-dependent deacetylase SIRT2. SIRT2 is undetectable in neurons but enriched in oligodendrocytes and released within exosomes. By deleting sirt2, knocking down SIRT2, or blocking exosome release, we demonstrate that transcellular delivery of SIRT2 is critical for axonal energy enhancement. Mass spectrometry and acetylation analyses indicate that neurons treated with oligodendrocyte-conditioned media from WT, but not sirt2-knockout, mice exhibit strong deacetylation of mitochondrial adenine nucleotide translocases 1 and 2 (ANT1/2). In vivo delivery of SIRT2-filled exosomes into myelinated axons rescues mitochondrial integrity in sirt2-knockout mouse spinal cords. Thus, our study reveals an oligodendrocyte-to-axon delivery of SIRT2, which enhances ATP production by deacetylating mitochondrial proteins, providing a target for boosting axonal bioenergetic metabolism in neurological disorders.

Keywords: acetylation; adenine nucleotide translocases 1 and 2; axonal ATP; axonal energetics; axonal mitochondria; energy metabolism; exosome; myelin; oligodendrocyte; sirtuin 2.


Conflict of interest statement

Declaration of interests The authors declare no competing interests.

Figures

Figure 1.
Figure 1.. OLs Enhance Axonal Energetics with Neuron Maturation
(A) Microfluidic devices separate the somatodendritic chamber (1) from the axonal chamber (2) by the microgroove region (450 μm long) (3). Immunostaining of DIV7 cortical neurons reveals that MAP2-labeled somas/dendrites (green) are restricted to the somatodendritic chamber, while axons labeled with βIII-tubulin (red) extend into axonal chamber. (B) Immunostaining of axonal chambers culturing YFP-labeled axons alone and co-culturing axons and MBP-labeled OLs (magenta). Cells were fixed for immunostaining at DIV7. (C, D) Schematic diagram of the GO-ATeam2 ATP sensor (C) and heatmap index (D) depicting ratiometric GO-ATeam2 signal intensity. (E, F) Images (E) and quantification (F) showing that axons co-cultured with OLs exhibit increased ATP levels compared to axons cultured alone (control). (G) Quantification of axonal ATP levels (upper) and images (lower) showing that DIV8-11 axons treated with OL-CM for 24 hours exhibit higher ATP levels compared to axon control (Ctrl). (H) OCR traces during a single Seahorse Extracellular Flux experiment. DIV8 neurons were treated with control media or OL-CM for 24 hours, followed by sequential injections of oligomycin (1μM), FCCP (1.5μM), and Rotenone/AA (0.5μM). (I-K) Quantification of mitochondrial stress tests revealing that neurons treated with OL-CM exhibit increased basal respiration (I), ATP production (J), and extracellular acidification rate (ECAR, K). Data were quantified from the total number of axons (F, G) or neuronal wells (I-K) indicated within bars (F, G) or under bars (I-K) from more than three biological replicates and expressed as mean ± SD. Statistical analyses were performed using a two-way ANOVA test with Sidak’s multiple comparisons test (F), an unpaired Student’s t-test (G), or a one-way ANOVA test with Tukey’s multiple comparisons test (I-K). Scale bars, 50 μm (A), 200 μm (B), 5 μm (E, G). See also Figures S1 and S2.
Figure 2.
Figure 2.. OL-EXOs Are Internalized into Neurons and Enhance Axonal Mitochondrial Energetics
(A, B) Imaging of ExoGlow-labeled OL-EXOs (arrows, A) and their uptake by cultured neurons (B). ExoGlow-OL-EXOs (green) were incubated with cortical neurons at DIV8 for 2 hours, followed by immunostaining of βIII-tubulin (red). (C, D) Neurons treated with OL-EXOs exhibit increased basal respiration (C) and ATP production (D). As a negative control, mitochondrial respiration was blocked by AA (100 nM, 24 hours). (E, F) Analyses of ATP content (E, μM/105 cells) using luciferase-based assay and FRET-based ATP sensor (F) in DIV8 neurons cultured with OL-EXOs for 24 hours. (G, H) Heatmap images (G) and quantification (H) of normalized axonal ATP levels in DIV8 axons cultured alone (Ctrl), co-cultured with OLs, co-cultured with OLs in the presence of exosome inhibitor GW4869 (EI, 1 μM) (OL+EI), or cultured in the presence of EI alone. (I, J) Heatmap images (I) and quantification (J) of normalized axonal ATP levels in DIV8 axons treated with control media (Ctrl) or purified OL-EXOs (EXO) for the time indicated. Data were collected from five biological replicates. (K, L) Images (K) and quantification (L) of mitochondrial ATP levels within the inner mitochondrial matrix using mitochondria-targeted ATP sensor GO-ATeam2-Mito. DIV8 neuronal axons were incubated with OL-EXOs for 24 hours. Data were quantified from the total number of neuronal wells (C-E) or the total number of neuron (F) or axon images (H, J, L) indicated within or above bars from more than three biological replicates and expressed as mean ± SD. Statistical analyses were performed using a one-way ANOVA test with Tukey’s multiple comparisons test (C, D, H) or Dunnett’s multiple comparisons test (E, F), a two-way ANOVA test with Sidak’s multiple comparisons test (J), or an unpaired Student’s t-test (L). Scale bars, 10 μm (A, B, K), 5 μm (G, I). See also Figures S3 and S4.
Figure 3.
Figure 3.. SIRT2 Is Undetectable in Neurons but Enriched in OLs and Released within Exosomes
(A) Selective expression of SIRT2 in OLs but not in neurons. Mouse cortical cells at DIV7-8 were co-immunostained for SIRT2 (green), myelin basic protein (MBP, magenta), and neuron-specific βIII-tubulin (red). (B, C) Immunoblots (B) and bar graph (C) showing development-associated expression of SIRT2 and MBP in mouse brain cortex. Brain cortical tissues were isolated from mice at indicated postnatal days (D) or months (M) of age. 10-μg homogenates were loaded and immunoblotted with the indicated antibodies (n = 2). (D, E) Immunoblots (D) and bar graph (E) showing development-associated expression of SIRT2 and MBP in mouse cervical spinal cords. 10-μg homogenates were loaded and immunoblotted with the indicated antibodies (n = 2). (F, G) Immunogold electron micrographs showing SIRT2-labeled MVBs (arrows) in both in vitro and in vivo OLs. Cultured primary OLs at DIV5 (F) or mouse T4 spinal cord dorsal white matter (G) were labeled by anti-SIRT2 immunogold particles. Note a SIRT2-containing MVB in the adjacent myelin sheath (G). (H) SIRT2-filled exosomes are released from WT but not sirt2 KO OLs. Purified OL-EXOs were co-immunostained with antibodies against SIRT2 (red) and exosome marker HSP70 (green). Right panels show an enlarged exosome. Scale bars, 25 μm (A), 200 nm (F, G), 5 μm (H) and 500 nm (H, enlarged boxes). See also Figure S5.
Figure 4.
Figure 4.. Elevated SIRT2 Expression in Neurons Increases ATP Production
(A) Images showing exogenous expression of SIRT2 (red) in cortical neurons at DIV7. Neurons were co-transfected with GFP and Flag-tag (vector) or SIRT2-Flag at DIV4. Note that SIRT2 is undetectable in control neurons but overexpressed in SIRT2-transfected neurons (SIRT2 OE). (B-E) Representative images and quantification showing relative ATP levels in neuronal somas (B, D) and axons (C, E) in DIV7-8 neurons co-transfected with GO-ATeam2 and Flag-tag (vector) or SIRT2-Flag at DIV4. Data were quantified from the total number of somas (D) or axons (E) indicated in the bars from three biological replicates and expressed as mean ± SD. Statistical analyses were performed using an unpaired Student’s t-test. Scale bars, 20 μm (A, B), 5 μm (C).
Figure 5.
Figure 5.. SIRT2-Deficient OLs Abrogates Axonal ATP Increase
(A, B) Images (A) and quantification (B) showing relative SIRT2 expression in DIV4 OLs transfected with Ctrl-siRNA or SIRT2-siRNA for 72 hours. Intensity of SIRT2 immunolabeling (red) was normalized to MBP (green). (C, D) Heatmap images (C) and quantification (D) of normalized ATP levels from DIV7-8 axons cultured alone (Ctrl), co-cultured with OLs transfected with Ctrl-siRNA or SIRT2-siRNA. (E) Representative DIC images demonstrating that sirt2 WT and KO OLs are morphologically similar, grow extensively in the axonal compartment, and make contacts with axons (green). (F) Particles per milliliter (ml) detected during Nanosight tracking analysis (NTA) of exosomes purified from WT and sirt2 KO OLs cultured at the same density. Note that OLs release similar exosomes per ml regardless of sirt2 deletion. (G, H) Heatmap images (G) and quantification (H) of normalized ATP levels from DIV7-10 axons cultured alone (Ctrl), co-cultured with WT or sirt2 KO OLs. Data were quantified from the total number of cells (B), axons (D, H), or Nanosight recordings (F) indicated in or above bars from two (B) or three (D, F, H) biological replicates and expressed as mean ± SD. Statistical analyses were performed using an unpaired Student’s t-test (B) or a one-way ANOVA test with Tukey’s multiple comparisons test (D, F, H). Scale bars, 20 μm (A), 10 μm (C), 25 μm (E), 5 μm (G). See also Figure S5.
Figure 6.
Figure 6.. SIRT2 Regulates Axonal Energetics by Deacetylation of Mitochondrial Proteins
(A, B) Images (A) and quantification (B) of the mitochondrial-targeted ATP sensor GO-ATeam2-Mito, reflecting ATP levels in the inner mitochondrial matrix, in DIV8 neuronal axons cultured alone (Ctrl), co-cultured with WT or sirt2 KO OLs. (C) Experimental workflow depicting mitochondrial fractionation from DIV7 cortical neurons for detection of acetylated peptides via mass spectrometry (MS). (D) Graphical depiction of MS revealing the categorization of a total of 446 mitochondrial proteins detected. (E, F) Immunoblot (E) and normalized ratios of acetylation signal (F) showing a reduced acetylation of mitochondrial proteins in neurons treated with OL-CM for 24 hours. Mitochondria were prepared by fractionation and acetylated proteins were detected with an anti-Pan-acetylation antibody. Acetylated signal was calibrated with TOM40 levels and normalized to neurons treated with control media (n = 9). (G, H) Immunoblots (G) and quantification (H) of acetylation assay of 5 mitochondrial proteins as indicated. Neurons at DIV8 were treated with control media (Ctrl), or OL-CM derived from WT or sirt2 KO mice for 24 hours, then lysed and incubated with Acetyl-Lysine affinity beads and analyzed by immunoblots with the indicated antibodies. The protein of interest was normalized to IgG level and subsequently normalized to control group (n = 3). Note that acetylation levels of ANT1 and ANT2 are largely reduced by OL-derived SIRT2. Data were quantified from the total number of axons (B) indicated in bars and statistical analysis was performed on data collected from three or nine biological replicates using paired Student’s t-test (F) or one-way ANOVA test with Tukey’s multiple comparisons test (B, H). Scale bars: 5 μm. See also Figure S6 and Table S1.
Figure 7.
Figure 7.. In vivo Delivery of WT but not sirt2 KO OL-EXOs Increases Axonal Mitochondrial Integrity in sirt2 KO Mouse Spinal Cord by Deacetylating ANT1/2
(A, B) Representative images (A) and quantitative analysis (B) showing similar density of axonal mitochondria labeled by SNPH in spinal cord dorsal white matter of WT and sirt2 KO mice (P = 0.7479, n = 81 or 82 images from 5 pairs of mice at P60-70). (C-F, K) Schematic injection of the dye cocktail (mitochondrial potential dye CMTMRos and Myelin Green, C, E), representative images of myelinated axons (D, F), and quantification (K) showing relative mitochondrial membrane potential in spinal cord dorsal white matter of WT and sirt2 KO mice at P60-70. Note that axonal mitochondrial integrity, reflected by CMTMRos intensity, significantly declines in the spinal cord dorsal white matter of sirt2 KO mice compared to WT mice (P < 0.001, n > 60 images from 6 pairs of mice) (K). (G-J, K) Schematic co-injection of the dye cocktail and purified OL-EXOs (G, I), representative images of myelinated axons (H, J), and quantification (K) showing rescued mitochondrial membrane potential in sirt2 KO spinal cord dorsal white matter by in vivo delivery of purified exosomes released from WT, but not from sirt2 KO, mouse OLs. (L, M) Schematic (L) and representative immunoelectron micrographs (M) showing SIRT2-labeled vesicles readily detected at periaxonal sites in myelinated axons of spinal cord dorsal white matter from WT mouse. Insets depict enlarged views of the boxed areas. M1: a SIRT2-labeled MVB targets the inner OL adaxonal cytoplasmic loop in close proximity to the axon; M2, M3: SIRT2-labeled exosomes contact the axonal surface within the periaxonal space; M4, M5: SIRT2 vesicles undergo internalization into axons. (N) Representative immunoelectron micrographs showing delivery of exosomal SIRT2 into sirt2 KO myelinated axons of spinal cord dorsal white matter following injection of WT OL-EXOs. Arrows point to mitochondrial targeted SIRT2. (O, P) Representative immunoblots (O) and quantification (P) of in vivo acetylation assay of mitochondrial proteins in sirt2 KO mouse spinal cord dorsal white matter after injection of OL-EXOs released from WT or sirt2 KO mice. The white matter-enriched area around the injection site was collected and lysed, mixed with Acetyl-Lysine affinity beads, and then analyzed by immunoblot with the indicated antibodies. Protein levels were normalized to those in non-injected sirt2 KO group. Note that acetylation levels of ANT1 and ANT2 were decreased by injection of WT OL-EXOs, but not sirt2 KO OL-EXOs (n = 4 mouse replicates). Data were quantified from the total number of images indicated under the bar graphs, expressed as mean ± SEM, and analyzed by an unpaired Student’s t-test (B) or one-way ANOVA test with Tukey’s multiple comparisons test (K, P). Scale bars, 10 μm (A, D, F, H, J); 200 nm (M, N). See also Figure S7.

Comment in

References

    1. Anderson KA, and Hirschey MD (2012). Mitochondrial protein acetylation regulates metabolism. Essays Biochem 52, 23–35. - PMC - PubMed
    1. Azevedo FA, Carvalho LR, Grinberg LT, Farfel JM, Ferretti RE, Leite RE, Jacob Filho W, Lent R, and Herculano-Houzel S (2009). Equal numbers of neuronal and nonneuronal cells make the human brain an isometrically scaled-up primate brain. J Comp Neurol 513, 532–541. - PubMed
    1. Baeza J, Smallegan MJ, and Denu JM (2016). Mechanisms and Dynamics of Protein Acetylation in Mitochondria. Trends Biochem Sci 41, 231–244. - PMC - PubMed
    1. Black JA, and Waxman SG (1988). The perinodal astrocyte. Glia 1, 169–183. - PubMed
    1. Budnik V, Ruiz-Canada C, and Wendler F (2016). Extracellular vesicles round off communication in the nervous system. Nat Rev Neurosci 17, 160–172. - PMC - PubMed

Publication types

LinkOut - more resources