. 2021 Sep 24;13(4):10.1088/1758-5090/ac25cc.
doi: 10.1088/1758-5090/ac25cc.

A biofabrication method to align cells within bioprinted photocrosslinkable and cell-degradable hydrogel constructs via embedded fibers

Affiliations

A biofabrication method to align cells within bioprinted photocrosslinkable and cell-degradable hydrogel constructs via embedded fibers

Margaret E Prendergast et al. Biofabrication. .

Abstract

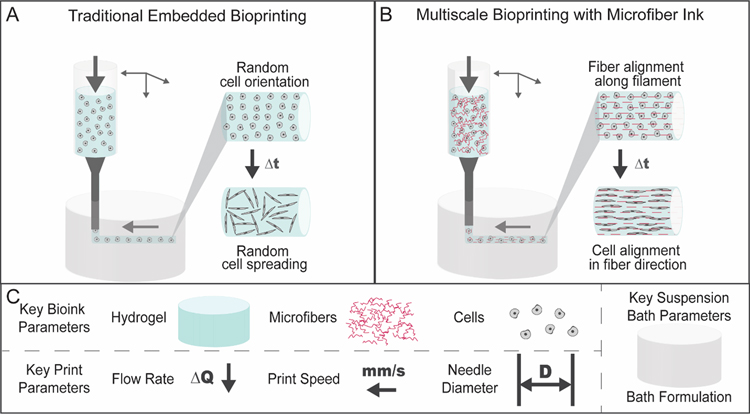
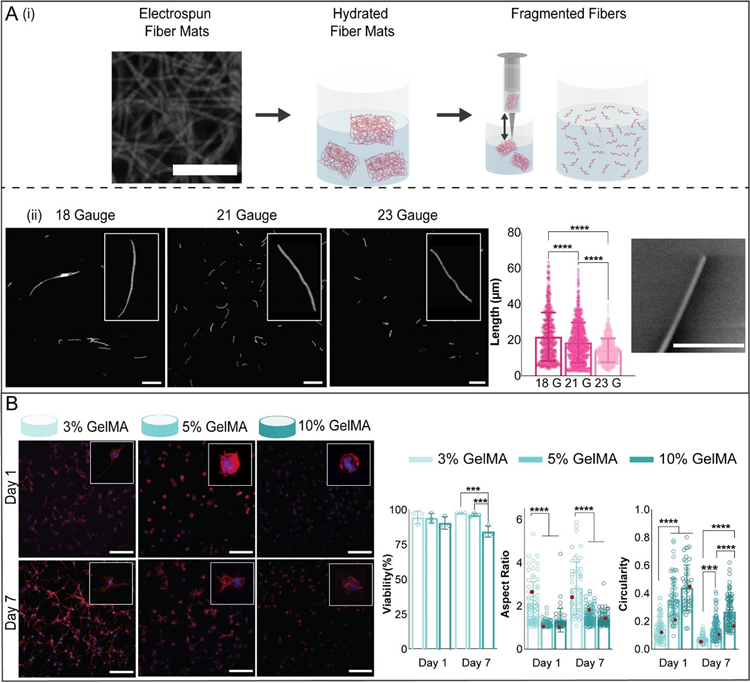
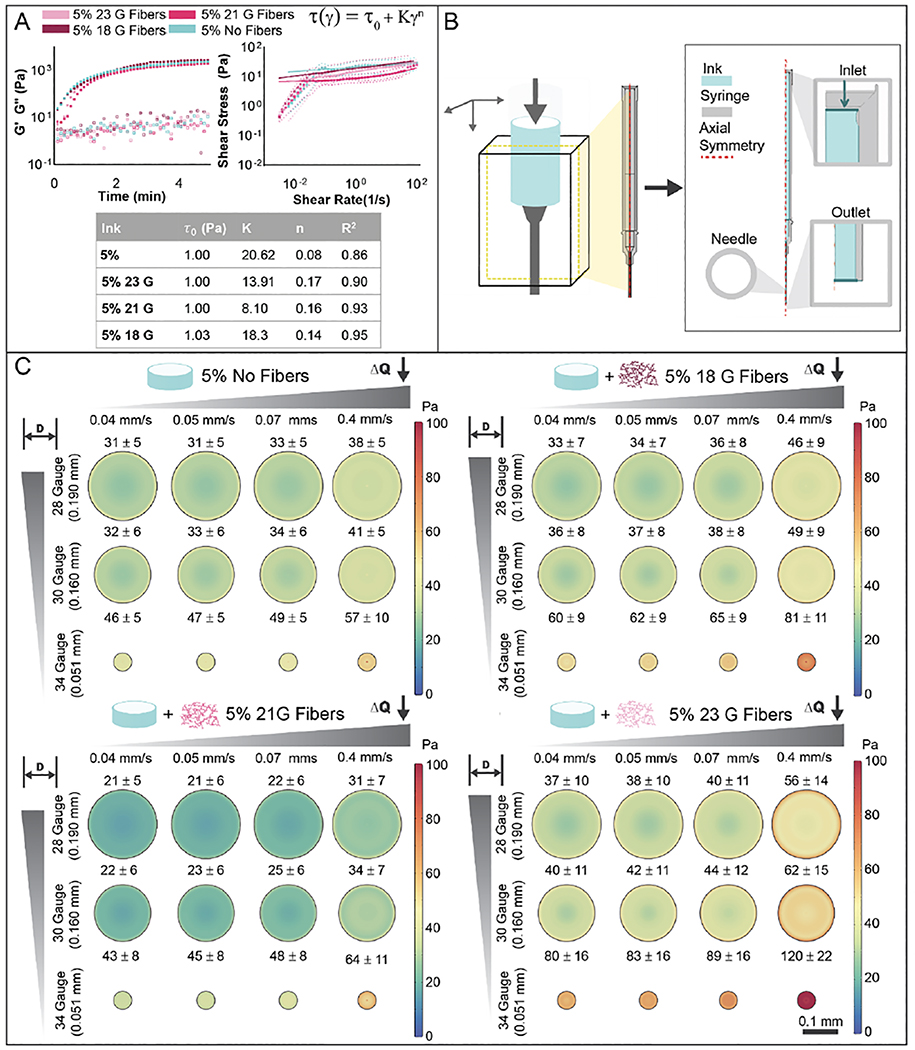
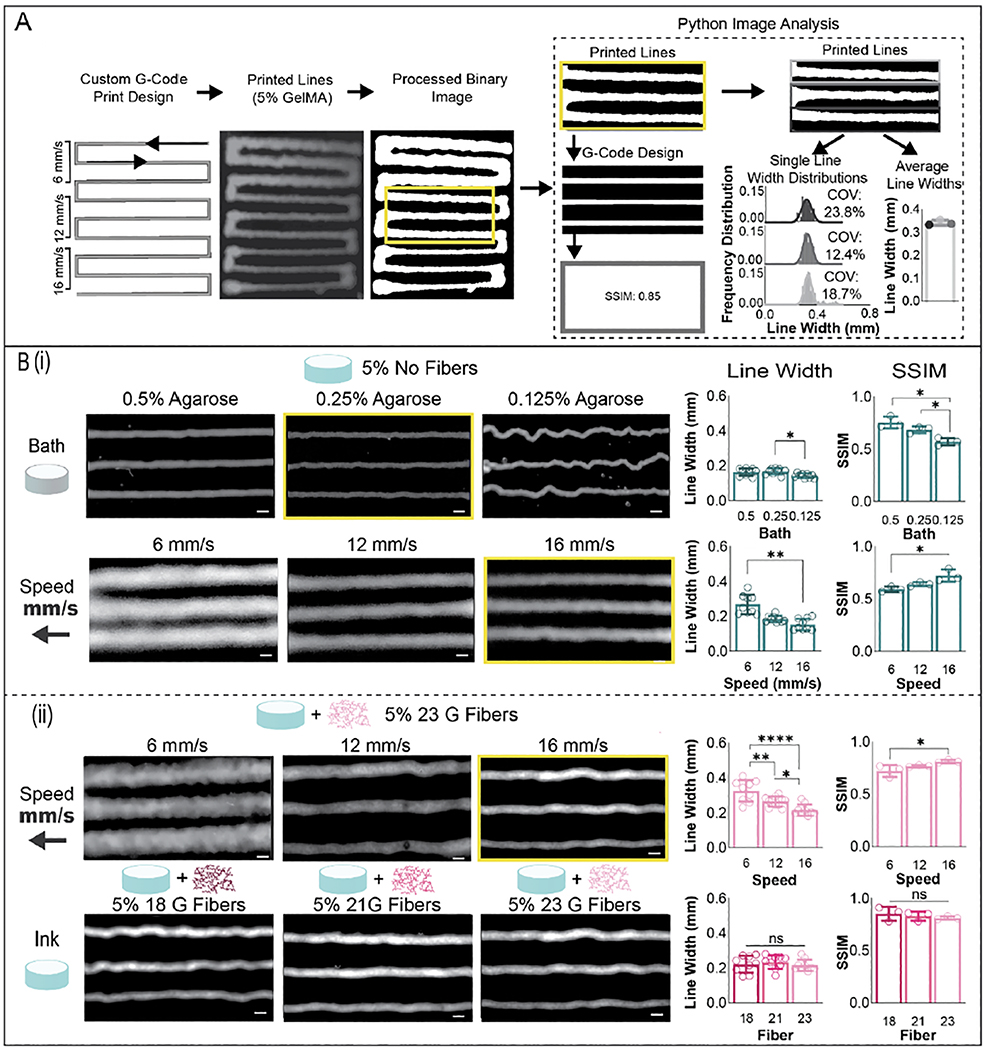
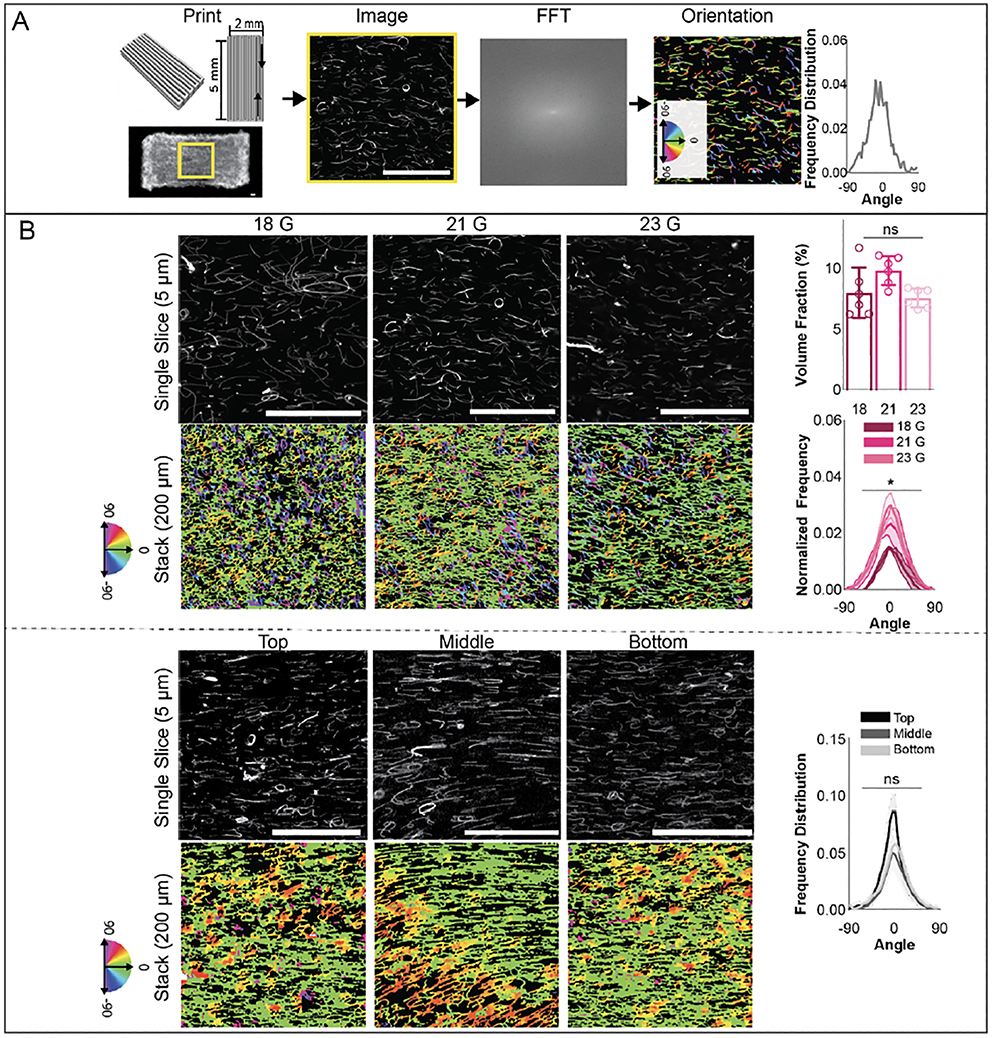
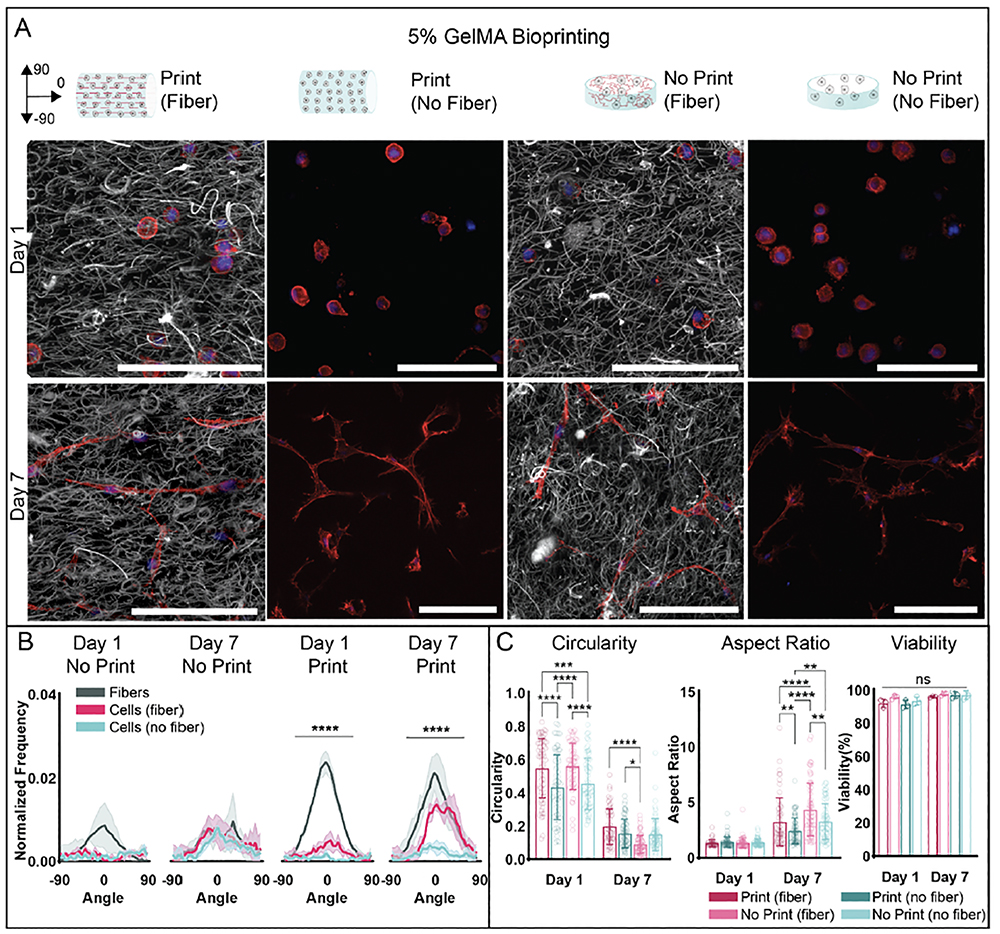
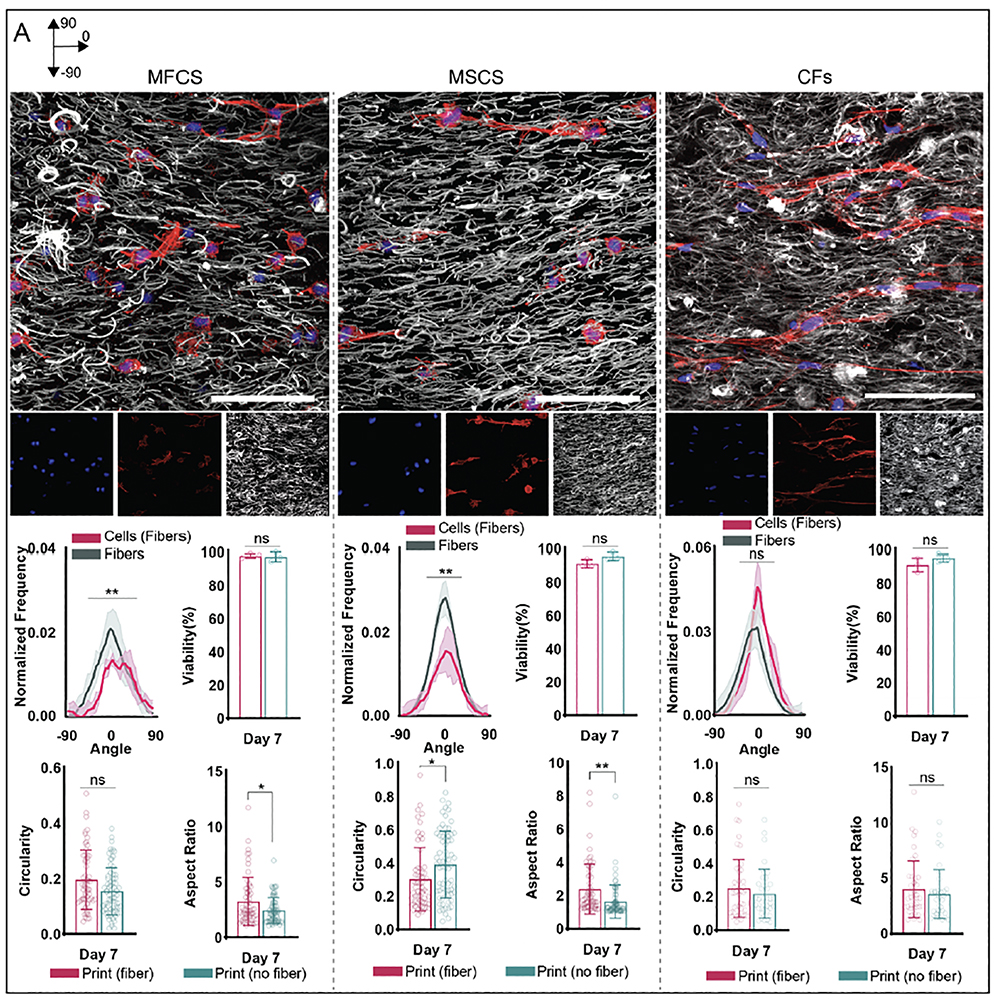
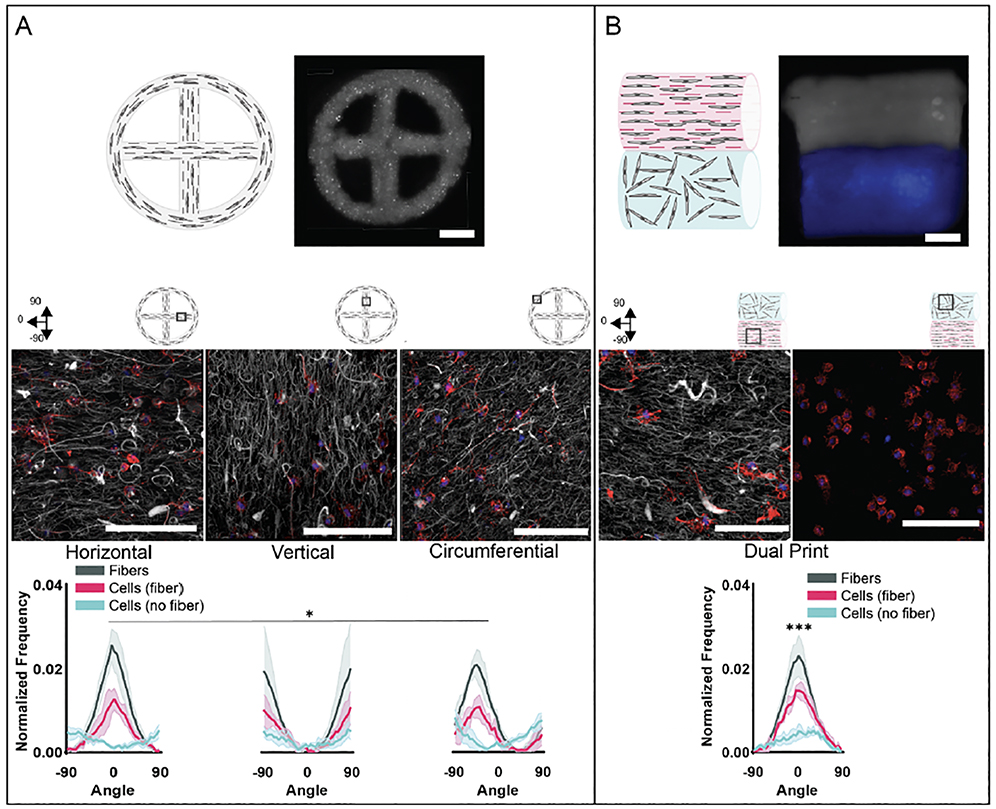
The extracellular matrix (ECM) is composed of biochemical and biophysical cues that control cell behaviors and bulk mechanical properties. For example, anisotropy of the ECM and cell alignment are essential in the directional properties of tissues such as myocardium, tendon, and the knee meniscus. Technologies are needed to introduce anisotropic behavior into biomaterial constructs that can be used for the engineering of tissues as models and towards translational therapies. To address this, we developed an approach to align hydrogel fibers within cell-degradable bioink filaments with extrusion printing, where shear stresses during printing align fibers and photocrosslinking stabilizes the fiber orientation. Suspensions of hydrogel fibers were produced through the mechanical fragmentation of electrospun scaffolds of norbornene-modified hyaluronic acid, which were then encapsulated with meniscal fibrochondrocytes, mesenchymal stromal cells, or cardiac fibroblasts within gelatin-methacrylamide bioinks during extrusion printing into agarose suspension baths. Bioprinting parameters such as the needle diameter and the bioink flow rate influenced shear profiles, whereas the suspension bath properties and needle translation speed influenced filament diameters and uniformity. When optimized, filaments were formed with high levels of fiber alignment, which resulted in directional cell spreading during culture over one week. Controls that included bioprinted filaments without fibers or non-printed hydrogels of the same compositions either with or without fibers resulted in random cell spreading during culture. Further, constructs were printed with variable fiber and resulting cell alignment by varying print direction or using multi-material printing with and without fibers. This biofabrication technology advances our ability to fabricate constructs containing aligned cells towards tissue repair and the development of physiological tissue models.

Keywords: alignment; anisotropy; bioprinting; fibers; hydrogel.


Figures

Figure 1.
Figure 1.
Schematic of embedded bioprinting processes. (A) Traditional embedded bioprinting where a bioink is extruded from a printer into a suspension bath. If a cell-degradable material is used as a bioink, cells may spread in a random orientation within printed filaments. (B) In multiscale bioprinting with a microfiber bioink, microfibers within the bioink align in the direction of the printed filament during printing in a suspension bath. If a cell-degradable material is used as a bioink, cells may spread with alignment in the direction of printed filaments. (C) A variety of factors may influence bioink printability and impact microfiber alignment during printing, including key bioink parameters (hydrogel, microfibers, cells), key print parameters (flow rate, print speed, needle diameter), and key suspension bath parameters (suspension bath formulation).
Figure 2.
Figure 2.
Microfiber and hydrogel formulations. (A) (i) To fabricate microfibers, electrospun norbornene-HA (NorHA) fiber mats (scale bar 10 μm) were crosslinked, hydrated, sectioned into pieces, and fragmented into microfibers by repeatedly passing through a needle. (ii) Fiber length was varied by varying the needle gauge used to shear fibers. Representative images of suspensions of fragmented fibers for three different needle gauges are shown (left, scale bar 0.1 mm, along with quantification of fiber length (middle) and an SEM image showing the end of a fragmented fiber (right, scale bar 2 μm, mean ± s.d., one-way ANOVA with Tukey post hoc, ****p ≤ 0.0001). (B) Representative images of meniscal fibrochondrocytes (MFCs) stained for F-actin (red) and cell nuclei (blue) (200 μm z-stacks, scale bars 0.1 mm) after culture in 3, 5, and 10% GelMA hydrogels for 1 and 7 days. Quantification of MFC viability (analyzed with live-dead staining), aspect ratio, and circularity after 1 and 7 days of culture (3% GelMA: n= 52 (Day 1), 68 (Day 7) cells; 5% GelMA: n= 64 (Day 1), 86 (Day 7) cells; 10% GelMA: n= 46 (Day 1), 89 (Day 7) cells; 3 biologically independent experiments, mean ± s.d., two-way ANOVA with Bonferroni post hoc ****p ≤ 0.0001, ***p ≤ 0.001, red dots indicate measurements for magnified images).
Figure 3.
Figure 3.
Bioink rheology and shear during extrusion. (A) Rheological characterization of bioinks (5% GelMA, with 18, 21, 23 gauge fibers or no fibers), including photorheology (1 Hz, 1% strain, storage (G’) and loss (G”) moduli) during photocrosslinking with visible light (400–500 nm, 10 mW/cm2) and shear stress with increasing shear rate (0 – 100 s−1). The data was fit to Herschel-Bulkley model and parameters are shown in the table. (B) Representative illustration of the fluid dynamics model used to calculate theoretical shear stresses and flow during printing from a syringe with a needle. Due to geometrical symmetry of the printing syringe and needle, a simplified 2D model was used for calculations. (C) Theoretical calculations of shear stress across needle profiles for various needle diameters and flow rates, shown for 5% no fiber (top left), 5% 18 gauge fibers (top right), 5% 21 gauge fibers (bottom left), and 5% 23 gauge fibers (bottom right) bioinks.
Figure 4.
Figure 4.
Bioink printing parameters for fiber alignment. (A) Method for analyzing printed line widths. Custom gcode files were created to print a single line in which the translation speed is varied during the print, with 3 lines printed at each translation speed. Images were taken of prints with an Arducam Raspberry Pi Camera and subsequently processed into binary images in ImageJ. These binary images were then segmented and analyzed in Python. Images of lines were also compared against images representing the theoretical print design via structural similarity index (SSIM), which was determined via Python. Printed line widths across each line were analyzed pixel by pixel, resulting in outputs of line width distributions for each individual printed line and average line widths for each print setting tested. Average line widths were calculated for 3 separate prints for each print setting, for a total of n=9 printed lines assessed for each print setting tested. (B) (i) Impact of suspension bath formulation and print speed on filament line width, shown for the 5% bioink without fibers. (ii) Impact of print speed and fibers on filament line width, shown for 5% GelMA (mean ± s.d., one-way ANOVA with Tukey post hoc *p≤ 0.05, ** p≤ 0.01, ***p ≤ 0.001, ****p ≤ 0.0001).
Figure 5:
Figure 5:
Fiber alignment within printed constructs. (A) (left) Schematic of rectangular print design for a 2 × 5 × 0.4 mm construct and image of printed construct, used for assessment of fiber orientation. (middle) Image slices in confocal stacks were converted to binary images in ImageJ, uploaded to FiberFit software and analyzed by conversion to a discrete fourier transform (FFT), then to a power spectrum. Finally, a band pass filter was applied and orientation outputs exported. (right) Fiber orientation was also visualized via color-coded images by plotting fiber orientation from z-stacks through Quanfima software analysis and average orientations for each confocal stack were calculated. 3 confocal stacks for each group were analyzed and uploaded to R for circular statistical analysis. (B) (Top) Images of fibers (left) and quantified fiber orientation and volume fraction (right) along printed filaments for constructs fabricated with 18, 21 and 23 gauge fibers. (Bottom) Images of fibers (left) and quantified fiber orientation (right) at top, middle, and bottom depths for 600 μm thick constructs fabricated with 23 gauge fibers. (200 μm z-stacks, scale bars 0.1 mm).
Figure 6:
Figure 6:
Fiber and MFC orientation within printed constructs from 5% GelMA bioinks with and without fibers. (A) Representative schematics and images of constructs with fibers (grey) and MFCs (F-actin: red, cell nuclei: blue) for printed and non-printed constructs (30 μm z-stacks, scale bars 0.1 mm). (B) Quantification of fiber and cell alignment along printed filament direction or within non-printed constructs 1 and 7 days after culture (n=3 for each group, mean ± s.d., Watson-Wheeler test ****p ≤ 0.0001, *** p ≤ 0.001). (C) Quantification of MFC viability (analyzed with Hoechst 3342 and ethidium-homodimer 1 staining), aspect ratio, and circularity after 1 and 7 days of culture (5% Fiber Print: n = 46 (Day 1), 61 (Day 7) cells; 5% No Fiber Print: n = 67 (Day 1), 73 (Day 7) cells; 5% Fiber No Print: n = 60 (Day 1), 68 (Day 7) cells; 5% No Fiber No Print: n = 58 (Day 1), 66 (Day 7) cells; 3 biologically independent experiments, mean ± s.d., two-way ANOVA with Bonferroni post hoc *p≤ 0.05, ** p≤ 0.01, ***p ≤ 0.001, ****p ≤ 0.0001).
Figure 7:
Figure 7:
Fiber and cell (MFC, MSC, CF) orientation within printed constructs from 5% GelMA bioinks with fibers. (Top) Representative schematics and images of constructs with fibers (grey) and cells (MFCs: left, MSCs: middle, CFs: right) (F-actin: red, cell nuclei: blue) for printed constructs 7 days after culture (30 μm z-stacks, scale bars 0.1 mm). (Bottom) Quantification of fiber and cell alignment along printed filament direction 7 days after culture (n=3 for each group, mean ± s.d., Watson two-sample test of homogeneity **p ≤ 0.01). Quantification of cell viability (analyzed with Hoechst 3342 and ethidium-homodimer 1 staining), aspect ratio, and circularity 7 days after culture for printed constructs. MFCS: n = 61 (Fiber Print), 73 (No Fiber Print) cells; MSCs: n = 62 (Fiber Print), 63 (No Fiber Print) cells; CFs: n = 44 (Fiber Print), 39 (No Fiber Print) cells; 3 biologically independent experiments, mean ± s.d., two-way ANOVA with Bonferroni post hoc *p≤ 0.05, ** p≤ 0.01, ***p ≤ 0.001, ****p ≤ 0.0001, ns = not significant).
Figure 8:
Figure 8:
Printing constructs with heterogeneous cell alignment. Representative schematics and images of 5% GelMA printed constructs with (A) circle-cross design and (B) multi-material print (fibers: grey, no fibers: blue) to illustrate the potential to print structures with variable cell alignment behavior within a single construct (scale bars 1 mm). Confocal images showing fibers (grey) and MFCs (F-actin: red; cell nuclei: blue) for printed constructs (middle) 7 days after culture (30 μm z-stacks, scale bars 0.1 mm) and quantification of fiber and cell alignment along printed filament direction 7 days after culture (n=3 for each group, mean ± s.d., Watson-Wheeler test *p ≤ 0.05, *** p ≤ 0.001)

References

    1. Grewal MG and Highley CB 2021. Electrospun hydrogels for dynamic culture systems: advantages, progress, and opportunities Biomaterials Science 4228–45 - PMC - PubMed
    1. Wade RJ, Bassin EJ, Gramlich WM and Burdick JA 2015. Nanofibrous Hydrogels with Spatially Patterned Biochemical Signals to Control Cell Behavior Advanced Materials 27 1356–62 - PMC - PubMed
    1. Datta P, Vyas V, Dhara S, Chowdhury AR and Barui A 2019. Anisotropy Properties of Tissues: A Basis for Fabrication of Biomimetic Anisotropic Scaffolds for Tissue Engineering Journal of Bionic Engineering 16 842–68
    1. Qu F, Li Q, Wang X, Cao X, Zgonis MH, Esterhai JL, Shenoy VB, Han L and Mauck RL 2018. Maturation State and Matrix Microstructure Regulate Interstitial Cell Migration in Dense Connective Tissues Scientific Reports 8 1–13 - PMC - PubMed
    1. Peng R, Yao X and Ding J 2011. Effect of cell anisotropy on differentiation of stem cells on micropatterned surfaces through the controlled single cell adhesion Biomaterials 32 8048–57 - PubMed

Publication types

LinkOut - more resources