. 2021 Sep 14;118(37):e2100805118.
doi: 10.1073/pnas.2100805118.

Actin filament debranching regulates cell polarity during cell migration and asymmetric cell division

Affiliations

Actin filament debranching regulates cell polarity during cell migration and asymmetric cell division

Chao Xie et al. Proc Natl Acad Sci U S A. .

Abstract

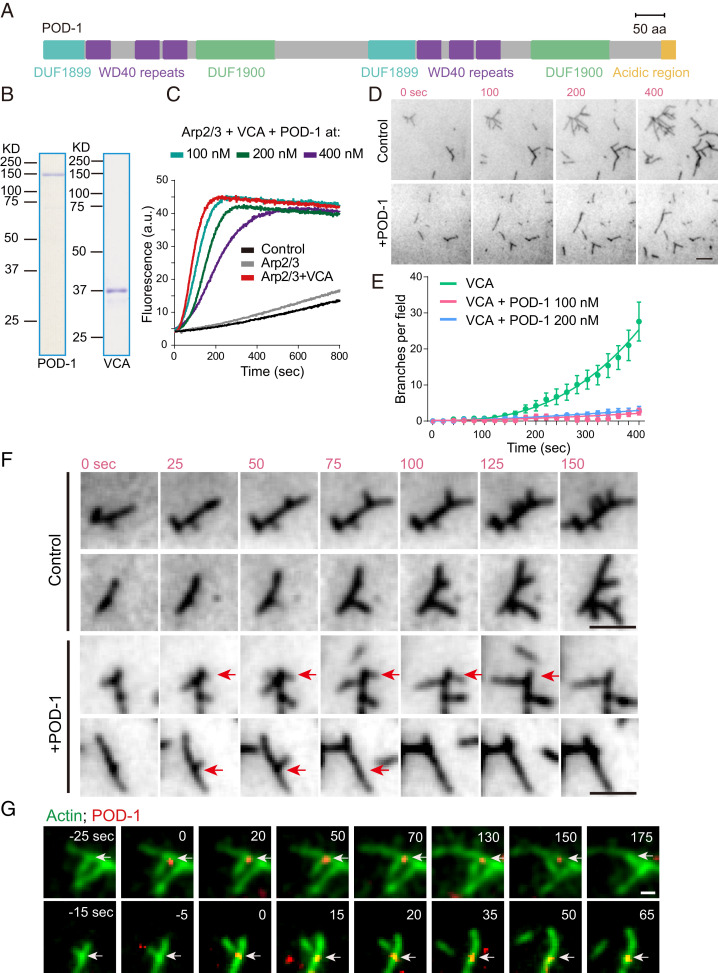
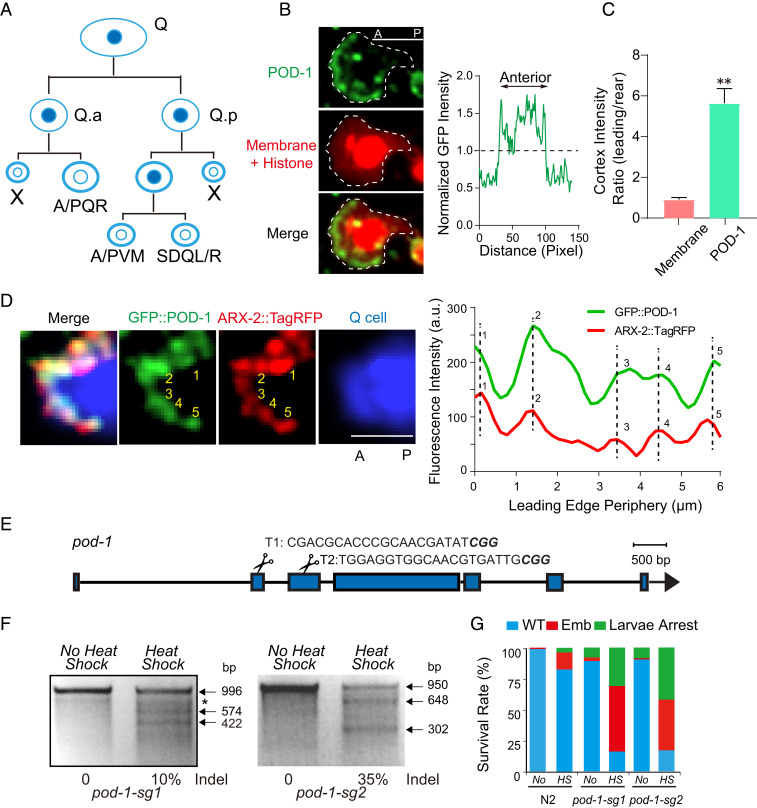
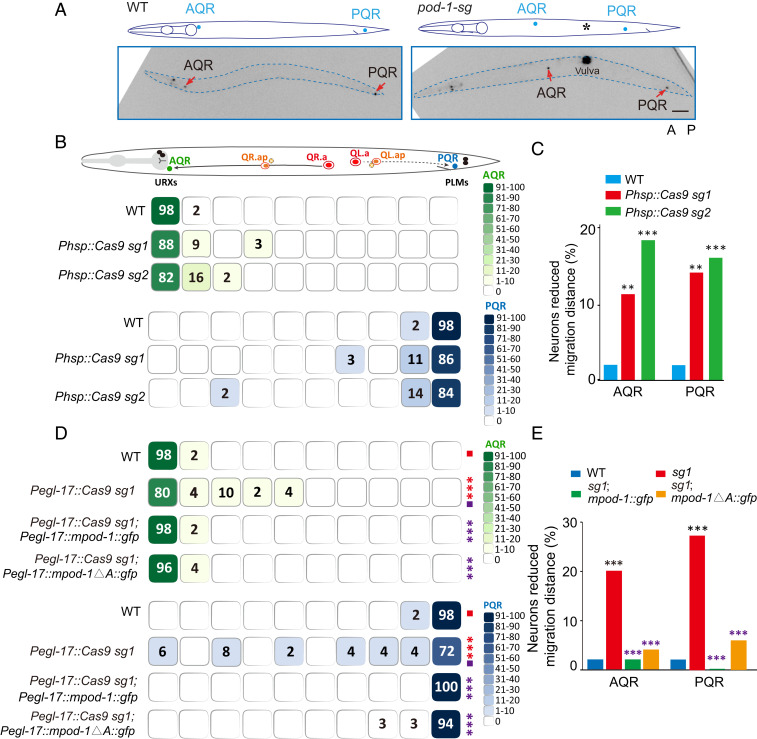
The formation of the branched actin networks is essential for cell polarity, but it remains unclear how the debranching activity of actin filaments contributes to this process. Here, we showed that an evolutionarily conserved coronin family protein, the Caenorhabditis elegans POD-1, debranched the Arp2/3-nucleated actin filaments in vitro. By fluorescence live imaging analysis of the endogenous POD-1 protein, we found that POD-1 colocalized with Arp2/3 at the leading edge of the migrating C. elegans neuroblasts. Conditional mutations of POD-1 in neuroblasts caused aberrant actin assembly, disrupted cell polarity, and impaired cell migration. In C. elegans one-cell-stage embryos, POD-1 and Arp2/3, moved together during cell polarity establishment, and inhibition of POD-1 blocked Arp2/3 motility and affected the polarized cortical flow, leading to symmetric segregation of cell fate determinants. Together, these results indicate that F-actin debranching organizes actin network and cell polarity in migrating neuroblasts and asymmetrically dividing embryos.

Keywords: actin debranching; cell polarity; coronin; directional cell migration.


Conflict of interest statement

The authors declare no competing interest.

Figures

Fig. 1.
Fig. 1.
POD-1 inhibits Arp2/3-mediated actin nucleation in vitro. (A) Schematics of the full-length protein of POD-1. Protein is 1,057 residues long. DUF1899: a putative actin-binding site; WD40 repeats: act as a site for protein−protein or protein−DNA interaction; DUF1900: predominantly found in the structural protein coronin with unknown function; acidic region: homologous to the most C-terminal acidic motif of SCAR/WASP proteins which contacts the Arp2/3 complex. (B) Sodium dodecyl sulfate polyacrylamide gel electrophoresis analysis of strep-tagged full-length POD-1 and GST-tagged WSP-1-VCA domain. Full-length POD-1 was expressed in HEK293F cells, and the WSP-1-VCA domain was expressed in E. coli. These proteins were used for in vitro actin polymerization assays. (C) Spectrofluorimetry assay using pyrene-labeled actin to monitor polymerization. The reactions contain 4 μM actin (10% pyrene labeled), 20 nM Arp2/3 complex, and 10 nM VCA. The concentrations of full-length POD-1 are as indicated; a.u., arbitrary units. See SI Appendix, Fig. S1C for POD-1ΔA and POD-1A. (D) Actin (1.2 μM, 50% Oregon green labeled) filaments growing in the presence of 13.5 nM Arp2/3 and 10 nM VCA ± 100 nM POD-1 observed by TIRF microscopy. Time is represented in seconds, with t = 0 corresponding to the frame from where the imaging was initiated. (Scale bar, 5 μm.) (E) The number of actin branches/field (1,600 μm2) was plotted as a function of time. Actin (1.2 μM, 50% Oregon green labeled), 13.5 nM Arp2/3, and 10 nM VCA, and indicated amounts of POD-1 were mixed immediately before the reactions started. Data are presented as mean ± SEM from five fields for each condition. See SI Appendix, Fig. S1E for POD-1ΔA and POD-1A. (F) High magnification view of filament debranching. Reactions contained actin (1.2 μM, 50% Oregon green labeled), 13.5 nM Arp2/3, and 5 nM VCA ± 100 nM POD-1. Red arrows indicate debranching events. (Scale bar, 3 μm.) (G) Actin (1.2 μM, 50% Oregon green labeled) filaments growing in the presence of 13.5 nM Arp2/3 complex, 10 nM VCA, and 200 nM Alexa Fluor-568 labeled POD-1 in the flow chamber observed by TIRF microscopy. White arrows indicate the localization of POD-1. (Scale bar, 1 μm.) See a larger field view in SI Appendix, Fig. S1G.
Fig. 2.
Fig. 2.
Distribution of POD-1 in migrating neuroblasts and generation of pod-1 conditional KO strain. (A) Schematic of Q neuroblast lineages. QL and QR neuroblasts divide three times and generate three neurons (QL: PQR, PVM, and SDQL; QR: AQR, AVM, and SDQR) and two apoptotic cells (X). (B) (Left) Representative fluorescence images of GFP-tagged POD-1 and mCherry tagged plasma membrane and histone in migrating QR.ap cell. The dashed lines indicate the cell periphery; (Right) the normalized GFP fluorescence distribution plot around the periphery of the representative image shown on Left. The trace starts from the posterior of QR.ap and moves counterclockwise along the cell periphery to the anterior and back to the rear. (Scale bar, 5 μm.) See SI Appendix, Fig. S2A for POD-1 localization in Q cell of GFP::POD-1 KI animals. (C) Quantification of POD-1::GFP fluorescence intensity ratio of the leading edge to the rear part of QR.ap cell. The corresponding mCherry-membrane intensity ratio was used as an internal control. Data are presented as mean ± SEM; **P < 0.01 by Student’s t tests. The number of examined animals indicated by N, n = 5. (D) (Left) Triple fluorescence images of AQR. (Right) The corresponding normalized fluorescence KI intensity distribution along the leading edge. Individual puncta of GFP::POD-1 or ARX-2::TagRFP are labeled and numbered in representative images and the corresponding plots. (Scale bar, 3 μm.) (E) Schematic of pod-1 gene model and single guide RNA (sgRNA) sequences (sgRNA1 and sgRNA2 target the second and third exon, respectively). (F) Representative gels of the T7 endonuclease I (T7EI) assay for pod-1 PCR products amplified from the genomic DNA of worms expressing Phsp::Cas9 and PU6::pod-1-sgRNA1 (Left) or PU6::pod-1-sgRNA2 (Right) with or without heat shock treatment. (G) Quantification of embryo survival rates in WT and pod-1 conditional knockouts; n = 50 to 100 from three different generations.
Fig. 3.
Fig. 3.
Depletion of POD-1 causes Q-cell migration defects. (A) Schematics (Top) and fluorescence inverted images (Bottom) of the A/PQR position in WT and pod-1 conditional knockouts. A/PQR neurons were visualized using Pgcy-32::mCherry. The image is inverted so that high mCherry fluorescence intensity is black. The cell identities are denoted adjacent to the cells. Dotted blue lines show the periphery of C. elegans. (Scale bar: 50 μm.) (B) (Bottom) A color-coded heat map scores the A/PQR position in L4 animals of the indicated genotypes. (Top) As shown in the schematic overview of Q-cell migration, the QR descendant (QR.x), AQR, migrates anteriorly, whereas the QL descendant (QL.x), PQR, migrates posteriorly. The total length between the URX and the tail is divided into 10 blocks, and the percent of A/PQRs that stopped within each block is listed. The color darkness of the blocks symbolizes the range of percentage values; n ≥ 50 for all genotypes. (C) Quantification of defects in Q-cell migration of A/PQR in pod-1 conditional knockouts; n ≥ 50. **P < 0.01, ***P < 0.001 by the χ2 test. (D) A color-coded heat map scores the A/PQR position in L4 animals of the indicated genotypes. The quantization method used is the same as in E; n ≥ 50 for all genotypes. Statistical significance compared to the control (purple square) with matching color codes, ***P < 0.001 by the Fisher’s exact tests. (E) Quantification of defects in Q-cell migration in pod-1 conditional knockouts and rescued animals; n ≥ 50. Black stars represent the comparisons between the WT and mutants; purple stars represent the comparisons between the mutants and rescued animals. ***P < 0.001 by the χ2 test.
Fig. 4.
Fig. 4.
Depletion of POD-1 in Q-cell lineages disrupts actin network at the leading edge of migrating Q neuroblasts. (A and B) Fluorescence time-lapse images of F-actin (GFP:: ABDmoesin) in the QR.a cell of WT (A) and pod-1 conditional KO (B) animals. The white arrows indicate the leading edge, and the asterisks denote nuclei. The blue arrows in B indicate ectopic F-actin. The GFP image (Top) is inverted, and Bottom shows the merged images. (Scale bar: 5 μm.) The image of A is also shown in Fig. 5B. (C and D) Fluorescence time-lapse images of F-actin (GFP:: ABDmoesin) in the QR.ap cell of WT (C) and pod-1 conditional KO (D) animals. The white arrows indicate the leading edge, and the asterisks denote nuclei. The blue arrows in D indicate ectopic F-actin. The GFP image (Top) is inverted, and Bottom shows merged images. (Scale bar: 5 μm.) (E) Quantification of the formation of ectopic actin filaments (longer than 2 μm) in Q neuroblasts of WT and pod-1 conditional mutant animals (n = 14 to 20). **P < 0.01 by the χ2 test. (F) Quantification of the F-actin fluorescence intensity ratio of the leading edge to the rear part of QR.ap cell in WT or pod-1 mutant animals (n = 10). The corresponding mCherry-membrane intensity ratio was used as an internal control. Data are presented as mean ± SEM; n.s., not significant, ***P < 0.001 by Student’s t tests. (G) Schematic of a migrating Q cell. The anterior, posterior, and total length or area of the Q cell was quantified as indicated. (H and I) Quantification of the length (H) and area (I) ratios of the leading end to the lagging end of Q cell in the WT and pod-1 conditional KO animals (n = 12 to 14). **P < 0.01, ***P < 0.001 by Student’s t tests. Error bars indicate SEM.
Fig. 5.
Fig. 5.
Depletion of POD-1 disrupts the directionality of neuronal migration and slows whole-cell migration. (A) Quantification scheme of the angle (α) between the longitudinal axis of a migrating cell and the AP body axis. A, anterior; P, posterior; D, dorsal; V, ventral. (B and C) Fluorescence time-lapse images of F-actin, plasma membrane, and histones during AQR/QR.ap migration in WT (B) or pod-1 mutant (C) animals. Merged images are on Left; inverted fluorescence images of F-actin are on Right; white arrows, migration direction; asterisks, nucleus; double-headed arrows, migration distance. F-actin is labeled with the GFP-tagged actin-binding domain of Moesin (GFP::Moesin ABD), and the plasma membrane and histones are labeled with mCherry-tagged myristoylation signal or histone H2B, respectively. The dotted lines indicate the cell periphery in C. Time is presented in minutes. (Scale bars, 5 μm.) (D) Quantification of the QR.ap migration angle. Each line represents the measurement from one time-lapse movie; n = 10. (E) A color-coded heat map scores the QR.ap migration angle. The migration angles were recorded from 40-min migration tracks in WT and pod-1 mutant animals (n = 10 for each strain). The color darkness of the blocks symbolizes the range of percentage values. Animals used were the same as in D. (F) Quantification of the QR.ap migration angle. ***P < 0.001 by Student’s t test. Error bars indicate SD; n = 10. Animals used were the same as in D. (G and H) Quantification of the QR.ap migration distance (G) and speed (H). Each line in G represents the measurement from one time-lapse movie; **P < 0.01 by Student’s t test. Error bars indicate SD; n = 10. Animals used were the same as in D. (I and J) A proposed model for POD-1 in debranching the Arp2/3-based actin network (I) during neuronal migration (J). POD-1 limits the Arp2/3-based branches by promoting debranching in vitro (I). Depletion of POD-1 in vivo disrupts dynamic actin network formation during neuronal migration (J).

Similar articles

Cited by

References

    1. St Johnston D., Establishing and transducing cell polarity: Common themes and variations. Curr. Opin. Cell Biol. 51, 33–41 (2018). - PubMed
    1. Inagaki N., Katsuno H., Actin waves: Origin of cell polarization and migration? Trends Cell Biol. 27, 515–526 (2017). - PubMed
    1. Krause M., Gautreau A., Steering cell migration: Lamellipodium dynamics and the regulation of directional persistence. Nat. Rev. Mol. Cell Biol. 15, 577–590 (2014). - PubMed
    1. Gubieda A. G., Packer J. R., Squires I., Martin J., Rodriguez J., Going with the flow: Insights from Caenorhabditis elegans zygote polarization. Philos. Trans. R. Soc. Lond. B Biol. Sci. 375, 20190555 (2020). - PMC - PubMed
    1. Rodal A. A., et al. ., Conformational changes in the Arp2/3 complex leading to actin nucleation. Nat. Struct. Mol. Biol. 12, 26–31 (2005). - PubMed

Publication types

MeSH terms