. 2021 Sep 14;118(37):e2104093118.
doi: 10.1073/pnas.2104093118.

Rational design of ASCT2 inhibitors using an integrated experimental-computational approach

Affiliations

Rational design of ASCT2 inhibitors using an integrated experimental-computational approach

Rachel-Ann A Garibsingh et al. Proc Natl Acad Sci U S A. .

Abstract

ASCT2 (SLC1A5) is a sodium-dependent neutral amino acid transporter that controls amino acid homeostasis in peripheral tissues. In cancer, ASCT2 is up-regulated where it modulates intracellular glutamine levels, fueling cell proliferation. Nutrient deprivation via ASCT2 inhibition provides a potential strategy for cancer therapy. Here, we rationally designed stereospecific inhibitors exploiting specific subpockets in the substrate binding site using computational modeling and cryo-electron microscopy (cryo-EM). The final structures combined with molecular dynamics simulations reveal multiple pharmacologically relevant conformations in the ASCT2 binding site as well as a previously unknown mechanism of stereospecific inhibition. Furthermore, this integrated analysis guided the design of a series of unique ASCT2 inhibitors. Our results provide a framework for future development of cancer therapeutics targeting nutrient transport via ASCT2, as well as demonstrate the utility of combining computational modeling and cryo-EM for solute carrier ligand discovery.

Keywords: MD simulations; cryo-EM; homology modeling; membrane protein; solute carrier transporter.


Conflict of interest statement

The authors declare no competing interest.

Figures

Fig. 1.
Fig. 1.
Predicted binding mode of ASCT2 inhibitors. (A) The outward-open homology model of ASCT2 based on the EAAT1 structure (PDB identification number: 5MJU) is shown as a green cartoon. The surface of the binding site is shown in gray, and subpockets A and B (PA and PB, respectively) are labeled. (BE) The four ASCT2 inhibitors (purple) are cis and trans isomers of L- and D-proline derivatives (Lc-BPE, Dc-BPE, Dt-BPE, and Lt-BPE, respectively) that are predicted to bind a conformation-specific pocket accessible in the outward-open conformation, with HP2 in an open position. Key amino acids in the binding site are shown as sticks, where oxygen, nitrogen, and sulfur atoms are shown in red, blue, and yellow, respectively; hydrogen bonds are represented with gray dashes.
Fig. 2.
Fig. 2.
Lc-BPE is a potent inhibitor of ASCT2. (A) Electrophysiological recordings obtained after application of alanine (red trace) and increasing concentrations of Lc-BPE (black traces). The times of application of alanine or Lc-BPE are shown by a gray bar (top). (B and C) Lc-BPE inhibitor dose–response relationships for rASCT2 and hASCT2, respectively. The solid and dashed lines represent the best fits to a Michaelis–Menten-like equation with an average apparent Ki of 0.74 ± 0.11 µM (rASCT2) and 0.86 ± 0.11 µM (hASCT2). Currents were normalized to the current recorded after application of 10 µM inhibitor concentration. (D) Inhibition of glutamine uptake (5 µM external concentration) in the presence of varying concentration of Lc-BPE and 5 µM glutamine measured in proteoliposomes reconstituted with purified hASCT2. A half-maximum inhibitory concentration (IC50) of 20.0 µM (black line) is calculated from five biologically independent measurements. Errors bars represent SEM from at least two biologically independent measurements. (E) Current recorded after rapid solution exchange from extracellular buffer (control, gray bar, black trace) to a solution containing buffer + 5 mM alanine (white bar). For the red trace, the cell was preincubated with 10 µM Lc-BPE (red bar, red trace) followed by rapid application of 5 mM alanine. All current recordings were performed at 0 mV in the presence of 130 mM NaSCN internal and 140 mM NaCl external (homoexchange) solutions. (F) Average rate constants, kobs, for data shown in E. Rate constant of the current rise when 5 mM alanine is rapidly applied is shown in pink (24.6 ± 5.2 s−1, control). The rate constants in the presence of preapplied Lc-BPE followed by 5 mM alanine application are 1.9 ± 0.1 s−1 (fast) and 10.7 ± 0.7 s−1 (slow) with a mean of 4.9 ± 0.2 s−1 (single-exponential fit). All current recordings were performed at 0 mV in the presence of 130 mM NaSCN internal and 140 mM NaCl external (homoexchange) solutions.
Fig. 3.
Fig. 3.
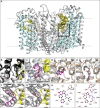
Structural basis for ASCT2 inhibition by Lc-BPE. (A) Cryo-EM structure of the outward-open ASCT2 trimer in complex with Lc-BPE. The scaffold and transport domains are depicted in gray and blue ribbons, respectively, with HP2 shown in yellow. Lines show the approximate location of the membrane boundaries. The binding site is roughly outlined with a box. (B) Superposition of the glutamine-bound outward-occluded (6MPB; gray), apo outward-open (6MP6; black), and outward-open structure in complex with Lc-BPE (yellow) of ASCT2 with a tentative model of HP2, highlighting the HP2 position for the different conformations. (C) Zoomed-in view of the substrate binding site of ASCT2 showing two possible modes of Lc-BPE binding. Mesh represents density in the cryo-EM map. Dark pink and light pink ligands represent the ligand-up and ligand-down conformations, respectively. PC is short for pocket C. (D and E) Progressive model building and refinement of the binding site. Superposition of initial (tan) and refined (light gray) structures with remodeled residues. (D) Lc-BPE in the refined ligand-up structure is dark pink, and (E) Lc-BPE in the refined ligand-down structure is light pink. (F and G) Potential hydrogen bonds between inhibitor and protein for each ligand conformation shown as dashed lines. In the ligand-up conformation (F), the distal phenyl ring of the ligand interacts with previously unknown subpocket C. (H and I) Two-dimensional ligand interaction plot visualized with LigPlot+ (46) of (H) ligand-up and (I) ligand-down conformations. Hydrogen bonds are represented as green dashes, and residues making hydrophobic interactions are marked with red dashes and labeled.
Fig. 4.
Fig. 4.
Pharmacological relevance of multiple ligand binding modes. (A) Clusters of ligand conformations obtained with meta-inference MD simulations reveal multiple ligand binding modes. Orange and blue, respectively, represent the ligand-up and ligand-down conformations of Lc-BPE and HP2. (B–D) Molecular docking of second-generation inhibitors to hASCT2 structures with the inhibitors colored in green. BD are ERA-4, ERA-16, and ERA-21, respectively.

References

    1. Kanai Y., et al. ., The SLC1 high-affinity glutamate and neutral amino acid transporter family. Mol. Aspects Med. 34, 108–120 (2013). - PubMed
    1. Bröer A., et al. ., The astroglial ASCT2 amino acid transporter as a mediator of glutamine efflux. J. Neurochem. 73, 2184–2194 (1999). - PubMed
    1. Wahi K., Holst J., ASCT2: A potential cancer drug target. Expert Opin. Ther. Targets 23, 555–558 (2019). - PubMed
    1. Nicklin P., et al. ., Bidirectional transport of amino acids regulates mTOR and autophagy. Cell 136, 521–534 (2009). - PMC - PubMed
    1. van Geldermalsen M., et al. ., ASCT2/SLC1A5 controls glutamine uptake and tumour growth in triple-negative basal-like breast cancer. Oncogene 35, 3201–3208 (2016). - PMC - PubMed

Publication types

MeSH terms