. 2021 Sep 10;12(1):5379.
doi: 10.1038/s41467-021-25695-0.

Trade-offs between individual and ensemble forecasts of an emerging infectious disease

Affiliations

Trade-offs between individual and ensemble forecasts of an emerging infectious disease

Rachel J Oidtman et al. Nat Commun. .

Abstract

Probabilistic forecasts play an indispensable role in answering questions about the spread of newly emerged pathogens. However, uncertainties about the epidemiology of emerging pathogens can make it difficult to choose among alternative model structures and assumptions. To assess the potential for uncertainties about emerging pathogens to affect forecasts of their spread, we evaluated the performance 16 forecasting models in the context of the 2015-2016 Zika epidemic in Colombia. Each model featured a different combination of assumptions about human mobility, spatiotemporal variation in transmission potential, and the number of virus introductions. We found that which model assumptions had the most ensemble weight changed through time. We additionally identified a trade-off whereby some individual models outperformed ensemble models early in the epidemic, but on average the ensembles outperformed all individual models. Our results suggest that multiple models spanning uncertainty across alternative assumptions are necessary to obtain robust forecasts for emerging infectious diseases.


Conflict of interest statement

The authors declare no competing interests.

Figures

Fig. 1
Fig. 1. Temporal and spatial variation of Zika incidence, temperature, and mosquito occurrence probability in Colombia.
a Weekly Zika incidence from August 9, 2015 to October 1, 2016 with all 31 mainland departments approximately ordered from south to north. b Points indicate average temperature data and lines indicate temperature by the department. c Points indicate average mosquito occurrence probability and lines indicate mosquito occurrence probability by the department. df Mobility matrices under three different assumptions of mobility (CDR-informed denotes a mobility matrix derived from call data records), with departments ordered south to north on the y-axis and north–south on the x-axis. Tan indicates high rates of mobility, dark purple indicates low rates of mobility, white indicates no movements.
Fig. 2
Fig. 2. Observed incidence (navy points) with the median forecast for 16 models (black lines) with the equally weighted ensemble model (green band) for Antioquia, Norte de Santander, Cauca, and Amazonas at five points throughout the epidemic.
Plotted departments reflect differences in population, epidemic size, and geographic regions of Colombia and are represented by each column. The vertical pink line indicates the point at which the forecast was made (also labeled on the right axis), with data to the left of the line assimilated into the model fit. Forecasts to the right of the vertical line change as more data are assimilated into the model, while the model that fits the left of the vertical line do not change. The green band reflects the 50% credible interval of the equally weighted ensemble model.
Fig. 3
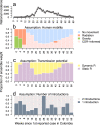
Fig. 3. Ensemble weight partitioned across assumptions about the role of human mobility in driving transmission, drivers of spatiotemporal variation in R, and the number of ZIKV introductions.
a Weekly Zika incidence aggregated to the national scale. bd Proportion of ensemble weight across assumption type colored by explicit assumption.
Fig. 4
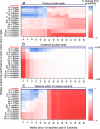
Fig. 4. Model-specific forecast scores are relative to the equally weighted ensemble model for each assimilation period and forecasting target.
a Timing of peak week (within two weeks). b Incidence at peak week. c Onset week. Forecast scores are averaged over the department. Models are ordered on the y-axis by the average forecast score for each forecasting target. Model names on the y-axis are abbreviated such that "R'' or "Rt'' indicates assumption about spatiotemporal variation, "1'' or "2'' indicates a number of introduction events, and “CDRs”, “gravity”, “radiation'”, or “nonspatial” indicates the human mobility assumption. In the heat plot, blue indicates individual model performed better than the ensemble model in a given department, red indicates individual model performed worse than ensemble model, and white indicates individual model performed roughly the same as the ensemble model.
Fig. 5
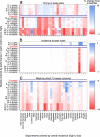
Fig. 5. Model-specific forecast scores are relative to equally weighted ensemble model for each department and forecasting target.
a Timing of peak week (within 2 weeks). b Incidence at peak week. c Onset week, or the week by which ten cumulative cases occurred. Forecast scores are averaged over the department. Models are ordered on the y-axis by average forecast score for each forecasting target, with model names abbreviated in the same manner as Fig. 4. Departments are ordered on the x-axis from high to low for overall incidence. In the heat plot, blue indicates individual model performed better than the ensemble model in a given department, red indicates individual model performed worse than ensemble model, and white indicates individual model performed roughly the same as the ensemble model.

References

    1. Jones KE, et al. Global trends in emerging infectious diseases. Nature. 2008;451:990–993. doi: 10.1038/nature06536. - DOI - PMC - PubMed
    1. Smith KF, et al. Global rise in human infectious disease outbreaks. J. R. Soc. Interface. 2014;11:20140950. doi: 10.1098/rsif.2014.0950. - DOI - PMC - PubMed
    1. Bedford J, et al. A new twenty-first century science for effective epidemic response. Nature. 2019;575:130–136. doi: 10.1038/s41586-019-1717-y. - DOI - PMC - PubMed
    1. Iacono GL, et al. Using modelling to disentangle the relative contributions of zoonotic and anthroponotic transmission: the case of lassa fever. PLOS Negl. Trop. Dis. 2015;9:1–13. doi: 10.1371/journal.pntd.0003398. - DOI - PMC - PubMed
    1. Quinn TC. Global burden of the HIV pandemic. Lancet. 1996;348:99–106. doi: 10.1016/S0140-6736(96)01029-X. - DOI - PubMed

Publication types