Observational Study
. 2021 Sep 10;12(1):5371.
doi: 10.1038/s41467-021-25694-1.

The gut microbiome in konzo

Affiliations
Observational Study

The gut microbiome in konzo

Matthew S Bramble et al. Nat Commun. .

Abstract

Konzo, a distinct upper motor neuron disease associated with a cyanogenic diet and chronic malnutrition, predominately affects children and women of childbearing age in sub-Saharan Africa. While the exact biological mechanisms that cause this disease have largely remained elusive, host-genetics and environmental components such as the gut microbiome have been implicated. Using a large study population of 180 individuals from the Democratic Republic of the Congo, where konzo is most frequent, we investigate how the structure of the gut microbiome varied across geographical contexts, as well as provide the first insight into the gut flora of children affected with this debilitating disease using shotgun metagenomic sequencing. Our findings indicate that the gut microbiome structure is highly variable depending on region of sampling, but most interestingly, we identify unique enrichments of bacterial species and functional pathways that potentially modulate the susceptibility of konzo in prone regions of the Congo.


Conflict of interest statement

The authors declare no competing interests.

Figures

Fig. 1
Fig. 1. Map of DR Congo highlighting sampling locations and food insecurity.
Sampling locations and summary of study populations from South West DRC that includes the urban capital of Kinshasa (n = 30, age = 8.7 ± 1.66, 15 F, 15 M), rural regions in Masi-Manimba (n = 30, age = 9.9 ± 2.32, 15 F, 15 M), and 2 Konzo prone villages in Kahemba (Unaffected Low Prevalence Zone (ULPZ), n = 30, age = 7.93 ± 2.32, 15 F, 15 M) (Konzo Low Prevalence Zone (KLPZ), n = 30, age = 8.33 ± 2.67, 12 F, 18 M) (Unaffected High Prevalence Zone (UHPZ), n = 30, age = 9.03 ± 2.03, 15 F, 15 M) (Konzo High Prevalence Zone (KHPZ), n = 30, age = 9.63 ± 2.31, 12 F, 18 M). Using qGIS 3.8 software, we generated the map illustrating the current status of food insecurity for children 6–59 months old in the DRC at the health zone level. Data and shapefiles were extracted from available datasets from Humanitarian Data Exchange, which is coordinated through OCHA. Using the most recent and available administrative boundary data as a geographic base, we overlaid the August 2018 to June 2019 Integrated Food Security Phase Classification (IPC) data provided by the OCHA DR-Congo. This dataset represents the estimated prevalence of Global Acute Malnutrition (GAM), the weight to height ratio, of children 6–59 months in the representative health zones.
Fig. 2
Fig. 2. Overall alpha diversity and bacterial distribution in study groups.
Microbiome composition for all study groups that include a species level assignments post filtering to include those bacteria whose relative abundance ≥0.01% in each of the 180 participants from Kinshasa (Kin) (n = 30, mean = 473.2), Masi-Manimba (Mas) (n = 30, mean = 552.1), Unaffected Low Prevalence Zone (ULPZ) (n = 30, mean = 502.4), Konzo Low Prevalence Zone (KLPZ) (n = 30, mean = 494.3), Unaffected High Prevalence Zone (UHPZ) (n = 30, mean = 594.5), and Konzo High Prevalence Zone (KHPZ) (n = 30, mean = 606.2). b Shannon Index measures post filtering that includes species in each participant that had a relative abundance ≥0.01 from Kinshasa (n = 30, mean = 3.918), Masi-Manimba (n = 30, mean = 3.996), ULPZ (n = 30, mean = 3.897), KLPZ (n = 30, mean = 3.9), UHPZ (n = 30, mean = 4.186), and KHPZ (n = 30, mean = 4.217). c Highly abundant genus level assignments in the study groups (standard deviation for genus measures can be found in Supplementary File 2). d Z-score Heat map representation of the average relative abundances of the 694 species that passed the ≥0.01% relative abundance in either of the six study groups. In a and b, data are represented as boxplots where the diamond denotes the mean, middle line in the box is the median, the lower hinge is the first quartile, the upper hinge is the third quartile, and the whiskers extend from the lower and upper hinges to the smallest and largest value, respectively, at most to 1.5 * IQR (IQR, interquartile range, is the distance between the first and third quartile), with each individual value plotted.
Fig. 3
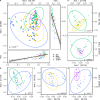
Fig. 3. Global measure of gut bacteria dissimilarity at the genus level for a geographic context.
PCoA representations based on Bray-Curtis dissimilarity matrix values at the genus taxonomic level for a Kinshasa (Kin) vs. Masi-Manimba (Mas) and unaffected children from the low prevalence zone (ULPZ) and high prevalence zone (UHPZ) of Kahemba combined, b Kinshasa vs. Masi-Manimba, c Kinshasa vs. ULPZ, d Kinshasa vs. UHPZ, e Masi-Manimba vs. ULPZ, and f Masi-Manimba vs. UHPZ. Correlations in a were generated using Spearman’s Correlation method of genus relative abundance against principal coordinate 1 and 2 axis values for each sample, and standard error with a 0.95 confidence interval is shown in gray with the regression line. Statistics for Bray-Curtis dissimilarity were generated using PERMANOVA.
Fig. 4
Fig. 4. Random forest classification across populations.
Receiver operating characteristic (ROC) curves and classification performance metrics for one-vs-all random forest classifiers for a Kinshasa vs Masi-manimba vs Kahemba unaffected low prevalence zone (LPZ), and b Kinshasa vs Masi-manimba vs Kahemba unaffected high prevalence zone (HPZ), binary classifier for c unaffected individuals from HPZ vs unaffected individuals from LPZ, and those with konzo from HPZ vs konzo from LPZ, and d konzo vs unaffected individuals from LPZ and HPZ. All ROC curves and performance metrics are averaged over 10 repetitions of 10-fold cross-validation.
Fig. 5
Fig. 5. Global measures of gut bacteria dissimilarity at the genus level for the Kahemba region.
PCoA representations based on Bray-Curtis dissimilarity matrix values at the genus taxonomic level for a Unaffected children from the low prevalence zone (ULPZ) vs. Unaffected children from the high prevalence zone (UHPZ); correlations were generated using Spearman’s Correlation method of genus relative abundance against principal coordinate 1 and 2 axis values for each sample, and standard error with a 0.95 confidence interval is shown in gray with the regression line b Distribution of the relative abundance and normalized CLR medians of both Prevotella and Faecalibacterium genera between unaffected children from the LPZ (n = 30) and HPZ (n = 30). Data are represented as boxplots where the diamond denotes the mean, middle line in the box is the median, the lower hinge is the first quartile, the upper hinge is the third quartile, and the whiskers extend from the lower and upper hinges to the smallest and largest value, respectively, at most to 1.5 * IQR (IQR, interquartile range, is the distance between the first and third quartile), with each individual value plotted. c PCoA representations based on Bray-Curtis dissimilarity matrix values at the genus taxonomic level for Konzo-affected children from the low prevalence zone (KLPZ) vs. Konzo-affected children from the high prevalence zone (KHPZ). PCoA representations based on Bray-Curtis dissimilarity matrix values at the genus taxonomic level for d Unaffected children from the LPZ vs. konzo-affected children from the LPZ of Kahemba and e Unaffected children from the HPZ vs. konzo-affected children from the HPZ of Kahemba. Statistics for Bray-Curtis dissimilarity were generated using PERMANOVA.
Fig. 6
Fig. 6. Abundance of relevant lactic acid bacteria, linamarase, and rhodanese in study populations.
a Boxplot distribution of relative abundance for L. mesenteroides, L. plantarum, and L. lactis. Statistics are based on pairwise comparisons using the Mann-Whitney-Wilcoxon test and reported as expected BH-corrected p-value FDR < .05, two-sided Wilcoxon test, ALDEx2 (Supplementary Fig. 7). b Distribution of the abundance of β-glucosidase (KO 5350) [EC.3.2.1. 21] between the 6 study groups. Statistics are based on pairwise comparisons using the two-sided Mann-Whitney-Wilcoxon test. c Distribution of the abundance of Rhodanese/thiosulfate/3-mercaptopyruvate sulfurtransferase (KO1011) [EC. 2.8.1.1/2.8.1.2] between the six study groups. Statistics are based on pairwise comparisons using the two-sided Mann-Whitney-Wilcoxon test. In ac, samples are from Kinshasa (Kin) (n = 30), Masi-Manimba (Mas) (n = 30), Unaffected Low Prevalence Zone (ULPZ) (n = 30), Konzo Low Prevalence Zone (KLPZ) (n = 30), Unaffected High Prevalence Zone (UHPZ) (n = 30), and Konzo High Prevalence Zone (KHPZ) (n = 30). Additionally, data are represented as boxplots where the middle line in the box is the median, the lower hinge is the first quartile, the upper hinge is the third quartile, and the whiskers extend from the lower and upper hinges to the smallest and largest value, respectively, at most to 1.5 * IQR (IQR, interquartile range, is the distance between the first and third quartile). In a, outliers are plotted individually, and in b and c, each individual value is plotted.

Comment in

Similar articles

Cited by

References

    1. Brewster R, et al. Surveying gut microbiome research in Africans: toward improved diversity and representation. Trends Microbiol. 2019;27:824–835. doi: 10.1016/j.tim.2019.05.006. - DOI - PMC - PubMed
    1. Tang M, et al. Different gut microbial profiles in sub-Saharan African and South Asian women of childbearing age are primarily associated with dietary intakes. Front. Microbiol. 2019;10:1848. doi: 10.3389/fmicb.2019.01848. - DOI - PMC - PubMed
    1. Schnorr SL, et al. Gut microbiome of the Hadza hunter-gatherers. Nat. Commun. 2014;5:3654. doi: 10.1038/ncomms4654. - DOI - PMC - PubMed
    1. Morton ER, et al. Variation in rural African gut microbiota is strongly correlated with colonization by Entamoeba and subsistence. PLoS Genet. 2015;11:e1005658. doi: 10.1371/journal.pgen.1005658. - DOI - PMC - PubMed
    1. Gomez A, et al. Gut microbiome of coexisting BaAka Pygmies and Bantu reflects gradients of traditional subsistence patterns. Cell Rep. 2016;14:2142–2153. doi: 10.1016/j.celrep.2016.02.013. - DOI - PubMed

Publication types