. 2021 Sep 10;12(1):5376.
doi: 10.1038/s41467-021-25715-z.

Metabolic requirements of NK cells during the acute response against retroviral infection

Affiliations

Metabolic requirements of NK cells during the acute response against retroviral infection

Elisabeth Littwitz-Salomon et al. Nat Commun. .

Abstract

Natural killer (NK) cells are important early responders against viral infections. Changes in metabolism are crucial to fuel NK cell responses, and altered metabolism is linked to NK cell dysfunction in obesity and cancer. However, very little is known about the metabolic requirements of NK cells during acute retroviral infection and their importance for antiviral immunity. Here, using the Friend retrovirus mouse model, we show that following infection NK cells increase nutrient uptake, including amino acids and iron, and reprogram their metabolic machinery by increasing glycolysis and mitochondrial metabolism. Specific deletion of the amino acid transporter Slc7a5 has only discrete effects on NK cells, but iron deficiency profoundly impaires NK cell antiviral functions, leading to increased viral loads. Our study thus shows the requirement of nutrients and metabolism for the antiviral activity of NK cells, and has important implications for viral infections associated with altered iron levels such as HIV and SARS-CoV-2.


Conflict of interest statement

The authors declare no competing interests.

Figures

Fig. 1
Fig. 1. Kinetic of FV infection and effector phenotype of NK cells upon FV infection.
C57BL/6 mice were infected with FV for 3, 7, 12 and 28 days. Single-cell suspensions from spleens and bone marrow (BM) were prepared and used for the analysis of viral loads via Infectious Center assay (a). At least six mice from at least two individual experiments were used for the analysis. b Single-cell suspensions were stained for NK cell markers (CD3 NK1.1+ CD49b+) and analysed for the activation by measuring the early activation marker CD69. Naive mice were used as control. Mean values ± SEM were indicated by circles (bone marrow) and rectangles (spleen). Statistically significant differences between bone marrow and spleen (a) and CD69+ NK cells (b) were analysed by Mann–Whitney test. At 7 dpi, splenocytes were stained for NK cell markers and CD27 and CD11b (c). The effector phenotype of splenic NK cells (e) and NK cells from the bone marrow (d), KI-67, FasL, TNF, IFNγ and GzmB is displayed as spider plots. Data of NK cells from naive mice were displayed in blue and from FV infection in red. Statistically significant differences were analysed between naive and FV groups with an unpaired t-test (CD27 CD11b, KI-67, FasL, TNF (%), IFNγ (%)) or Mann–Whitney test (TNF (MFI), IFNγ (MFI)) within the bone marrow or spleens. A minimum of six mice from two independent experiments was used for the analysis. Significances are indicated as follows: *p < 0.05, **p < 0.01, ***p < 0.001. Applied statistical tests were two-sided. Source data are provided as a Source Data file. ns not significant.
Fig. 2
Fig. 2. Increased NK cell blastogenesis and augmented metabolic activity after acute FV infection.
Splenic and bone marrow (BM) NK cells from naive mice or mice FV-infected for 7 days were analysed for cell size by analysing the FSC on NK cells. NK cells were gated on lymphocytes, single cells, viable, CD3, NK1.1+ CD49b+ cells. A representative histogram of the FSC on NK cells from both organs are shown in a and displayed as a bar graph ± SEM in b. Statistically significant differences were analysed between naive and FV groups by a two-tailed unpaired t-test within the bone marrow or spleens. Experiments were repeated independently twice with similar results. The correlation between activated NK cells and NK cell size (FSC-A) was analysed and displayed in c. NK cells from naive mice are displayed in open circles whereas NK cells from FV-infected mice are displayed in grey circles. At least six mice per group from two independent experiments were used. FSChigh and FSClow NK cells were analysed for the expression of CD98 and CD71 (d). NK1.1 expression was analysed on FSChigh and FSClow NK cell population (d, right-hand side). Experiments were repeated independently twice with similar results. Differences between FSChigh and FSClow NK cells regarding CD71 and CD98 are shown in a bar graph in e. At least 14 mice from four independent experiments were used for the analysis. Statistically significant differences between FSChigh and FSClow NK cells were analysed with a two-tailed Mann–Whitney test within the bone marrow or spleens. Data are presented as mean values ± SEM. Representative histogram of cMyc of NK cells in the spleen and bone marrow are shown in f. Experiments were repeated independently twice with similar results. The MFI of cMyc on NK cells (g) is displayed as bar graphs ± SEM and were analysed by a two-tailed unpaired t-test. At least six animals from two independent experiments were used for the analysis. cMyc+ and cMyc NK cells were further analysed for the cell size by measuring the FSC (h) and for proliferation by detecting KI-67 (i). At least six mice per group from two independent experiments were used. Data are presented as mean values ± SEM. Statistically significant differences in bone marrow or spleen were analysed with a two-sided unpaired t-test and displayed as *p < 0.05, **p < 0.01, ***p < 0.001. Source data are provided as a Source Data file.
Fig. 3
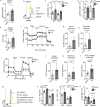
Fig. 3. Increased mitochondrial activity, glycolysis and kynurenine uptake of NK cells in acute FV infection.
C57BL/6 mice were infected with FV and analysed at 7 dpi. Naive C57BL/6 mice were used as control. NK cells were isolated from the spleen using magnetic beads. Mitochondrial and nuclear DNA was detected by quantitative real-time PCR (a). Samples were collected from two independent experiments and were run in duplicates or triplicates. A minimum of six mice per group was used and analysed by Mann–Whitney test. Data are presented as mean values ± SEM. Spleen and bone marrow (BM) was harvested at 7 dpi and NK cells were analysed for TMRM (b, c) and CellROX (d). Carbonyl cyanide-4-(trifluoromethoxy)phenylhydrazone (FCCP, minimum) and Oligomycin (maximum) were used as a control for the TMRM measurement. A minimum of six (c) or seven (d) mice per group from two independent experiments with similar results were used and analysed by Mann–Whitney test. ATP levels were detected in bead-isolated, splenic NK cells from naive and FV-infected mice (e). Purified NK cells were lysed with Glo lysis buffer and analysed with an ATP determination kit. Samples were run at least in duplicates and a minimum of nine mice per group from three independent experiments was used. Statistically significant differences were analysed by an unpaired t-test. Data are presented as mean values ± SEM for ce. Analysis of extracellular acidification rate (ECAR) was measured in isolated, splenic NK cells in naive and FV-infected mice (f). Experiments were repeated independently three times with similar results. Basal glycolysis (g) and glycolytic capacity (h) were calculated and displayed as bar graph ± SEM. At least seven mice from three independent experiments were used and analysed by an unpaired t-test. Analysis of oxygen consumption rate (OCR) was measured in isolated, splenic NK cells in naive and FV-infected mice (i). Experiments were repeated independently three times with similar results. Basal OXPHOS (j), maximum respiration (k) and ATP-linked respiration (l) was calculated and displayed as bar graph ± SEM. At least twelve mice from four independent experiments were used and analysed by an unpaired t-test. A representative histogram of kynurenine (kyn) uptake by splenic NK cells with suitable controls (no kynurenine, lysine, leucine, 2-Amino-2-norbornanecarboxylic acid (BCH)) (m) and the quantification is shown for the bone marrow and spleen (m, n). Experiments were repeated independently twice with similar results. The expression of CD98 by NK cells is shown in o ±SEM. A minimum of six (n) or eight (o) mice per group from two (n) or three (o) independent experiments were used and analysed by Mann–Whitney test for and displayed ± SEM. *p < 0.05, **p < 0.01, ***p < 0.001. The applied statistical tests were two-sided. Source data are provided as a Source Data file. ns not significant.
Fig. 4
Fig. 4. Metabolism of NK cells after acute MCMV infection.
C57BL/6 mice were infected with MCMV (Smith strain) or used uninfected and spleens were harvested at 1.5 days. NK cells (CD3NKp46+) were analysed for activation (CD69) and cell size (FSC-A) (a). Ex vivo restimulated NK cells were analysed for IFNγ (b). Cytotoxicity was detected by granzyme B expression (c). A representative histogram and bar graphs of CD71 and CD98 are shown in d and e. A minimum of four (e) or seven (ad) mice per group were used and analysed by a two-sided unpaired t-test and displayed ± SEM. **p < 0.01, ***p < 0.001. f Volcano plots of nutrient transporters and glycolysis-related genes displaying differences in relative gene expression after MCMV infection. The plot represents the −log10 of the p-value against log2 fold change. The horizontal red line represents a p-value <0.05. Source data are provided as a Source Data file.
Fig. 5
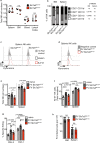
Fig. 5. Influence of Slc7a5 deletion in NK cells during acute retrovirus infection.
Spleen, bone marrow (BM, tibia and femur of the right hind leg), lymph nodes (axillary, brachial, inguinal) and blood were collected from mice with loxP sites flanking exon 2 of the Slc7a5 gene crossed with transgenic mice expressing cre recombinase under the control of the NCR1 promoter (Slc7a5NK-WT and Slc7a5NK-KO mice). Single-cell suspensions were counted, stained for NK cell markers (CD3CD19NK1.1+NKp46+) and measured by flow cytometry (a). Cell numbers in the blood were calculated per ml of blood. A minimum of three mice from two independent experiments were used and analysed by Mann–Whitney test. Data are presented as mean values ± SEM. Frequencies of CD27 and CD11b NK cell subsets of Slc7a5NK-WT and Slc7a5NK-KO mice are displayed in b for bone marrow and spleen. Data are presented as mean values ± SEM. NK cell kynurenine (kyn) uptake of unstimulated or IL-2/12-stimulated NK cells is displayed in c. Slc7a5NK-WT and Slc7a5NK-KO were infected with FV and at 7 dpi, the spleen and bone marrow of FV-infected Slc7a5NK-WT, Slc7a5NK-KO, or naive mice were harvested. A representative histogram from splenic NK cells (CD3CD49b+ NK1.1+) from Slc7a5NK-WT and Slc7a5NK-KO mice is shown in d. Experiments were repeated independently twice with similar results. The absolute cell numbers of NK cells (e) and their proliferation (f) are displayed as bar graphs ± SEM. YAC-1 cells (right-hand side) or FV-induced tumour cells (FBL-3 cells, left-hand side) were stained with Tag-it-violet and co-incubated with isolated, splenic NK cells for 18 h (g). Viral loads were analysed by an IC assay in Slc7a5NK-WT and Slc7a5NK-KO mice (h). Data are presented as mean values ± SEM (g, h). A minimum of six mice per group from two independent experiments was used (eh) and analysed by ordinary one-way ANOVA (b, e, f), unpaired t-test (h) or Kruskal–Wallis test (g). Significances are indicated as follows: **p < 0.01, ***p < 0.001. Source data are provided as a Source Data file. BCH 2-Amino-2-norbornanecarboxylic acid, ns not significant.
Fig. 6
Fig. 6. Iron uptake by NK cells upon FV infection.
C57BL/6 mice were infected i.v. with FV for 7 days or used as uninfected, naive control. Transferrin uptake assay and controls (no transferrin, competition with holo-transferrin, uptake at 4 °C) are shown as representative histograms for splenic NK cells (a). Experiments were repeated independently twice with similar results. Transferrin uptake of NK cells (b) and CD71+ NK cells (c) from spleen and bone marrow (BM) are displayed as bar graphs ± SEM. Statistically significant differences were analysed by two-tailed Mann–Whitney test (b) and two-tailed unpaired t-test (c). Minimum of six mice per group from two independent experiments was used for the analysis. An experimental overview of the induction of low serum iron concentrations using mini-hepcidin (mHep) is shown in box d. Serum iron was analysed in e with a minimum of five mice from two independent experiments. Data are presented as mean values ± SEM. A representative histogram of CD71 expression on NK cells of FV-infected vehicle-treated and FV-infected mHep-treated mice is shown in f. Experiments were repeated independently twice with similar results. Activation of NK cells was analysed by the early activation marker CD69 (g) and the percentage of IFNγ+ NK cells (h) after mHep treatment are displayed as bar graphs ± SEM. At least six mice from two independent experiments were used. IFNγ concentration in mouse serum (i) as well as IL-12, IL-15 and IL-18 concentrations in spleens (j) were analysed using a custom-made Legendplex kit. Cytokines were measured in a minimum of seven mice from two independent experiments (i) or four mice from one experiment (j) were used for the analyses. In i serum from seven mice from two independent experiments were used. At least four mice were used to measure cytokines in the spleen from one experiment (j). Data are presented as mean values ± SEM (i, j). mRNA levels of cytokines were measured in splenocytes by quantitative real-time PCR and are displayed as spider plot (k). Statistically significant differences were analysed by an ordinary one-way ANOVA within groups of bone marrow or spleen. Significances are indicated as follows: *p < 0.05, **p < 0.01, ***p < 0.001. Source data are provided as a Source Data file. ns not significant.
Fig. 7
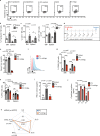
Fig. 7. Influence of low serum iron on NK cells during acute FV infection.
C57BL/6 mice were infected i.v. with FV for 7 days or used as uninfected, naive control. Mice were treated every day i.p. with DSPE (vehicle) or mini-hepcidin (mHep) in DSPE. At the day of the experiment, bone marrow (BM) and spleens were harvested and stained for analysis by flow cytometry. NK cells were analysed for cell size (FSC, a) and for cMyc (b). NK cells were isolated from spleens of naive + vehicle and FV-infected mice (FV + vehicle and FV + mHep) and co-incubated with Tag-it-Violet stained FV-induced FBL-3 tumour cells. After co-incubation, co-culture was stained for viability and analysed by flow cytometry (c). Viral loads were detected by an Infectious Center assay in bone marrow and spleen and analysed by a two-sided Mann–Whitney test (d). At least five mice per group from two independent experiments were used. Statistically significant differences between the groups were analysed with an Ordinary one-way ANOVA (ac). The cell culture medium of in vitro expanded NK cells was modified for iron availability (DFO) and additional iron (FeSO4) was added if indicated. NK cells were analysed for cell size (e), MitoTracker Green (f), perforin (g) and granzyme B (h). Experiments were performed once with four biological replicates. Statistically significant differences were analysed by an ordinary one-way ANOVA with a Sidak post-test. NK cells (NK1.1+CD4CD8) were depleted with an anti-NK1.1 depletion antibody and depletion efficiency is shown in i. At 3 dpi, viral loads of FV-infected, mHep-treated ± NK cell depletion is displayed in j and were analysed by a two-sided unpaired t-test. All data are presented as mean values ± SEM. *p < 0.05, **p < 0.01, ***p < 0.001. Source data are provided as a Source Data file. ns not significant.

Similar articles

Cited by

References

    1. Vivier E, Tomasello E, Baratin M, Walzer T, Ugolini S. Functions of natural killer cells. Nat. Immunol. 2008;9:503–510. doi: 10.1038/ni1582. - DOI - PubMed
    1. Lanier LL. Activating and inhibitory NK cell receptors. Adv. Exp. Med. Biol. 1998;452:13–18. doi: 10.1007/978-1-4615-5355-7_2. - DOI - PubMed
    1. Nguyen KB, et al. Coordinated and distinct roles for IFN-alpha beta, IL-12, and IL-15 regulation of NK cell responses to viral infection. J. Immunol. 2002;169:4279–4287. doi: 10.4049/jimmunol.169.8.4279. - DOI - PubMed
    1. Littwitz-Salomon, E., Schimmer, S. & Dittmer, U. The dose of retroviral infection determines the induction of anti-viral NK cell responses. J. Virol.10.1128/JVI.01122-17 (2017). - PMC - PubMed
    1. Biron CA, Nguyen KB, Pien GC, Cousens LP, Salazar-Mather TP. Natural killer cells in antiviral defense: function and regulation by innate cytokines. Annu. Rev. Immunol. 1999;17:189–220. doi: 10.1146/annurev.immunol.17.1.189. - DOI - PubMed

Publication types

Substances

LinkOut - more resources