. 2021 Sep 10;12(1):5382.
doi: 10.1038/s41467-021-25767-1.

Selective targeting of the TLR2/MyD88/NF-κB pathway reduces α-synuclein spreading in vitro and in vivo

Affiliations

Selective targeting of the TLR2/MyD88/NF-κB pathway reduces α-synuclein spreading in vitro and in vivo

Debashis Dutta et al. Nat Commun. .

Abstract

Pathways to control the spreading of α-synuclein (α-syn) and associated neuropathology in Parkinson's disease (PD), multiple system atrophy (MSA) and dementia with Lewy bodies (DLB) are unclear. Here, we show that preformed α-syn fibrils (PFF) increase the association between TLR2 and MyD88, resulting in microglial activation. The TLR2-interaction domain of MyD88 (wtTIDM) peptide-mediated selective inhibition of TLR2 reduces PFF-induced microglial inflammation in vitro. In PFF-seeded A53T mice, the nasal administration of the wtTIDM peptide, NEMO-binding domain (wtNBD) peptide, or genetic deletion of TLR2 reduces glial inflammation, decreases α-syn spreading, and protects dopaminergic neurons by inhibiting NF-κB. In summary, α-syn spreading depends on the TLR2/MyD88/NF-κB pathway and it can be reduced by nasal delivery of wtTIDM and wtNBD peptides.


Conflict of interest statement

The authors declare no competing interests.

Figures
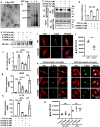
Fig. 1
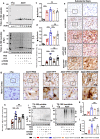
Fig. 1. Preformed α-syn fibril (PFF)-induced TLR2 activation in microglia.
Recombinant human α-syn was fibrillized in vitro to form preformed fibrils (PFF) and validated by electron microscopy to show fibrillar structure of the protein (a) and further by immunoblotting using anti-α-syn antibodies (b). BV-2 cells were preincubated with wtTIDM or mTIDM for 1 h followed by treatment with α-syn PFF (0.5 µM or 7 µg/ml), and the interaction of PFF-induced TLR2 and MyD88 was evaluated by immunoprecipitation (c, d, p = 0.00012 for control vs PFF and p = 0.00039 for PFF vs wtTIDM), NF-κB activation was measured in nuclear extracts by EMSA (e) and by luciferase assay in cells initially transfected with luciferase reporter gene constructs (f, p = 0.00008 for control vs PFF, p = 0.00018 for PFF vs wtTIDM 2 μM, p = 0.000042 for PFF vs wtTIDM 5 μM and p = 0.000035 for wtTIDM 5 μM vs mTIDM 5 μM). Wild type (WT) primary microglia, pretreated with wtTIDM or mTIDM, were exposed to PFF, RNA was isolated and the mRNA expression of induced nitric oxide synthase (iNOS, g, p = 0.00031 for control vs PFF, p = 0.039 for PFF vs wtTIDM 2 μM, p = 0.0014 for PFF vs wtTIDM 5 μM and p = 0.00018 for wtTIDM 5 μM vs mTIDM 5 μM) and interleukin-1β (IL-1β, h, p = 0.00004 for control vs PFF, p = 0.0005 for PFF vs wtTIDM 2 μM, p = 0.00006 for PFF vs wtTIDM 5 μM and p = 0.00026 for wtTIDM 5 μM vs mTIDM 5 μM) was quantified by real-time PCR. Microglia isolated from WT and TLR2−/ mice were treated with 0.5 µM of monomeric FITC-tagged α-syn for 2 h and the uptake of the protein was analyzed by immunofluorescence (i, j, p = 0.0064). WT microglia preincubated with 5 µM of either wtTIDM or mTIDM for 30 min were stimulated with LPS. After 1 h of LPS stimulation, monomeric FITC-tagged α-syn was added to the media, and phagocytosis was assessed by fluorescence analysis where FITC-tagged α-syn is shown within Iba1-positive microglia (k, l). MFI of intracellular α-syn was measured by ImageJ (m). Unpaired two-tailed t-test and one-way ANOVA followed by Tukey’s multiple comparison tests were performed for statistical analyses. *p < 0.05, **p < 0.01, and ***p < 0.001 indicate significance compared to respective groups. Values are given as mean ± S.D. (n = 3 independent experiment).
Fig. 2
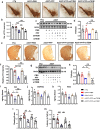
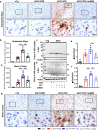
Fig. 2. The wtTIDM peptide inhibits α-syn spreading from striatum to SN and motor cortex.
Spreading of α-syn in the brain of PFF-seeded A53T mice was monitored in SN region by immunoblotting of the protein isolated in Triton X-100 soluble (a) and insoluble (b) fractions. Arrows indicate the bands of different molecular weight of α-syn in insoluble fractions. Band density of monomeric α-syn in soluble (c, n = 5 animals, p = 0.0002 for nTg vs A53T + PBS) and insoluble (d, n = 6 animals, p = 0.0002 for A53T + PBS vs A53T + PFF and p = 0.000336 for A53T + PFF vs A53T + PFF + wtTIDM) fractions were normalized with the corresponding actin band. Level of phosphoserine 129 α-syn (pSyn129) in SN was evaluated by immunostaining followed by relative optical density measurement (e, f, n = 5 animals, p = 0.00001 for A53T + PBS vs A53T + PFF and p = 0.00003 for A53T + PFF vs A53T + PFF + wtTIDM). Propagation of α-syn in the motor cortex was monitored primarily by pSyn129 immunostaining (g, h, n = 5 animals, p = 0.00001 for A53T + PBS vs A53T + PFF and p = 0.005 for A53T + PFF vs A53T + PFF + wtTIDM) and immunoblotting of Triton X-100 soluble (i, k) and insoluble forms of the protein (j, l, n = 4 animals, n = 4 animals, p = 0.0011 for A53T + PBS vs A53T + PFF and p = 0.0047 for A53T + PFF vs A53T + PFF + wtTIDM). Two sections from each brain were taken for immunostaining, where Nissl was used for counterstaining. The value obtained from each section is shown in the graph. Images were deconvoluted by Fiji and DAB immunostaining specific to pSyn129 was measured and individual values obtained from each section are shown in the diagram. One-way ANOVA followed by Tukey’s multiple comparison tests was conducted for statistical analyses. *p < 0.05, **p < 0.01, ***p < 0.001 indicate significance compared to respective groups. Values are given as mean ± SEM.
Fig. 3
Fig. 3. The α-Syn spreading is reduced in PFF-seeded A53T mice lacking TLR2.
A53T+/+ mice were crossed with TLR2−/− mice to generate A53TΔTLR2 double transgenic mice. These mice were validated by genetic screening where 324 and 247 bp bands correspond to nTg and A53T Tg mice respectively (marked with arrows). Similarly, 499 and 334 bp bands indicate nTg and TLR2−/− mice respectively (shown with arrows) (a). Spreading of α-syn in SN of PFF-seeded A53T and A53TΔTLR2 mice was compared by assessing total α-syn level in Triton X-100 soluble (b, d) and insoluble (c, e, p = 0.0027 for A53T + PBS vs A53T + PFF and p = 0.014 for A53T + PFF vs A53TΔTLR2+PFF) fractions by immunoblotting. Actin was used as the loading control. Level of pSyn129 in SN (f, g, p = 0.00015 for A53T + PFF vs A53TΔTLR2+PFF) and motor cortex (h, i, p = 0.0003 for A53T + PFF vs A53TΔTLR2+PFF) was monitored by immunostaining (f, h) followed by pSyn129 intensity analysis using Fiji. Two sections from each brain were used for staining and individual values from each section are shown. Two-way ANOVA was performed to determine statistical significance among different groups. *p < 0.05, **p < 0.01, and ***p < 0.001 indicate significance compared to respective groups. Values are given as mean ± SEM (n = 4 animals per group).
Fig. 4
Fig. 4. Attenuated Parkinsonian pathology by wtTIDM in PFF-seeded A53T mice.
Nigral pathology in α-syn PFF-injected A53T control and wtTIDM/mTIDM administered mice was evaluated by immunohistochemical staining of TH (a) followed by stereological counting of viable TH + ve neurons in SN (b, n = 5 animals, p = 0.00052 for A53T + PBS vs A53T + PFF and p = 0.0025 for A53T + PFF vs A53T + PFF + wtTIDM). Images are shown at ×5 magnification, scale bar is 200 µm. TH protein level in SN was monitored by immunoblotting (c) and relative TH expression with respect to actin is shown (d, n = 4 animals, p = 0.0226 for A53T + PBS vs A53T + PFF and p = 0.0171 for A53T + PFF vs A53T + PFF + wtTIDM). Striatal pathology in experimental groups was checked by immunostaining of TH neuronal fibers in striatum (e). TH optical intensity was measured by Fiji and relative TH fiber intensity as a percentage to the nTg control brain is presented (f, n = 5 animals, p = 0.0005 for A53T + PBS vs A53T + PFF and p = 0.00034 for A53T + PFF vs A53T + PFF + wtTIDM). Images are shown at ×4 magnification. TH protein level in striatum is shown by immunoblotting (g, h, n = 4 animals, p = 0.0193 for A53T + PBS vs A53T + PFF and p = 0.0337 for A53T + PFF vs A53T + PFF + wtTIDM). Level of dopamine (DA, n = 4 animals, p = 0.0211 for A53T + PBS vs A53T + PFF and p = 0.0411 for A53T + PFF vs A53T + PFF + wtTIDM), 3, 4-dihydroxyphenylacetic acid (DOPAC, n = 4), and homovanillic acid (HVA, n = 4) was measured by HPLC-ECD method and the amount of neurotransmitters per mg of tissue was calculated (ik). Behavioral performance of animals is demonstrated by a number of rearing (l, n = 6 animals, p = 0.0011 for A53T + PBS vs A53T + PFF and p = 0.0107 for A53T + PFF vs A53T + PFF + wtTIDM) and latency to fall down in rotarod test (m, n = 6 animals, p = 0.00045 for A53T + PBS vs A53T + PFF and p = 0.0044 for A53T + PFF vs A53T + PFF + wtTIDM). One-way ANOVA followed by Tukey’s multiple comparison tests was conducted for statistical analyses. *p < 0.05, **p < 0.01, ***p < 0.001 indicate significance compared to respective groups. Values are given as mean ± SEM.
Fig. 5
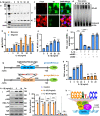
Fig. 5. Activation of NF-κB increases α-syn expression in neurons.
Cells were stimulated with different concentrations of IL-1β under serum-free conditions. After 12 h of IL-1β treatment, the protein level of α-syn was examined by western blot (a, b, p = 0.00001 for α-syn monomer, control vs IL-1β 10–25 ng/ml doses and for α-syn oligomer, p = 0.000023 control vs IL-1β 5 ng/ml, p = 0.00009 control vs IL-1β 10 ng/ml, p = 0.000021 control vs IL-1β 15 ng/ml, p = 0.00004 control vs IL-1β 20 ng/ml, p = 0.00001 control vs IL-1β 25 ng/ml). After 12 h of IL-1β treatment, cells were also immunostained with antibodies against α-syn and TH (c). Mouse MN9D cells were incubated with IL-1β for different time periods followed by monitoring the activation of NF-κB by EMSA (d). MN9D cells were transfected with PBIIx-Luc for 24 h followed by treatment with different concentrations of IL-1β and subjected to luciferase assay (e, p = 0.0183 control vs IL-1β 5 ng/ml, p = 0.00022 control vs IL-1β 10 ng/ml, p = 0.00006 control vs IL-1β 20 ng/ml, p = 0.00002 control vs IL-1β 25 ng/ml). Cells preincubated with either wtNBD peptide or mNBD peptide for 30 min were stimulated by IL-1β for 4 h followed by the analysis of α-syn mRNAs by quantitative real-time PCR (f, p = 0.00001 control vs IL-1β, p = 0.00001 IL-1β vs IL-1β + wtNBD both doses). Map of wild type and mutated NF-κB site of α-syn-luciferase promoter constructs (g). MN9D cells were transfected with pα-syn(WT)-Luc and pα-syn(Mut)-Luc for 24 h followed by treatment with IL-1β and subjected to luciferase assay (h, p = 0.00001 for control vs IL-1β all doses). MN9D Cells were treated with IL-1β for 1 h in serum-free media. Then immunoprecipitated chromatin fragments were amplified by semi-quantitative (I), and quantitative PCR (j, p = 0.00001 or less for the indicated asterisks) for the indicated region spanning the proximal NF-κB of the α-syn promoter using primers mentioned under “Methods”. ** and *** indicate p < 0.01 and p < 0.001 compared to the control. “NS” indicates not significant. One-way ANOVA followed by Tukey’s multiple comparison test was used for statistical analyses. All results are presented as mean ± S.D. (n = 3 independent experiments). The schematic diagram depicts a detailed map of promoter analysis of α-syn gene (k). The map reveals a conserved NF-κB-responsive element in the promoter of α-syn gene at −350 to 335 upstream of the α-syn transcription start site.
Fig. 6
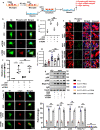
Fig. 6. NF-κB-mediated upregulation of α-syn in primary DAergic neurons and NF-κB activation in vivo.
Primary microglia were treated with either wtTIDM or mTIDM (5 µM) and after 30 min challenged with PFF (7 µg/ml). Following 12 h of PFF exposure, the insert containing microglia was placed on to the culture dish containing primary DAergic neurons (a). After 3 h of co-culturing, immunostaining was performed for phospho Ser536 p65 in TH+ DAergic neurons (b). The mRNA expression of α-syn in neurons was monitored after 6 h of co-culturing by real-time PCR (c, n = 3 samples, p = 0.0128 for control vs PFF and p = 0.0363 for PFF vs wtTIDM + PFF). Protein expression of α-syn in neurons was assessed after 12 h of co-culturing by immunocytochemistry followed by MFI analysis using ImageJ and at least 10 cells from each group per experiment were measured for MFI analysis (d, e, n = 3 experiments, p = 0.00097 for control vs PFF and p = 0.0065 for PFF vs wtTIDM + PFF). Activation of NF-κB in nigral DAergic neurons of experimental mice was monitored by phospho Ser536 p65 staining in TH+ neurons followed by MFI analysis using ImageJ (f, g, n = 5 animals, p = 0.000014 for A53T + PBS vs A53T + PFF and p = 0.0054 for A53T + PFF vs A53T + PFF + wtTIDM). Two sections from each brain were taken for the immunofluorescence analysis and value obtained from each section is shown in the graph. Images were captured at ×60 magnification and further zoomed. Activation of α-syn promoter by NF-κB was assessed by ChIP analysis using antibodies for p65, p50, p300, and RNA pol II, whereas IgG was used as the negative control. Immunoprecipitated DNA fragments were amplified by real-time PCR using primers mentioned in the “Methods” section (h, n = 3 animals, p65, p = 0.000021 for A53T + PBS vs A53T + PFF and p = 0.000021 for A53T + PFF vs A53T + PFF + wtTIDM; p50, p = 0.000011 for A53T + PBS vs A53T + PFF and p = 0.000012 for A53T + PFF vs A53T + PFF + wtTIDM; p300, p = 0.000009 for A53T + PBS vs A53T + PFF and p = 0.000016 for A53T + PFF vs A53T + PFF + wtTIDM; RNA Pol, p = 0.000004 for A53T + PBS vs A53T + PFF and p = 0.000003 for A53T + PFF vs A53T + PFF + wtTIDM). One-way ANOVA followed by Tukey’s multiple comparison tests was conducted for statistical analyses. *p < 0.05, **p < 0.01, ***p < 0.001 indicate significance compared to respective groups. Values are given as mean ± SD for cell culture analysis and mean ± SEM for in vivo analysis.
Fig. 7
Fig. 7. Intranasal administration of wtNBD peptide inhibits α-syn spreading in PFF-seeded A53T mice.
Propagation of α-syn in PFF-seeded mice brain was monitored in SN by immunostaining of pSyn129 and relative intensity measurement (a, b, p = 0.00001 for A53T + PBS vs A53T + PFF and p = 0.00001 for A53T + PFF vs A53T + PFF + wtNBD). Two sections from each brain were used for the staining and value obtained for each section is plotted in the graph. Spreading was also monitored by immunoblotting of total α-syn in Triton X-100 soluble (c, e, p = 0.0426 for A53T + PFF vs A53T + PFF + wtNBD) and insoluble fractions (d, f, p = 0.0067 for A53T + PBS vs A53T + PFF and p = 0.0078 for A53T + PFF vs A53T + PFF + wtNBD). The ratio of α-syn to actin is shown in the diagrams. Level of pSyn129 in the motor cortex was assessed by immunohistochemistry (g, h, p = 0.00003 for A53T + PBS vs A53T + PFF and p = 0.00017 for A53T + PFF vs A53T + PFF + wtNBD), where two sections from each brain were used for immunostaining and pSyn129-specific intensity was analyzed by Fiji. One-way ANOVA followed by Tukey’s multiple comparison tests was conducted for statistical analyses. **p < 0.01, ***p < 0.001 indicate significance compared to respective groups. Values are given as mean ± SEM (n = 4 animals per group).

References

    1. Feigin, V. L. et al. Global, regional and national burden of neurological disorders, 1990–2016: a systematic analysis for the Global Burden of Disease Study 2016. Lancet Neurol.18, 459–480 (2019). - PMC - PubMed
    1. Betarbet R, Sherer TB, Di Monte DA, Greenamyre JT. Mechanistic approaches to Parkinson’s disease pathogenesis. Brain Pathol. 2002;12:499–510. doi: 10.1111/j.1750-3639.2002.tb00468.x. - DOI - PMC - PubMed
    1. Bayer TA, et al. Alpha-synuclein accumulates in Lewy bodies in Parkinson’s disease and dementia with Lewy bodies but not in Alzheimer’s disease beta-amyloid plaque cores. Neurosci. Lett. 1999;266:213–216. doi: 10.1016/S0304-3940(99)00311-0. - DOI - PubMed
    1. Taguchi K, Watanabe Y, Tsujimura A, Tanaka M. Brain region-dependent differential expression of alpha-synuclein. J. Comp. Neurol. 2016;524:1236–1258. doi: 10.1002/cne.23901. - DOI - PubMed
    1. Hofer A, et al. The role of alpha-synuclein gene multiplications in early-onset Parkinson’s disease and dementia with Lewy bodies. J. Neural Transm. 2005;112:1249–1254. doi: 10.1007/s00702-004-0263-3. - DOI - PubMed

Publication types

MeSH terms

LinkOut - more resources