. 2021 Sep 10;4(1):1060.
doi: 10.1038/s42003-021-02610-3.

NetTCR-2.0 enables accurate prediction of TCR-peptide binding by using paired TCRα and β sequence data

Affiliations

NetTCR-2.0 enables accurate prediction of TCR-peptide binding by using paired TCRα and β sequence data

Alessandro Montemurro et al. Commun Biol. .

Abstract

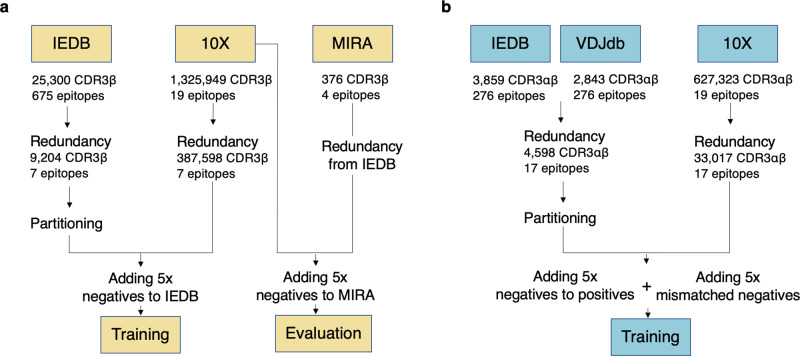
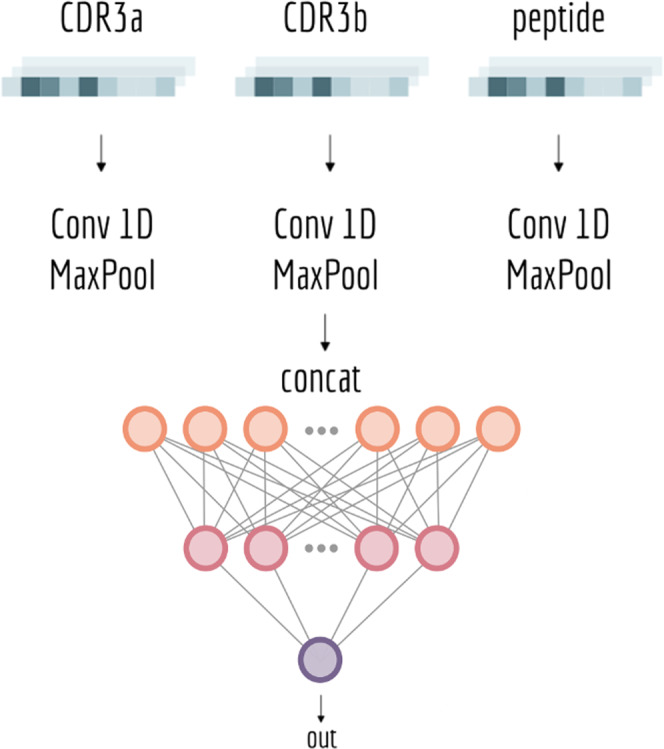
Prediction of T-cell receptor (TCR) interactions with MHC-peptide complexes remains highly challenging. This challenge is primarily due to three dominant factors: data accuracy, data scarceness, and problem complexity. Here, we showcase that "shallow" convolutional neural network (CNN) architectures are adequate to deal with the problem complexity imposed by the length variations of TCRs. We demonstrate that current public bulk CDR3β-pMHC binding data overall is of low quality and that the development of accurate prediction models is contingent on paired α/β TCR sequence data corresponding to at least 150 distinct pairs for each investigated pMHC. In comparison, models trained on CDR3α or CDR3β data alone demonstrated a variable and pMHC specific relative performance drop. Together these findings support that T-cell specificity is predictable given the availability of accurate and sufficient paired TCR sequence data. NetTCR-2.0 is publicly available at https://services.healthtech.dtu.dk/service.php?NetTCR-2.0 .


Conflict of interest statement

The authors declare no competing interests.

Figures

Fig. 1
Fig. 1. Performance of models trained on CDR3β data alone.
a Overall AUCs evaluated via cross-validation of different training data-partitioning thresholds for the baseline model and NetTCR. Partitioning thresholds are indicated in percent on the x-axis. b Overall AUCs evaluated on the MIRA sets at different thresholds (shown on the x-axis) using the model trained on the 94% similarity-partitioned data. The MIRA threshold represents the degree of separation between the training set and the MIRA set. c Peptide-specific AUCs for 94% partitioned cross-validation (CV) and external evaluation with a similarity threshold of 94%, colored by model.
Fig. 2
Fig. 2. Comparison between NetTCR and ERGO.
a Test AUCs per peptide for NetTCR and ERGO trained on four out of five partitions of the IEDB + 10X data set and evaluated on the left-out partition. b Peptide-specific AUCs for NetTCR and all the four variants of ERGO evaluated on the MIRA data.
Fig. 3
Fig. 3. Performance of models trained on paired-chain data.
a Overall AUCs evaluated via cross-validation. b, c Peptide-specific AUCs from the 90% and 95% partitioned data for the three most frequent peptides. d Peptide-specific AUCs colored by model and plotted against the number of positive data points.
Fig. 4
Fig. 4. Comparison between NetTCR and TCRdist.
Performance is evaluated via cross-validation on the 95% partitioned data for the three most frequent peptides.
Fig. 5
Fig. 5. Peptide-ranking analysis.
Each TCR positive to GIL, GLC, or NLV peptide was paired to the other two peptides and a binding prediction was obtained. The percentages show, for each peptide and for each model, the proportion of TCRs for which the predicted lowest-ranking peptide matched with the “true” target peptide.
Fig. 6
Fig. 6. t-SNE plot for the TCRs of the GIL peptide.
a The output from the max-pooled CNN layer of NetTCR trained on the 90% partitioned data set was extracted for each TCR specific to the GIL peptide using cross-validation, resulting in a set of vectors, each of dimension 160. T-SNE was used to visualize this data set in two dimensions. b In the input space, the TCRs were encoded using a 5-feature physicochemical encoding and then flattened into a vector. The perplexity hyperparameter of the t-SNE algorithm was chosen to be 40 and the number of iterations was set to 1000. In the plot, positive TCRs are shown in green, and negative TCRs in pink.
Fig. 7
Fig. 7. Hierarchical-clustered heatmaps of 50 positive GIL TCRs and 50 negatives.
The clustering was performed using both α- and β-sequences (a) or using single chains (α chain in b, β chain in c). Each row in the heatmap represents a TCR sequence in the max-pooled feature-space representation; the color bar on the side of each plot delineates whether the TCR is positive or negative. Cosine distance was used as a metric for clustering.
Fig. 8
Fig. 8. Benchmark performance on in-house TCR data set.
Methods included are NetTCR and baseline trained on paired CDR3α–CDR3β data (ab), CDR3α (a), CDR3β (b), and the LSTM-based ERGO trained on the VDJdb. Performance measures are (left) AUC, center (AUC 0.1), and right (PPV).
Fig. 9
Fig. 9. Data-partitioning pipeline schematics.
a Data-preparation pipeline for the β-chain data; b pipeline for the paired-chain data. The positive and negative data sets were each redundancy-reduced with the Hobohm 1 algorithm, according to a Levenshtein similarity threshold. The redundancy-reduced set of positives was partitioned into five groups using a single-linkage clustering algorithm. Negative data were subsequently added to each partition: for each peptide, 5 times the number of positives was randomly selected from the pool of nonredundant negative data. In a, to ensure that the MIRA external evaluation data did not share similarity with the training set, positive points from the MIRA set with a Levenshtein similarity above a certain threshold were removed. Each step of the pipeline is described in detail in the text.
Fig. 10
Fig. 10. Setup of NetTCR model.
The CDR3 and peptide sequences are encoded using the BLOSUM50 matrix. The encoded sequences are passed independently through a 1D convolutional layer and a max-pooling layer. The convolutional filter size is set to {1, 3, 5, 7, 9}, and for each filter size, 16 filters are used. The extracted features are then concatenated and fed into a dense layer with 32 hidden units. The output of the network consists of a single neuron, giving the binding probability.

References

    1. La Gruta NL, Gras S, Daley SR, Thomas PG, Rossjohn J. Understanding the drivers of MHC restriction of T cell receptors. Nat. Rev. Immunol. 2018;18:467–478. doi: 10.1038/s41577-018-0007-5. - DOI - PubMed
    1. Feng D, Bond CJ, Ely LK, Maynard J, Garcia KC. Structural evidence for a germline-encoded T cell receptor-major histocompatibility complex interaction “codon”. Nat. Immunol. 2007;8:975–983. doi: 10.1038/ni1502. - DOI - PubMed
    1. Rossjohn J, et al. T cell antigen receptor recognition of antigen-presenting molecules. Annu. Rev. Immunol. 2015;33:169–200. doi: 10.1146/annurev-immunol-032414-112334. - DOI - PubMed
    1. Vita R, et al. The immune epitope database (IEDB): 2018 update. Nucleic Acids Res. 2019;47:D339–D343. doi: 10.1093/nar/gky1006. - DOI - PMC - PubMed
    1. Bagaev DV, et al. VDJdb in 2019: database extension, new analysis infrastructure and a T-cell receptor motif compendium. Nucleic Acids Res. 2020;48:D1057–D1062. doi: 10.1093/nar/gkz874. - DOI - PMC - PubMed

Publication types

MeSH terms

Substances