. 2021 Sep 11;10(9):giab058.
doi: 10.1093/gigascience/giab058.

Scalable analysis of multi-modal biomedical data

Affiliations

Scalable analysis of multi-modal biomedical data

Jaclyn Smith et al. Gigascience. .

Abstract

Background: Targeted diagnosis and treatment options are dependent on insights drawn from multi-modal analysis of large-scale biomedical datasets. Advances in genomics sequencing, image processing, and medical data management have supported data collection and management within medical institutions. These efforts have produced large-scale datasets and have enabled integrative analyses that provide a more thorough look of the impact of a disease on the underlying system. The integration of large-scale biomedical data commonly involves several complex data transformation steps, such as combining datasets to build feature vectors for learning analysis. Thus, scalable data integration solutions play a key role in the future of targeted medicine. Though large-scale data processing frameworks have shown promising performance for many domains, they fail to support scalable processing of complex datatypes.

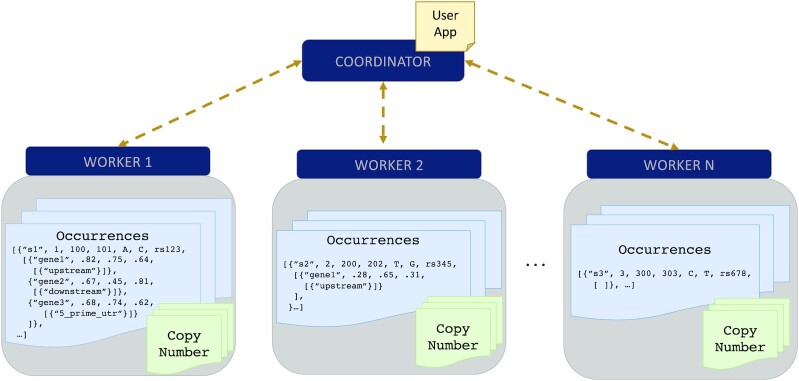
Solution: To address these issues and achieve scalable processing of multi-modal biomedical data, we present TraNCE, a framework that automates the difficulties of designing distributed analyses with complex biomedical data types.

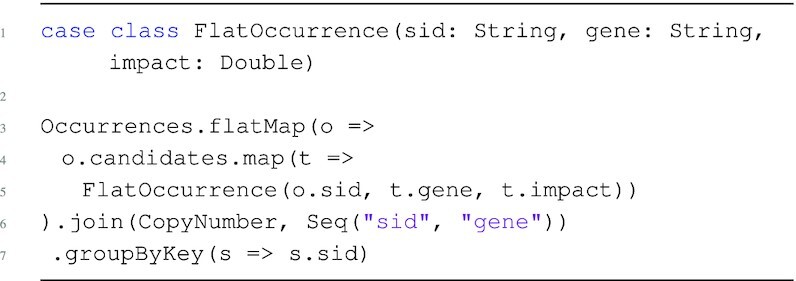
Performance: We outline research and clinical applications for the platform, including data integration support for building feature sets for classification. We show that the system is capable of outperforming the common alternative, based on "flattening" complex data structures, and runs efficiently when alternative approaches are unable to perform at all.

Keywords: Spark; distributed processing; multi-modal data integration; multi-omics analysis; nested data; query compilation.


Conflict of interest statement

The authors declare that they have no competing interests.

Figures

Figure 1:
Figure 1:
Set-up of a Spark cluster with distributed representation of Occurrences and CopyNumber cached in memory across N worker nodes. User applications are submitted to the coordinator, which delegates tasks to the worker nodes to support distributed execution. Figure 2 is an example of a user application.
Figure 2:
Figure 2:
Example Spark application that groups somatic mutations and copy number information by sample.
Figure 3:
Figure 3:
System architecture of TraNCE, presenting 2 compilation routes that result in executable code. The Spark cluster provides a schematic representation of the shredded compilation route, where the shredded inputs of Occurrences are cached in memory across worker nodes.
Figure 4:
Figure 4:
Workflow diagram representing the burden-based analyses for both genes and pathways, and downstream classification problem. The results of the pathway burden analysis feed into a classification analysis using multi-class and one-vs-rest methods to predict tumor of origin.
Figure 5:
Figure 5:
The accuracy and loss of the multi-class neural network for tumor tissue site.
Figure 6:
Figure 6:
Accuracy and loss for the tumor tissue site–based binary network; includes results for the 3 worst-performing classes from the multi-class network.
Figure 7:
Figure 7:
Summary of the cancer driver gene analysis. The pipeline starts by integrating somatic mutations and copy number variation and further integrates network information and gene expression data. The genes with the highest connectivity scores are taken to be drivers.
Figure 8:
Figure 8:
Performance comparison between the standard and shredded pipelines on gene and pathway burden analysis using the 1000 Genomes Project dataset.
Figure 9:
Figure 9:
Scalability for the driver gene analysis measured using HybridScores and HybridNetworks programs for a variety of cluster configurations.
Figure 10:
Figure 10:
Performance comparison of the skew-handling techniques for both the standard and shredded compilation routes. Queries are organized based on increasing amounts of skew, such that tumor sites is representative of low skew and gene families of high skew.
Figure 11:
Figure 11:
Mock-up of a clinical interface (i2b2) that enables integrative querying of clinical and genomic attributes.
Figure 12:
Figure 12:
Results for the clinical exploration programs. The standard compilation route fails for all runs with the Pancancer dataset.
None
None
None
None
None
None
None
None
None
None
None
None
None
None
None
None
None
None
None
None
None

References

    1. Hodson R. Precision medicine. Nature. 2016;537(7619):S49. - PubMed
    1. He KY, Ge D, He MM. Big data analytics for genomic medicine. Int J Mol Sci. 2017;18(2):412. - PMC - PubMed
    1. Coppola L, Cianflone A, Grimaldi AM, et al. Biobanking in health care: evolution and future directions. J Transl Med. 2019;17(1):172. - PMC - PubMed
    1. Auton A, Abecasis GR, Altshuler DM, et al. A global reference for human genetic variation. Nature. 2015;526(7571):68–74. - PMC - PubMed
    1. International Cancer Genome Consortium. 2020.

Publication types