. 2022 Feb 21;31(4):510-522.
doi: 10.1093/hmg/ddab235.

Genetic modeling of GNAO1 disorder delineates mechanisms of Gαo dysfunction

Affiliations

Genetic modeling of GNAO1 disorder delineates mechanisms of Gαo dysfunction

Dandan Wang et al. Hum Mol Genet. .

Abstract

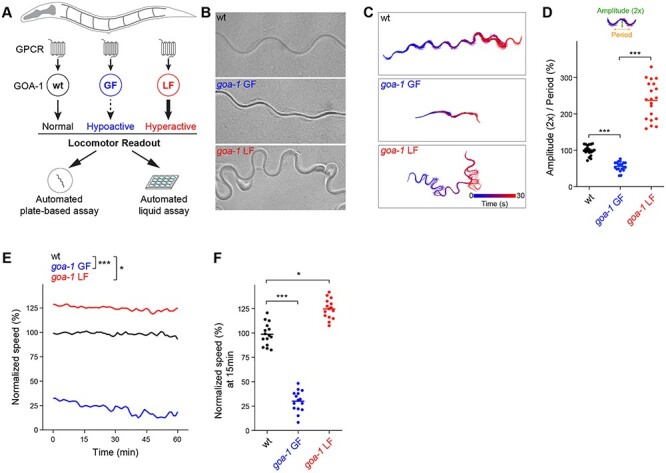
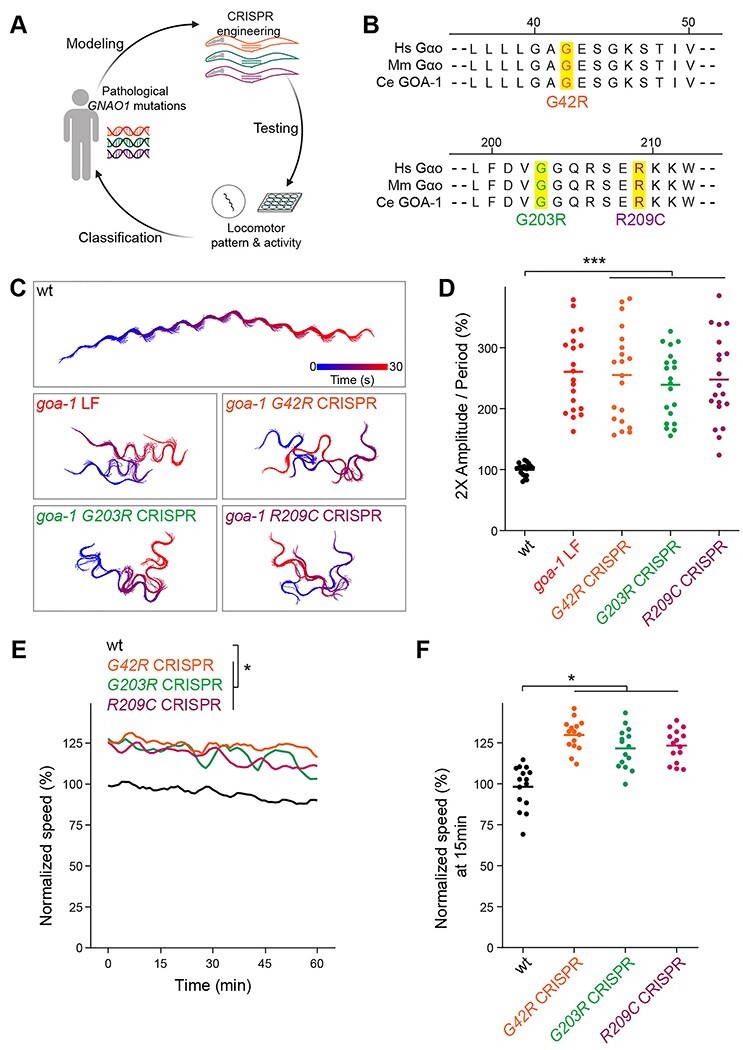
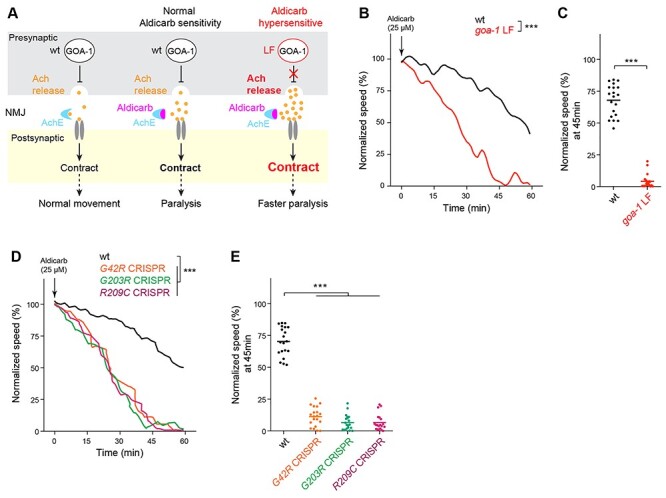
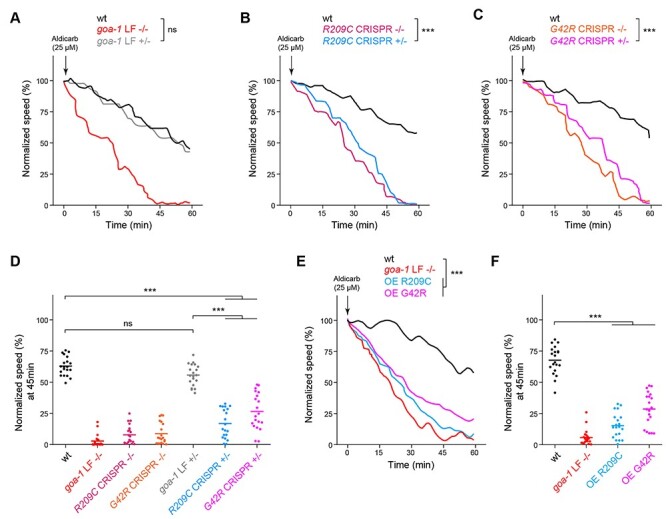
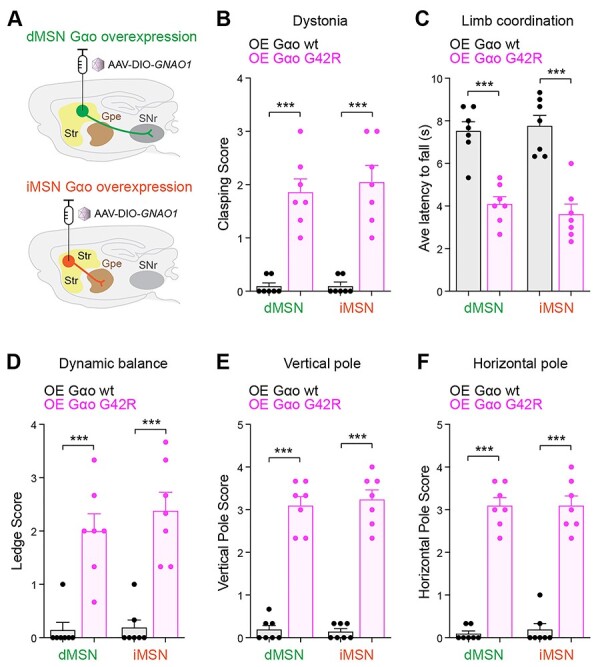
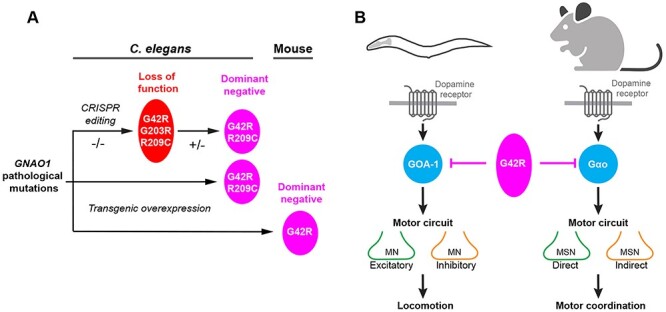
GNAO1 encephalopathy is a neurodevelopmental disorder with a spectrum of symptoms that include dystonic movements, seizures and developmental delay. While numerous GNAO1 mutations are associated with this disorder, the functional consequences of pathological variants are not completely understood. Here, we deployed the invertebrate C. elegans as a whole-animal behavioral model to study the functional effects of GNAO1 disorder-associated mutations. We tested several pathological GNAO1 mutations for effects on locomotor behaviors using a combination of CRISPR/Cas9 gene editing and transgenic overexpression in vivo. We report that all three mutations tested (G42R, G203R and R209C) result in strong loss of function defects when evaluated as homozygous CRISPR alleles. In addition, mutations produced dominant negative effects assessed using both heterozygous CRISPR alleles and transgenic overexpression. Experiments in mice confirmed dominant negative effects of GNAO1 G42R, which impaired numerous motor behaviors. Thus, GNAO1 pathological mutations result in conserved functional outcomes across animal models. Our study further establishes the molecular genetic basis of GNAO1 encephalopathy, and develops a CRISPR-based pipeline for functionally evaluating mutations associated with neurodevelopmental disorders.


Figures

Figure 1
Figure 1
Automated behavioral tracking indicates that canonical goa-1 LF and GF mutants have opposing locomotor defects. (A) Schematic showing GOA-1/Gαo function in C. elegans locomotion and design of automated behavioral paradigms. (B) Representative images of C. elegans wave form traces in plate-based locomotion assays for indicated genotypes. (C) Representative traces of locomotor waveforms acquired using automated behavioral tracking for indicated genotypes. (D) Quantitation of locomotor waveforms for indicated genotypes (n = 20 animals per genotype). Shown are parameters (2× amplitude and period) used for quantitative analysis. (E) Time course of automated tracking in liquid locomotor assays for indicated genotypes (n = 15 wells; 60 ~ 75 total animals per genotype). (F) Quantitation of mean speed (line) and speed per well (circles) after 15 min of automated tracking for each genotype (n = 15 wells; 60–75 animals per genotype). In all cases, mean speed was calculated every minute for each well and normalized to wild type for baseline locomotion (5 min) and for body size. For panels D and F, comparisons represent one-way ANOVA followed by post hoc Bonferroni's test. For panel E, comparisons represent two-way ANOVA followed by post hoc Bonferroni's test. *P < 0.05, ***P< 0.001.
Figure 2
Figure 2
CRISPR editing GNAO1 pathological mutations into conserved GOA-1 residues results in loss of function. (A) Experimental pipeline for functional evaluation of GNAO1 pathological variants using CRISPR editing of goa-1/Gαo in C. elegans. (B) Evolutionary conservation of key regions and residues edited by CRISPR in Gαo from humans (Hs) mice (Mm) and C. elegans (Ce). (C) Representative automated behavioral traces in plate-based locomotor assays for indicated genotypes. (D) Quantitation of plate-based locomotor assays for indicated genotypes (n = 20 animals per genotype). (E) Time course of automated tracking in liquid locomotor assays for indicated genotypes (n = 15 wells; 60–75 total animals per genotype). (F) Quantitation of mean speed (line) and speed per well (circles) after 15 min of automated tracking for each genotype (n = 15 wells; 60–75 animals per genotype). In all cases, mean speed was calculated every minute for each well and normalized to wild type for baseline locomotion (5 min) and for body size. For panels D and F, comparisons represent one-way ANOVA followed by post hoc Bonferroni's test. For panel E, comparisons represent two-way ANOVA followed by post hoc Bonferroni's test. *P < 0.05, ***P < 0.001.
Figure 3
Figure 3
GNAO1 pathological mutations cause loss of function effects during pharmacological manipulation of the C. elegans motor circuit. (A) Diagram illustrating pharmacological manipulation of the C. elegans motor circuit using the acetylcholinesterase inhibitor aldicarb (left, middle). goa-1 LF increases excitatory Ach release in the C. elegans motor circuit resulting in hypersensitivity to aldicarb (right). (B) Automated aldicarb assay shows canonical goa-1 LF mutants are hypersensitive to aldicarb. Arrow indicates drug application. (C) Quantitation of mean speed (line) and speed per well (circles) after 45 min of tracking in automated aldicarb assays for indicated genotype. (D) Automated aldicarb assays show three CRISPR edited mutants that are homozygous for GNAO1 pathological mutations (G42R, G203R, R209C) display aldicarb hypersensitivity. (E) Quantitation of mean speed (line) and speed per well (circles) after 45 min of tracking in automated aldicarb assays for indicated genotypes. In all cases, mean speed was calculated every minute for each well and normalized to baseline locomotion (10 min prior to addition of aldicarb) for each genotype. For panels B and D, comparisons represent two-way ANOVA followed by post hoc Bonferroni's test. For panel C, comparison represents two-tailed unpaired Student’s t-test. For panel E, comparisons represent one-way ANOVA followed by post hoc Bonferroni's test. For all experiments, n = 20 wells; 80 ~ 100 animals per genotype. ***P < 0.001.
Figure 4
Figure 4
Multiple genetic approaches demonstrate GNAO1 pathological mutations functions as dominant negative alleles in C. elegans. (A) Automated aldicarb assay showing homozygous animals carrying a goa-1 LF null allele are hypersensitive to aldicarb. In contrast, heterozygous goa-1 LF+/− animals show normal aldicarb responses compared to wild type. (B) Automated aldicarb assays show both heterozygous and homozygous goa-1 R209C CRISPR mutants are hypersensitive to aldicarb. (C) Automated aldicarb assays show both heterozygous and homozygous goa-1 G42R CRISPR mutants are hypersensitive to aldicarb. (D) Quantitation of mean speed (line) and speed per well (circles) after 45 min of tracking in automated aldicarb assays for indicated genotypes. (E) Automated aldicarb assay showing transgenic overexpression of GOA-1 R209C and G42R induce aldicarb hypersensitivity. (F) Quantitation of mean speed (line) and speed per well (circles) after 45 min of tracking in automated aldicarb assays for indicated genotypes. In all cases, mean speed was calculated every minute for each well and normalized to baseline locomotion (10 min prior to addition of aldicarb) for each genotype. For E and F, data shown is from 5 transgenic lines for each genotype. Data for individual transgenic lines is shown in Supplementary Material, Fig. S3. For panels A-C and E, comparisons represent two-way ANOVA followed by post hoc Bonferroni's test. For panels D and F, comparisons represent one-way ANOVA followed by post hoc Bonferroni's test. For all experiments, n = 20 wells; 80–100 animals per genotype. ***P < 0.001.
Figure 5
Figure 5
Overexpression of GNAO1 G42R in two populations of striatal neurons impairs locomotor behaviors in mice. (A) Schematic showing adeno-associated viral (AAV) particle delivery and overexpression of wt or G42R Gαo in two striatal neuron populations, dMSN and iMSN. (B) Quantitation of hindlimb clasping which indicates increased dystonia. (C) Quantitation of limb coordination based on latency to fall in backward walking test. (D, E & F) Quantitation of three motor coordination and balance tests (D) ledge test, (E) vertical pole test and (F) horizontal pole test. Comparisons represent two-tailed unpaired Student’s t-test. n = 7 animals per genotype. Error bars are SEM. ***P < 0.001.
Figure 6
Figure 6
Summary of functional genetic pipeline and outcomes with GNAO1 pathological mutations using C. elegans and mice. (A) Schematic summarizing cross-species genetic pipeline using CRISPR and transgenic approaches to evaluate GNAO1 pathological mutations in vivo. G42R, G203R and R209C disorder-associated mutations were found to impair Gαo/GOA-1 function. G42R and R209C mutations result in dominant negative effects across multiple functional genetic assays in C. elegans and mice. (B) Summary showing dominant negative effects of GNAO1 G42R pathological variant across C. elegans and mice, and similarities between Gαo function in locomotor behaviors of both C. elegans and mice.

References

    1. Hepler, J.R. and Gilman, A.G. (1992) G proteins. Trends Biochem. Sci., 17, 383–387. - PubMed
    1. Jiang, M. and Bajpayee, N.S. (2009) Molecular mechanisms of go signaling. Neurosignals, 17, 23–41. - PMC - PubMed
    1. Sternweis, P.C. and Robishaw, J.D. (1984) Isolation of two proteins with high affinity for guanine nucleotides from membranes of bovine brain. J. Biol. Chem., 259, 13806–13813. - PubMed
    1. de Oliveira, P.G., Ramos, M.L.S., Amaro, A.J., Dias, R.A. and Vieira, S.I. (2019) Gi/o-protein coupled receptors in the aging brain. Front. Aging Neurosci., 11, 89. - PMC - PubMed
    1. Masuho, I., Ostrovskaya, O., Kramer, G.M., Jones, C.D., Xie, K. and Martemyanov, K.A. (2015) Distinct profiles of functional discrimination among G proteins determine the actions of G protein-coupled receptors. Sci. Signal., 8, ra123. - PMC - PubMed

Publication types

MeSH terms

Substances