. 2021 Sep 16;184(19):4939-4952.e15.
doi: 10.1016/j.cell.2021.07.030. Epub 2021 Jul 27.

Emergence of an early SARS-CoV-2 epidemic in the United States

Affiliations

Emergence of an early SARS-CoV-2 epidemic in the United States

Mark Zeller et al. Cell. .

Abstract

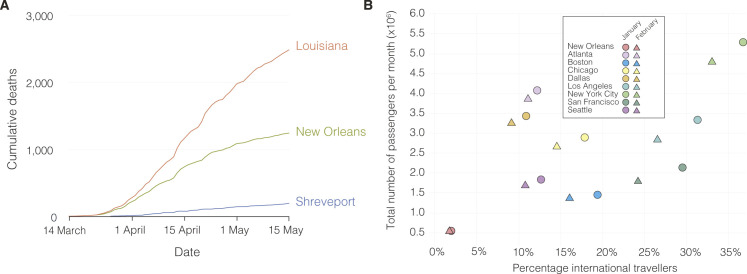
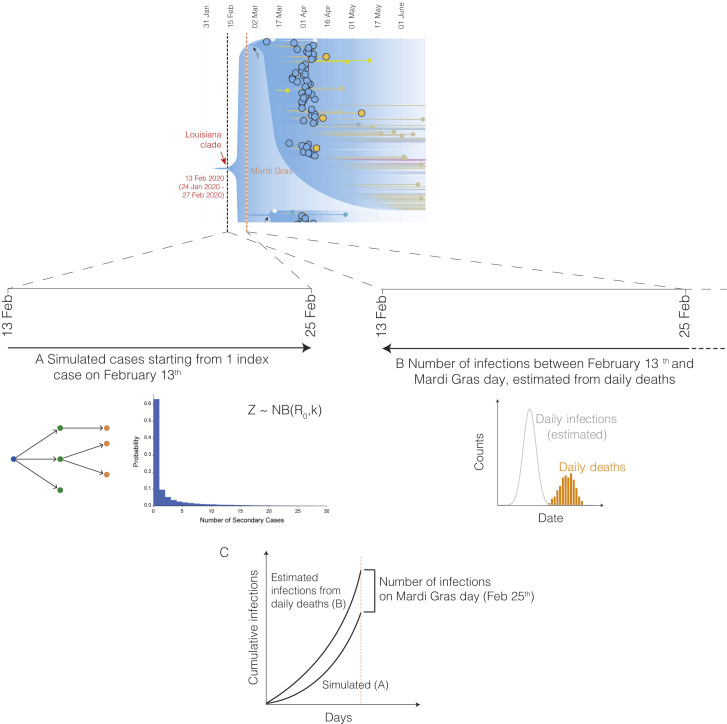
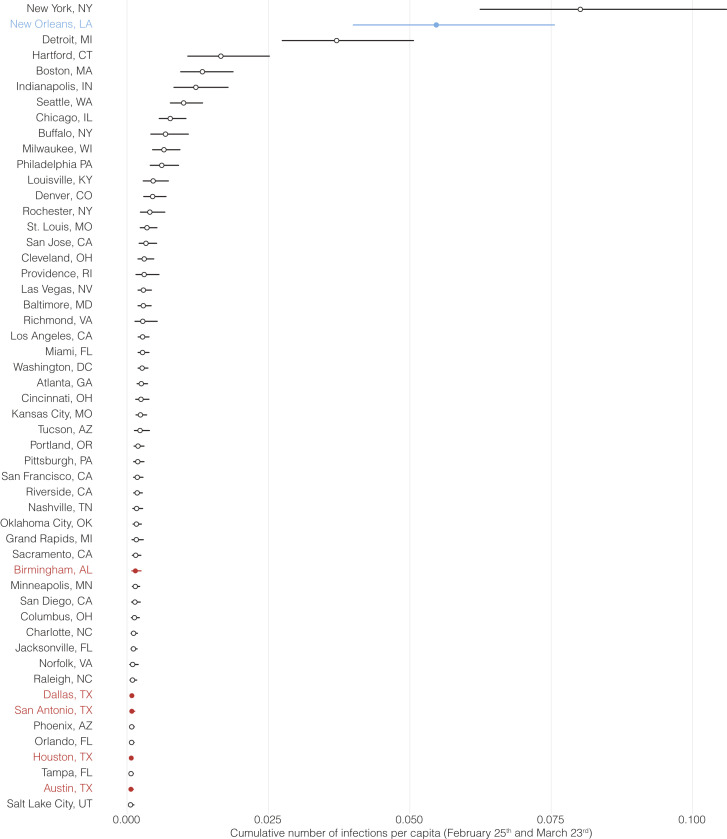
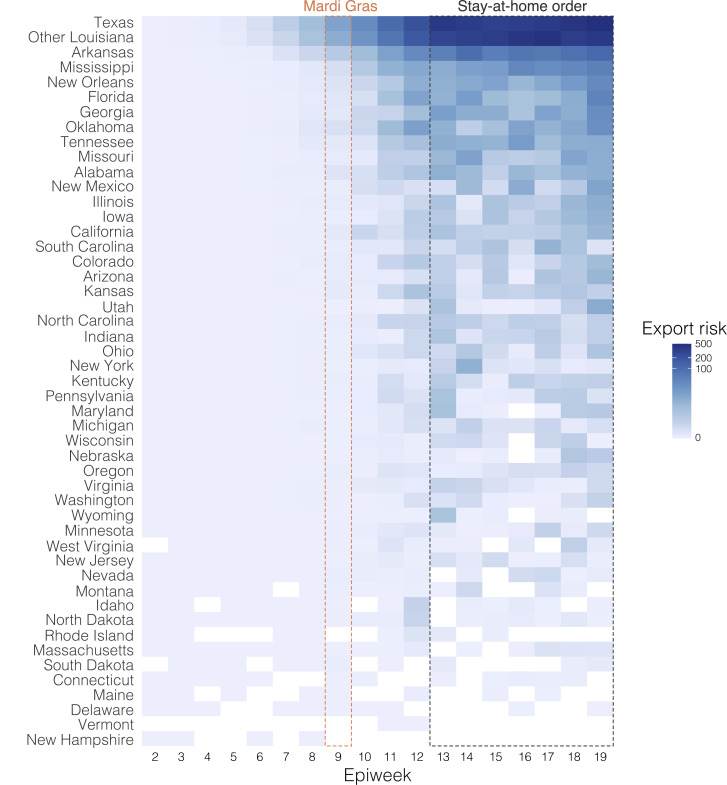
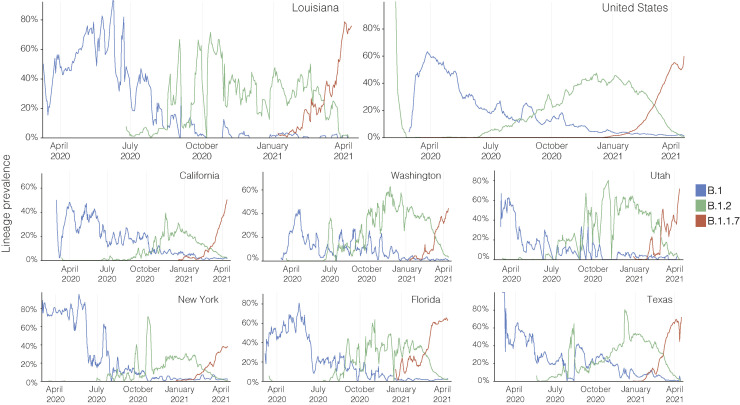
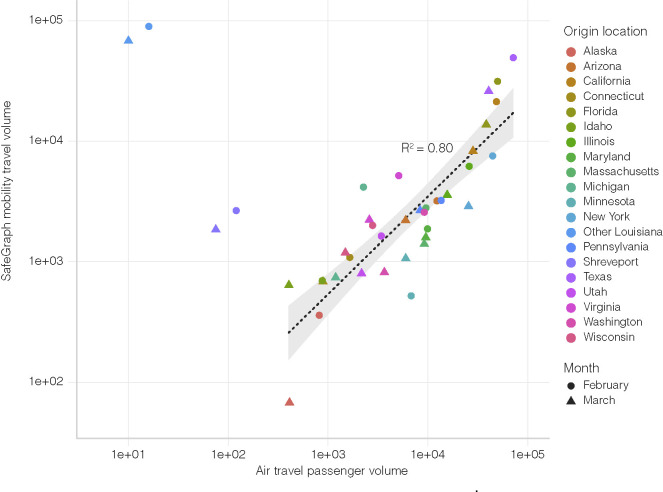
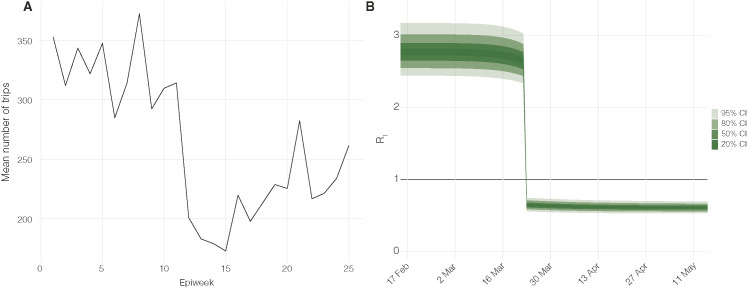
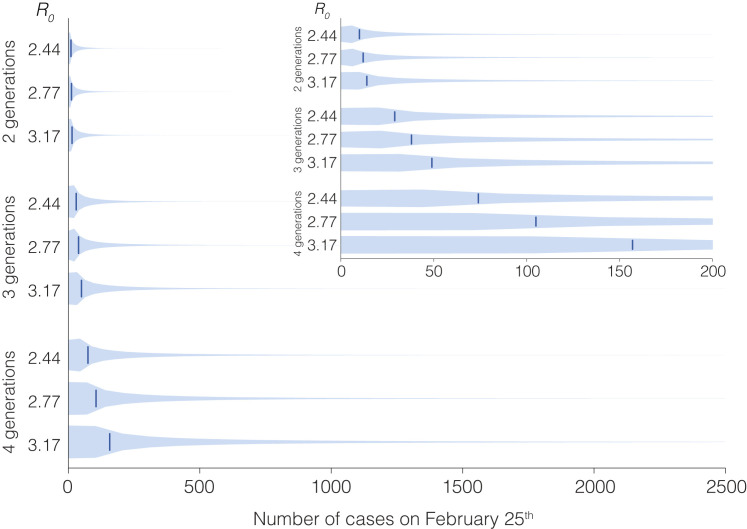
The emergence of the COVID-19 epidemic in the United States (U.S.) went largely undetected due to inadequate testing. New Orleans experienced one of the earliest and fastest accelerating outbreaks, coinciding with Mardi Gras. To gain insight into the emergence of SARS-CoV-2 in the U.S. and how large-scale events accelerate transmission, we sequenced SARS-CoV-2 genomes during the first wave of the COVID-19 epidemic in Louisiana. We show that SARS-CoV-2 in Louisiana had limited diversity compared to other U.S. states and that one introduction of SARS-CoV-2 led to almost all of the early transmission in Louisiana. By analyzing mobility and genomic data, we show that SARS-CoV-2 was already present in New Orleans before Mardi Gras, and the festival dramatically accelerated transmission. Our study provides an understanding of how superspreading during large-scale events played a key role during the early outbreak in the U.S. and can greatly accelerate epidemics.

Keywords: SARS-CoV-2; genomic epidemiology; mobility; phylogenetics; viral emergence; viral sequencing.


Conflict of interest statement

Declaration of interests M.A.S. reports grants from the National Institutes of Health, European Research Council, and Wellcome Trust during the conduct of this research and grants and contracts from the Bill & Melinda Gates Foundation, Janssen Research and Development, Private Health Management, IQVIA, and the U.S. Department of Veterans Affairs outside the submitted work. S.L.L., R.R., and D.J.N. are employed by BioInfoexperts LLC. R.F.G. reports grants from the National Institutes of Health, the Coalition for Epidemic Preparedness Innovations, the Burroughs Wellcome Fund, the Wellcome Trust, the Center for Disease Prevention and Control, and the European & Developing Countries Clinical Trials Partnership. He is the co-founder and Chief Scientific Advisor of Zalgen Labs, a biotechnology company developing countermeasures to emerging viruses, including SARS-CoV-2. K.G.A. has received consulting fees and compensated expert testimony on SARS-CoV-2 and the COVID-19 pandemic.

Figures

None
Graphical abstract
Figure 1
Figure 1
SARS-CoV-2 epidemiology in Louisiana (A) Epidemiological curve and number of sequenced samples in New Orleans, Shreveport and other parishes in Louisiana. (B) Sampling location of sequenced SARS-CoV-2 samples in Louisiana: New Orleans metro area (blue), Shreveport metro area (green), and other parishes in Louisiana (orange). (C) Maximum clade credibility tree of whole genome SARS-CoV-2 sequences sampled from Louisiana, U.S., and outside the U.S. The black circles show the strength of the posterior support for each node. (D) Domestic and international air travel passenger volumes to Louisiana in February and March. (E) Relative NextStrain clade prevalence per U.S. state up until May 15th (bottom). Number of sequences per U.S. state up until May 15th (top). (F) Shannon evenness of NextStrain clades per U.S. state in relation to available SARS-CoV-2 sequences.
Figure S1
Figure S1
Number of COVID-19 deaths and international arrivals in New Orleans in Louisiana, related to Figure 1 (A) Cumulative COVID-19 deaths during the first wave of the SARS-CoV-2 epidemic in Louisiana. (B) International arrivals for New Orleans and other major airports in the U.S. in January and February.
Figure S2
Figure S2
Overview of forward and backward simulation to determine the number of infections on Mardi Gras day, related to Figure 3 and STAR Methods (A) Forward simulation of cases starting with a single introduction on February 13th using a negative binomial branching process model (B). Estimated number of infections using the Epidemia model based on daily reported COVID-19 deaths (C). The number of infections on Mardi Gras day (February 25th) is determined by estimating the difference between the forward and backward simulated infections on Mardi Gras day.
Figure 2
Figure 2
Phylogenetic analysis of SARS-CoV-2 in Louisiana (A) Maximum likelihood tree of SARS-CoV-2 genomes sequenced from other parts of the U.S. and Louisiana. U.S. states that are not color-coded are indicated in gray. Arrows indicate clades. (B) Illustration of maximum clade credibility tree. Gradients are used to illustrate uncertainty in the topology and node heights. Numbered arrows are nodes with a relatively high posterior support and correspond to the arrows in panel A. The red colored arrow indicates the most recent common ancestor of SARS-CoV-2 in Louisiana and represents the start of local transmission in Louisiana. (C) Posterior distribution of the first emergence into New Orleans (blue) and Shreveport (green). The time of the first location transition (Markov jump) to New Orleans and Shreveport along the phylogenetic tree of each posterior sample was computed, and the posterior distribution was learned by summarizing across all the posterior samples.
Figure 3
Figure 3
Acceleration of SARS-CoV-2 transmission during Mardi Gras (A) Modeled incidence of SARS-CoV-2 in New Orleans based on registered COVID-19 deaths as inferred using Epidemia. The inset shows SARS-CoV-2 incidence in February and the hashed area indicates the cumulative number of COVID-19 cases up until Mardi Gras day (February 25th, 2020). (B) Forward simulation of the cumulative number of infections between the TMRCA (February 13th) and the end of Mardi Gras using a negative binomial branching process model. The red dotted lines indicate the estimated median number of infections. (C) Probability density curve of the number of COVID-19 cases required on Mardi Gras day to recapitulate the epi curve in New Orleans (random sampling of the probability distributions of A and B, see Figure S2 for additional details). The red dotted line indicates the median number of cases. The hashed area is the probability that no increased transmission occurred during Mardi Gras. The black lines indicate the probability of accelerated transmission by 100, 200, 300, 400, and 500 COVID-19 cases. (D) SARS-CoV-2 incidence inferred from reported COVID-19 deaths between Mardi Gras day and the statewide stay at home order in Louisiana for New Orleans, Shreveport, and 52 metro areas with a population of more than 1 million. (E) Lineage growth rate and normalized genetic distance of Pango lineages across counties in the United States. Lineage growth rate was calculated based on a 10-day interval after at least 5 sequences per week were reported. Variants of concern are outlined in red, whereas lineages that emerged during the first pandemic wave are outlined in black.
Figure S3
Figure S3
Cumulative number of SARS-CoV-2 infections, related to Figure 3 Median estimates for the number of SARS-CoV-2 infections and their 95% HPD between February 25th and March 23rd in 52 metro areas with a population of more than 1 million. New Orleans is indicated in blue, and regional metro areas closest to New Orleans are indicated in red.
Figure 4
Figure 4
Origin of SARS-CoV-2 emergence in Louisiana (A) Relative distribution of location transitions inferred by phylogeographic analysis, by origin state. Only location transitions that occurred before Mardi Gras day (February 25th) were included. (B) Estimated number of location transitions into New Orleans (left) and Shreveport (right). (C) Estimated number of travelers from states with the highest travel volumes to New Orleans, Shreveport, and other parishes in Louisiana. (D) Import risk to New Orleans. Import risk was estimated based on the number of infectious travelers relative to the population size and the total number of travelers at the origin (see Figure S10 for more details). Large Southern U.S. states and U.S. states that had early outbreaks of SARS-CoV-2 are color-coded. Other U.S. states that were included in the phylogenetic analysis are shown in gray. (E) Relative import risk into New Orleans. Gray area represents other U.S. states that were included in the phylogenetic analysis.
Figure 5
Figure 5
SARS-CoV-2 export risk from Louisiana (A) Estimated number of location transitions inferred by phylogeographic analysis from New Orleans (left) and Shreveport (right). On the right of each graph the number of sequences in the dataset belonging to clade 20C and the Louisiana clade is shown. The strength of a connection between a particular location and New Orleans/Shreveport is relative to the difference between the number of location transitions and the number of sequences in clade 20C. (B) Estimated number of infected travelers from New Orleans per week. The number of infected travelers was estimated based on local incidence and the total number of travelers between New Orleans and the destination. (C) Percentage of import risk in the lower 48 U.S. states that can be attributed to New Orleans in the four epidemiological weeks after Mardi Gras. Import risk was estimated based on the number of infectious travelers relative to the population size and the total number of travelers at the origin (see Figure S10 for more details). Inset shows local relative import risk from New Orleans within Louisiana.
Figure S4
Figure S4
Export risk from Shreveport per epiweek, related to Figure 5 Mardi Gras and the stay-at-home-order are indicated by the dotted lines.
Figure 6
Figure 6
Lineage and clade persistence of SARS-CoV-2 in Louisiana (A) Maximum likelihood tree of SARS-CoV-2 showing sequences collected throughout three consecutive epidemic waves in Louisiana. Sequences from Louisiana are annotated according to their epidemic phase, as shown in the epicurve inset. (B) Evolution of Louisiana clade prevalence over time. Sequences belonging to the Louisiana clade are indicated in (A) in blue. (C) Pango lineage distribution of SARS-CoV-2 sequences from Louisiana per epidemic phase. The total number of sequences in each phase is shown next to the graph.
Figure S5
Figure S5
Lineage prevalence during the epidemic in the United States, related to Figure 6 Lineage prevalence of B.1, B.1.2, and B.1.1.7 in the United States, Louisiana and other U.S states from March 2020 until April 2021.
Figure S6
Figure S6
Correlation between travel datasets, related to STAR Methods Air travel passenger volumes and SafeGraph mobility travel volumes from various U.S. states into New Orleans. Spearman rank correlation does not include Shreveport and Other Louisiana, since air travel is not the dominant mode of transport to New Orleans for these locations.
Figure S7
Figure S7
Estimates of mobility and epidemiological parameters, related to STAR Methods (A) Mean number of trips over each epiweek made within New Orleans, Louisiana. (B) Daily Rt estimated from daily deaths using Epidemia.
Figure S8
Figure S8
Sensitivity analysis for two parameters of the negative binomial branching process model, related to STAR Methods The total number of generations (between February 13th and 25th) and the R0 were varied independently.
Figure S9
Figure S9
Schematic showing when infectious cases would be likely to travel, related to STAR Methods Infectious cases are unlikely to travel after receiving a positive clinical test.
Figure S10
Figure S10
Underlying distributions to infer import and export risk, related to Figures 4 and 5 and STAR Methods (A) Gamma distribution of the time to onset of symptoms used to infer the number of infectious travelers. (B) Gamma distribution of the infectious period used to infer the number of infectious travelers. (C) Illustration of how the number of infectious travelers is derived from the number of cases. The number of infectious travelersa is used to calculate SARS-CoV-2 import risk. The panel shows how a 100 cases at day 1 result in a distribution of the infectious travelers several days later given heterogeneity in symptom onset and reporting, and assuming cases won’t travel after having received a positive SARS-CoV-2 test.

Update of

  • Emergence of an early SARS-CoV-2 epidemic in the United States.
    Zeller M, Gangavarapu K, Anderson C, Smither AR, Vanchiere JA, Rose R, Snyder DJ, Dudas G, Watts A, Matteson NL, Robles-Sikisaka R, Marshall M, Feehan AK, Sabino-Santos G Jr, Bell-Kareem AR, Hughes LD, Alkuzweny M, Snarski P, Garcia-Diaz J, Scott RS, Melnik LI, Klitting R, McGraw M, Belda-Ferre P, DeHoff P, Sathe S, Marotz C, Grubaugh N, Nolan DJ, Drouin AC, Genemaras KJ, Chao K, Topol S, Spencer E, Nicholson L, Aigner S, Yeo GW, Farnaes L, Hobbs CA, Laurent LC, Knight R, Hodcroft EB, Khan K, Fusco DN, Cooper VS, Lemey P, Gardner L, Lamers SL, Kamil JP, Garry RF, Suchard MA, Andersen KG. Zeller M, et al. medRxiv [Preprint]. 2021 Feb 8:2021.02.05.21251235. doi: 10.1101/2021.02.05.21251235. medRxiv. 2021. Update in: Cell. 2021 Sep 16;184(19):4939-4952.e15. doi: 10.1016/j.cell.2021.07.030. PMID: 33564781 Free PMC article. Updated. Preprint.

References

    1. Althouse B.M., Wenger E.A., Miller J.C., Scarpino S.V., Allard A., Hébert-Dufresne L., Hu H. Superspreading events in the transmission dynamics of SARS-CoV-2: Opportunities for interventions and control. PLoS Biol. 2020;18:e3000897. - PMC - PubMed
    1. Ayres D.L., Cummings M.P., Baele G., Darling A.E., Lewis P.O., Swofford D.L., Huelsenbeck J.P., Lemey P., Rambaut A., Suchard M.A. BEAGLE 3: Improved Performance, Scaling, and Usability for a High-Performance Computing Library for Statistical Phylogenetics. Syst. Biol. 2019;68:1052–1061. - PMC - PubMed
    1. Bedford T., Greninger A.L., Roychoudhury P., Starita L.M., Famulare M., Huang M.-L., Nalla A., Pepper G., Reinhardt A., Xie H., et al. Seattle Flu Study Investigators Cryptic transmission of SARS-CoV-2 in Washington state. Science. 2020;370:571–575. - PMC - PubMed
    1. Bloomquist E.W., Lemey P., Suchard M.A. Three roads diverged? Routes to phylogeographic inference. Trends Ecol. Evol. 2010;25:626–632. - PMC - PubMed
    1. Centers for Disease Control (2020a). https://www.cdc.gov/media/releases/2020/p0121-novel-coronavirus-travel-c... (Centers for Disease Control).

Publication types